*Correspondence: K. Basavaiah. Department of Chemistry, University of Mysore, Manasagangothri, Mysore-570006, India. Fax: 0091-821-2421263, 2516133). E-mail: [email protected]
A
rti
Pharmaceutical Sciences vol. 46, n. 1, jan./mar., 2010
Sensitive spectrophotometric assay of simvastatin in
pharmaceuticals using permanganate
Kalsang Tharpa
1, Kanakapura Basavaiah
1,*, Nagaraju Rajedraprasad
1,
Kanakapura Basavaiah Vinay
1, Salmara Ganeshbhat Hiriyanna
21Department of Chemistry, University of Mysore, 2Process Analytical Laboratory, Advinus Therapeutics
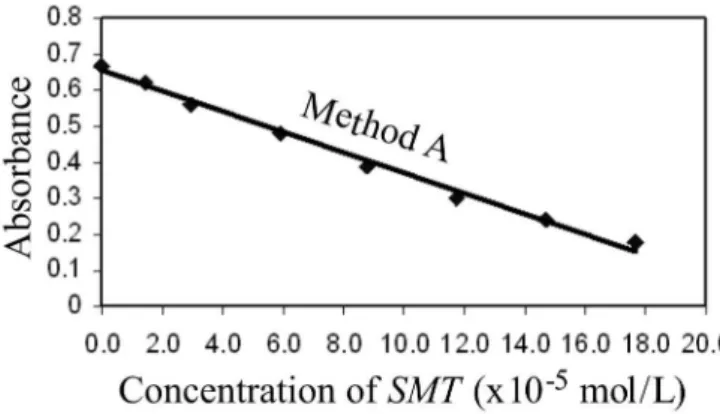
Two simple, sensitive, selective and inexpensive spectrophotometric methods are described for the determination of simvastatin (SMT) in bulk drug and in tablets using permanganate as the oxidimetric reagent. In method A, SMT is treated with a measured excess of permanganate in acetic acid medium and the unreacted oxidant is measured at 550 nm, whereas in method B the reaction is carried out in alkaline medium and the resulting manganate is measured at 610 nm. In method A, the amount of permanganate reacted corresponds to the SMT content and the absorbance is found to decrease linearly with the concentration; and in method B, the absorbance increases with concentration. The working conditions of assays were optimized, and the methods were validated according to the current ICH guidelines. Under optimum conditions, SMT could be assayed in the concentration ranges, 1.47 – 17.67x10⁻⁵ and 2.27 – 27.18
x10-6 mol/Lby method A and method B, respectively. The calculated molar absorptivities are 3.2 x 10³
and 2.5 x 10⁴ L/mol/cm for method A and method B, respectively with corresponding Sandell sensitivity
values of 0.0387 and 0.0178 µg/cm2. The limits of detection (LOD) and quantiication (LOQ) have also
been reported. Accuracy and precision for the assay were determined by calculating the intra-day and inter-day at three concentrations; the intra-day RSD was < 2% and the accuracy was better than 2.15 % (RE). The methods were applied successfully for the determination of SMT in tablet dosage form with a high percentage of recovery, good accuracy and precision, and without measurable interference by the excipients. The accuracy was further ascertained from placebo and synthetic mixture analysis and also from the spike-recovery method.
Uniterms: Simvastatin assay. Spectrophotometry. Permanganate. Pharmaceutical products.
Dois métodos espectrofotométricos simples, sensíveis, seletivos e baratos são descritos para a determinação de sinvastatina (SMT) a granel e em comprimidos, utilizando permanganato como reagente oxidimétrico. No método A, a SMT é tratada com excesso conhecido de permanganato em meio de ácido acético e o oxidante que não reage é medido a 550 nm, enquanto no método B, a reação é efetuada em meio alcalino e o manganato resultante é medido a 610 nm. No método A, a quantidade de permanganato que reage corresponde ao conteúdo de SMT e a absorbância diminui linearmente com o aumento da concentração; no método B, a absorbância aumenta com o aumento da concentração. As condições de trabalho do ensaio foram otimizadas e os métodos, validados de acordo com as normas do ICH. Sob condições ótimas, a SMT pode ser ensaiada nas faixas de concentração de 1,47– 17,67x10⁻⁵ e de2,27–27,18 x10⁻⁶
mol/L pelo método A e B, respectivamente. As absortividades molares calculadas são 2 x 10³ e 2,5 x 10⁴
L/ mol/cm, respectivamente, para os métodos A e B, com os valores correspondentes de sensibilidade de Sandell de 0,0387 e 0,0178 µg/cm2. Os limites de detecção (LOQ) também foram relatados. A exatidão
e a precisão do ensaio foram determinadas pelo cálculo de três concentrações intra- e inter-dia; a RSD intra-dia foi <2% e a exatidão foi melhor que 2,15% (RE). Os métodos foram aplicados com sucesso à determinação de SMT em comprimidos com alta porcentagem de recuperação, boa exatidão e precisão e sem interferência mensurável dos excipientes. A exatidão foi posteriormente determinada no placebo e na mistura sintética e, também, pelo método de spike recovery.
INTRODUCTION
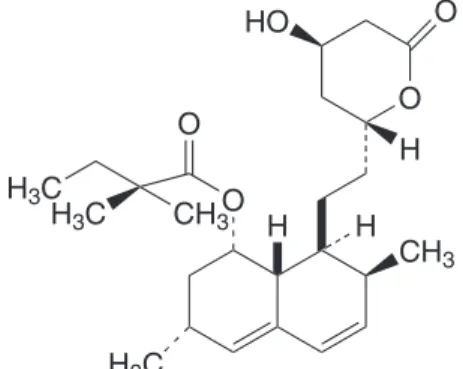
Simvastatin (SMT), chemically known as (1S, 2S, 8S, 8aR)-1,2,6,8,8a-hexahydro-1-(2-((2R, 4R)-tetrahyro-4- hydroxy-6-oxo-2H-pyran-2-yl)-2,6-dimethylnapthalen-8-yl 2,2-dimethhydroxy-6-oxo-2H-pyran-2-yl)-2,6-dimethylnapthalen-8-ylbutanoate (Figure 1), belongs to the group of cholesterol-lowering lactones known as statins which, in 2007, were identiied as being among the most widely prescribed drugs in the world. Statins lower cholesterol by inhibiting the synthesis of movalinic acid, which is the key precursor in cholesterol synthesis. SMT has been shown to be effective as an antilipemic agent. It is administered as a pro drug, and in the liver it is hydrolysed to the ß-hydroxy acid form (Mc Evoy, 2002). The drug is oficially listed in the 2004 United States Pharmacopoeia and the oficial method of its determination is high-performance liquid chromatography (The United State Pharmacopoeia, 2002). Various other methods such as UV-spectrophotometry (Erk, 2002; Xu, 2001; Zhonghong, Shurong 2000; Wang, Asgharnejad, 2000; Arayne et al., 2007; Carlcucci, Ma-zzeo, 1992), HPLC (Carlcucci, MaMa-zzeo, 1992; Jianwei, Ying, 2005; Ali et al., 2006; Carolina et al., 2004, Xan et al., 2000; Wang, 2000), HPTLC (Chandhari et al., 2007), micellar electrokinetic chromatography (Srinivasu et al., 2002) and voltammetry (Coruh, Ozkan, 2006) have been reported for the assaying of SMT in pharmaceuticals. There is only one report on the use of visible spectrophotometry which describes three methods (Saradhi et al. 2007) for SMT. One procedure is based on the reduction of iron (III) by SMT to iron (II) and subsequent formation of prussian blue with ferricyanide measurable at 730 nm. In the other two procedures, the iron (II) formed is chelated with 1,10-phenanthroline or 2,2’-bipyridine followed by
measurement of absorbance at 480 or 490 nm. The present paper describes two visible spectrophotometric methods using KMnO4 as an oxidizing agent in both acid and basic medium. Simplicity, sensitivity wide linear ranges, mild experimental conditions and above all cost-effectiveness
characterize the proposed methods. Further, the methods were found to possess adequate accuracy and precision.
EXPERIMENTAL
Apparatus
A Systronics model 106 digital spectrophotometric with 1-cm matched quartz cells was used for all absorban-ce measurements.
Reagents and materials
All chemicals used were of analytical reagent gra-de and distilled water was used to prepare all solutions. Potassium permanganate (1x10⁻² mol/L) was prepared by
dissolving about 0.395 g of the chemical (Merck, Mumbai, India) in water and diluting to 250 mL; and standardized using H.A Bright’s procedure (A.I. Vogel, 3rd edition,
1961, p. 280). It was further diluted to 3.164 x 10⁻³ mol/L
KMnO4 for method A and 6.328 x 10⁻³ mol/LKMnO 4 for
method B. Acetic acid (3:2) was prepared by diluting con-centrated acetic acid (Merck, Mumbai, India, Sp. gr. 1.05) appropriately with water. Sodium hydroxide solution (0.3 and 0.5 mol/L) was prepared by dissolving the chemical (Merck, Mumbai, India) in water. Pharmaceutical grade SMT, certiied to be 99.88% pure, was kindly provided by Jubiliant Organosis, Nanjangud, India, as a gift and was used as received. A 2.944x10⁻³ mol/LSMT was prepared
by dissolving 32.5 mg of SMT in 3:2 acetic acid and made up to 250 mL with the same acid used for method A. A 9.059x10⁻⁵ mol/LSMT was prepared by dissolving 10 mg
of SMT in 0.3 mol/L NaOH with the aid of heat and made up to 250 mL with 0.3 mol/L NaOH and used in method B. Tablets containing SMT such as Zosta (USV Ltd, India) and Simvas (Micro labs Ltd, India) were purchased from the local market.
METHODS
Method A
Different aliquots of standard solution (0.5-6.0 mL, 2.944 x 10⁻⁴ mol/L) of pure SMT were transferred into a
series of 10 mL calibrated lasks by means of micro burette and the total volume was adjusted to 6.0 mL with 3:2 acetic acid. A volume of 1 mL of 3.164 x 10⁻³ mol/LKMnO
4 was
added to each lask accurately, and kept aside for 10 min with occasional swirling before diluting to the mark with water. The absorbance was recorded at 550 nm against a water blank.
O O HO
H O
H3C
CH3 H H3C
CH3 H3C
O
H
Method B
Into a series of 10 mL calibrated lasks, 0.25-3.0 mL of 9.059 x 10⁻⁵ mol/L pure SMT solution were buretted and
the total volume was made up to 3.0 mL with 0.3 mol/L NaOH. To each lask was added 1 mL of 0.5 mol/L NaOH followed by 1 mL of 6.328 x 10⁻³ mol/LKMnO
4 solution.
The flasks were kept aside for 20 min with occasional shaking and the volume was made up to the mark with water. The absorbance was recorded at 610 nm against the reagent blank.
Assay procedure for tablets
Twenty tablets were accurately weighed and pow-dered. A portion of tablet powder equivalent to 20 mg of SMT was accurately weighed into a 100 mL calibrated lasks, 40 mL of 3:2 acetic acid was added and shaken for 20 min. Then, the volume was made up to the mark with the same acid, mixed well and iltered using a Whatman No. 42 ilter paper. First, a 10 mL portion of the iltrate was rejected and a convenient aliquot (around 2 or 3 mL) was subjected to analysis by the procedure described under method A. Another portion of the tablet powder containing 20 mg of SMT was accurately weighed and transferred to a separating funnel containing about 40 mL of water and
mixed. The content was extracted with 5 x 5mL portions of chloroform, where the combined organic layer was dried over anhydrous sodium sulphate, and transferred into a dry beaker and evaporated to dryness in a water bath. The residue was dissolved in 0.3 mol/L NaOH with the aid of heat and transferred to a 100 mL volumetric lask and diluted to the mark with 0.3 mol/L NaOH. The solution was diluted to 9.059 x 10⁻⁵ mol/LSMT with the same alkali
solution and the analysis was completed by following the procedure given under method B.
RESULTS AND DISCUSSION
The methods are based on the oxidation of SMT by KMnO4 in either acid or alkaline medium followed by measurement of the residual permanganate at 550 nm in method A or the reduced manganate at 610 nm in method B. The possible reaction scheme is given in Figure 2.
Optimization of experimental conditions
In method A, when a ixed concentration of perman-ganate was reacted with increasing concentrations of SMT in acetic acid medium, there occurred a concomitant fall in the concentration of permanganate as revealed by the decreasing absorbance at 550 nm (Figure 3 and Figure 4), which served
SMT + KMnO4
Oxidation product of SMT + Mn2++ Unreacted KMnO 4
Oxidation product of SMT + MnO
4
2-H+, Method A
OH -, Method
B
(Absorbance Measured at 550 nm)
(Bluish-green colour, measured at 610 nm)
FIGURE 2 - Tentative reaction scheme.
as the basis for quantification. A preliminary experiment showed that permanganate can be determined up to 3.164 x 10⁻⁴ mol/Lat 550 nm in the acid medium employed (Figure
5). Hence, different concentrations of SMT were reacted with 1 mL of 3.164 x 10⁻³ mol/LKMnO
4 to determine the
concen-tration range over which SMT could be determined. One ml of 3.164 x 10⁻³ mol/L KMnO
4 must be accurately added in
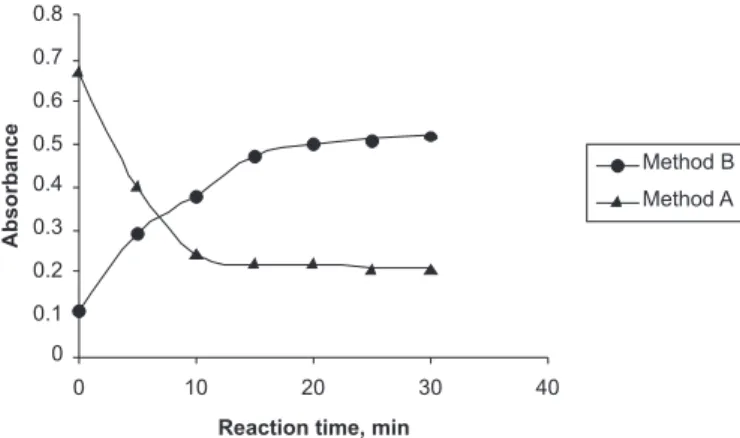
all the reaction lasks since KMnO4 absorbs maximally at the analytical wavelength, and small changes in the volume of KMnO4 have a critical effect on the absorbance reading. The solvent used to dissolve SMT was 3:2 acetic acid, and below this concentration of acetic acid, SMT remained insoluble. The same acid concentration was used as a reaction medium. There was no effect of increasing the concentration of acetic acid on the reaction parameters. To check the effect of acid concentration on the reaction, 1-5 mL of 1 mol/L H2SO4 was added to the ixed concentration of SMT and KMnO4, and it was observed that there was absolutely no change in the absorbance. The effect of hydrochloric acid was not studied since KMnO4 being a strong oxidizing agent would react with HCl to liberate chlorine. The reaction between SMT and KMnO4 in acetic acid medium was complete in 10 min
(Figu-re 6), and the absorbance of the measu(Figu-red un(Figu-reacted KMnO4 was found to be stable up to 40 min thereafter. Two blanks were prepared for the study. The reagent blank consisted of acid and permanganate showed maximum absorbance (equal to the intercept). A second blank in the absence of SMT and KMnO4 had negligible absorbance, and hence measurements were made against a water blank.
Potassium permanganate quantitatively oxidizes SMT in the presence of NaOH in method B, resulting in the formation of a bluish-green color manganate ion (Mann and Sounders, 1974) which showed an absorption peak at 610 nm (Figure 7) and served as the basis for the calibration graph (Figure 3). Increase in the concentration of KMnO4 could enhance sensitivity of the method but the blank absorbance also increased concomitantly. The effect of KMnO4 concentration on the sensitivity of the reaction (Figure 8) was ascertained, and based on this the optimum concentration was ixed at 6.3278 x 10⁻⁴ mol/L. Order of
addition of NaOH is critical. When NaOH was added after the addition of KMnO4 to SMT, small brown particles with slightly greenish turbidity developed, possibly due to the formation of MnO2 in weak alkaline medium. One mL of FIGURE 4 - Method A: Effect of SMT concentration on the
absorbance of 3.164 x 10⁻⁴ mol/L KMnO
4 (A.0.0; B.1.47; C.2.94;
D.5.89; E.8.83; F.11.78; G.14.72 and H.17.67 x 10-5 mol/L SMT).
FIGURE 5 - Linear relation between absorbance at 550 nm and
KMnO4 concentration.
FIGURE 6 - Effect of reaction time between KMnO4 and SMT
in method A and method B.
FIGURE 7 - Absorption spectra for method B. (Bluish green
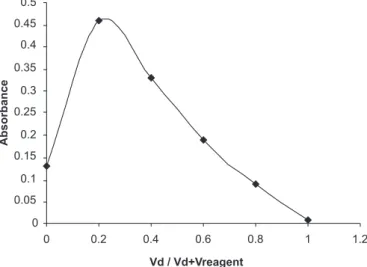
0.5 mol/L NaOH in the total volume of 10 mL was ixed because there was no appreciable effect on the reaction time and sensitivity when the volume of 0.5 mol/L NaOH was varied from 0.5-2.0 mL. The reaction was complete in 20 min where the contact time was not critical and any delay up to 40 min had no effect on the absorbance. The absorbance of the measured color was constant for 50 min in the presence of unreacted KMnO4 and the reaction product. In both the methods, the reaction rate was not studied at higher temperature since both the reactions reached completion within a reasonable time. The Job’s method of continuous variation was applied to establish the stoichiometric ratio of SMT to KMnO4 in basic medium and was found to be 1: 4 (SMT:KMnO4) (Figure 9).
Analytical data
A linear correlation was found between absorbance at λ
max and concentration of SMT in the ranges given in
Table I. This correlation establishes an inverse relation between SMT and permanganate. This behavior was pos-sible because the latter follows the Beer-Lambert’s law. The inverse linear relationship inmethod A is described by the regression equation:
Y = a − bX
(Where Y = absorbance of 1-cm layer of solution; a = FIGURE 8 - Effect of KMnO4 concentration for method B.
FIGURE 9 - Job’s continuous variations plot.
TABLE I- Regression and Analytical parameters
Parameter Method A Method B
λ
max, nm 550 610
Range concentration limits, mol/L 1.47 – 17.67 x 10⁻⁵ 2.27 – 27.18 x 10⁻⁶
Apparent molar absorptivity, L/ mol/ cm 3.2 x 10³ 2.5 x 10⁴
Sandell sensitivity*, µg/cm2 0.0387 0.0178
Limit of detection, mol/L 3.13 x 10⁻⁶ 1.29 x 10⁻⁶
Limit of quantiication, mol/L 1.04 x 10⁻⁵ 1.33 x 10⁻⁶
Regression equation, Y** Intercept (a)
Slope (b) -0.00620.6427 0.02090.0510
Correlation coeficient, (r) -0.9961 0.9987
Sa 0.01601 0.01130
Sb 0.00025 0.00112
*Is a sensitivity parameter in µg/cm2SMT corresponding to an absorbance of 0.001 measured in a cuvette of cross-sectional area
1 cm2 and L= 1cm.
Y** = a ± bX, where Y is the absorbance and X concentration in mol/L; S
a= Standard deviation of intercept; Sb= Standard deviation
intercept; b = slope and X = concentration in mol/L). Regression analysis of the linear relation data using the method of least squares was performed to evaluate the slope (b), intercept (a) and correlation coeficient (r) for each system, and the values are presented in Table I. The optical characteristics such as range concentration limits, apparent molar absorptivity and Sandell sensi-tivity values of both methods are also given in Table I. The limits of detection (LOD) and quantiication (LOQ) calculated according to ICH guidelines (1996) are also presented in Table I.
Method Validation
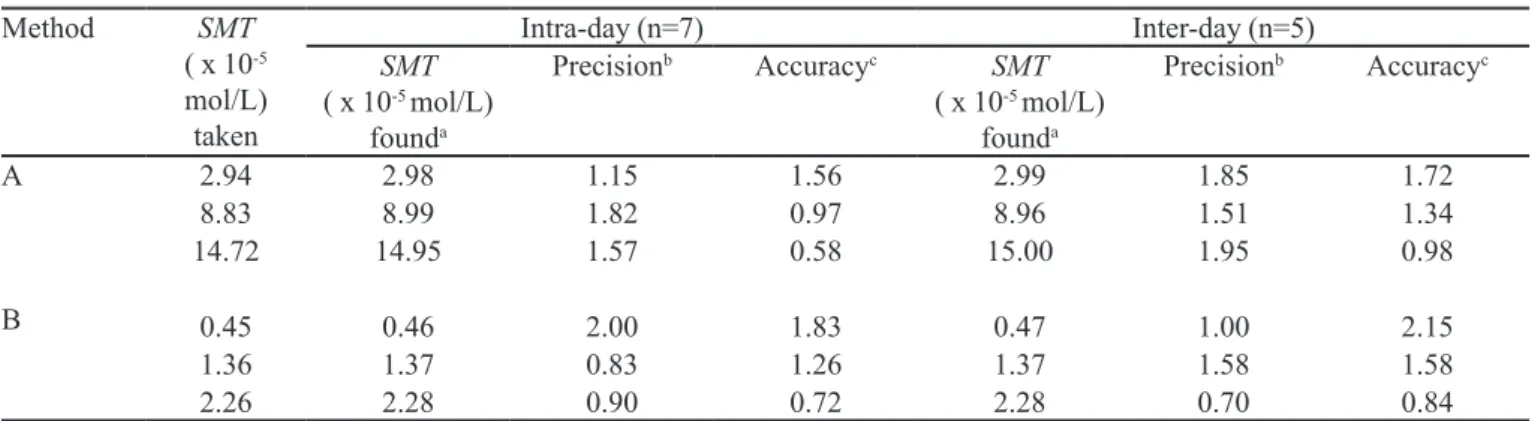
Assay precision and accuracy
The precision of the methods was calculated in terms of intermediate precision (intra-day and inter-day) (SHABIR, G.A, 2003). Three different concentrations of SMT were analyzed in seven replicates during the same day (intra-day precision) and for ive consecutive days (inter-day precision). The RSD (%) values of intra-day and inter-day studies showed that the precision was good (Table III). The accuracy of an analytical method expresses the closeness between the reference value and the found value. Accuracy was evaluated as percentage relative error between the measured concentrations and concentrations taken for SMT (Bias %). The results obtai-ned are compiled in Table II and show that the accuracy is good.
Method Selectivity
Selectivity was evaluated by recovery studies. A synthetic mixture consisting of 20 mg sodium alginate, 30 mg magnesium stearate, 20 mg lactose, 20 mg acacia, 50 mg talc and 30 mg starch besides 20 mg of SMT was prepared and analyzed after extraction into acetic acid in
method A, and into chloroform in the case of method B, as described under analysis of tablets. The percent recovery of SMT was 98.64 ± 0.86 and 96.58 ± 0.63 for method A and method B, respectively. This conirms the selectivity of methods under the optimized conditions.
Placebo analysis
Placebo analysis was carried out in order to ind the interference. A placebo blank consisting of 20 mg sodium alginate, 30 mg magnesium stearate, 20 mg lactose, 20 mg acacia, 50 mg talc and 30 mg starch but without SMT was prepared and analyzed as described under “procedure for tablets”. There was absolutely no interference from the placebo in method A but huge interference was encounte-red in method B. The interference from placebo mixture in method B was successfully overcome by extraction of SMT into chloroform and by performing the analysis as described under tablets.
Application to analysis of pharmaceutical formulations
Method A does not suffer from interference from the tablet excipients and results in Table III show close agreement between the results obtained by the proposed methods and the label claim. Method B entails extraction of SMT into chloroform since there was some interference from the excipients when applied directly to the tablet extract in NaOH. The chloroform was later evaporated and residue was dissolved in NaOH where an appropriate working concentration of SMT was prepared and analyzed as given under assay procedure for tablets. The results were compared statistically by applying Student’s t-test for accuracy and the variance ratio F-test for precision with results from the literature method (Arayne et al., 2007) at a 95% conidence level. The calculated t-test and F-values (Table III) did not exceed the tabulated values of 2.37 and 6.39, respectively, indicating no significant difference
TABLE II- Intra-day and Inter-day precision and accuracy evaluation
Method SMT
( x 10-5
mol/L) taken
Intra-day (n=7) Inter-day (n=5)
SMT
( x 10-5 mol/L)
founda
Precisionb Accuracyc SMT
( x 10-5 mol/L)
founda
Precisionb Accuracyc
A
B
2.94 2.98 1.15 1.56 2.99 1.85 1.72
8.83 8.99 1.82 0.97 8.96 1.51 1.34
14.72 14.95 1.57 0.58 15.00 1.95 0.98
0.45 0.46 2.00 1.83 0.47 1.00 2.15
1.36 1.37 0.83 1.26 1.37 1.58 1.58
2.26 2.28 0.90 0.72 2.28 0.70 0.84
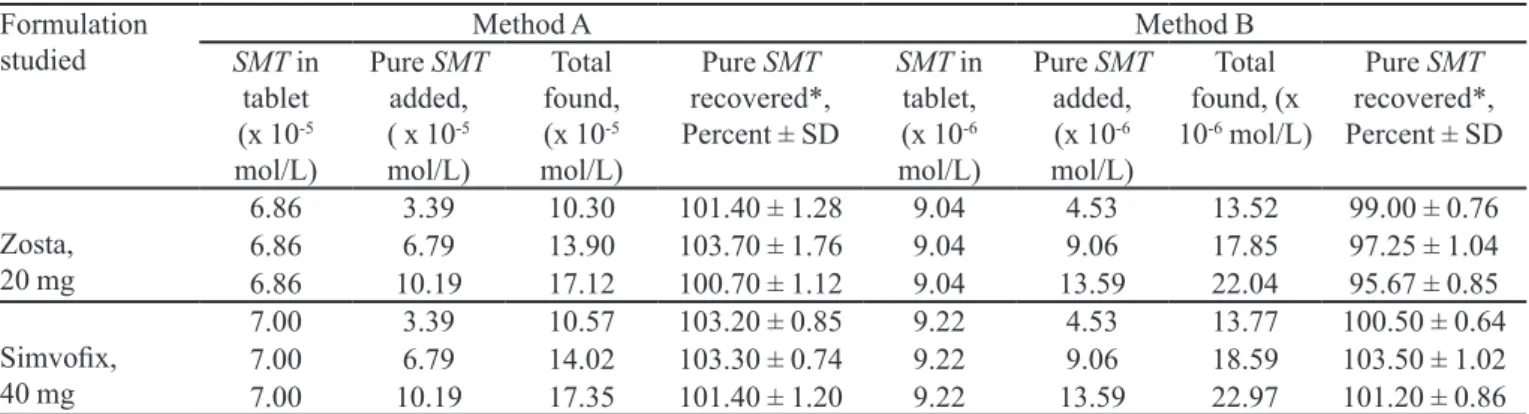
between the proposed methods and the reference method in terms of accuracy and precision. The validity of the methods was conirmed by applying the standard addition technique. Pre-analyzed tablet powder containing SMT was spiked with pure SMT at three concentration levels and the totals were found by the proposed methods. Each determination was done three times. The results of this study are compiled in Table IV.
CONCLUSIONS
Two simple, rapid, fairly accurate and precise, and sensitive spectrophotometric methods were developed for the determination of SMT in bulk drug and in tablets. The methods are free from rigid experimental conditions and are characterized by wide linear dynamic ranges and high sensitivity, and employ inexpensive and easily available
chemicals. The low detection and quantiication limits, simplicity and selectivity make the method suitable for quality control in the pharmaceutical industry for routine analysis. However, method B entails an extraction step when applied to tablets to overcome the interference from some inactive ingredients.
ACKNOWLEDGEMENT
Authors thank M/S. Jubiliant Organosis, Mysore, for providing the gift of pure simvastatin. Three of the authors (KT, NRP, KBV and SGH) thank the authorities of the University of Mysore, Mysore, for permission and facilities. Kalsang Tharpa also thanks the Department of Education, Central Tibetan Administration of His Holiness the Dalai Lama, for providing a research scholarship. TABLE IV - Results of recovery study by standard addition method
Formulation
studied SMT in Method A Method B
tablet (x 10-5
mol/L)
Pure SMT
added, ( x 10-5
mol/L)
Total found, (x 10-5
mol/L)
Pure SMT
recovered*, Percent ± SD
SMT in tablet, (x 10-6
mol/L)
Pure SMT
added, (x 10-6
mol/L)
Total found, (x 10-6 mol/L)
Pure SMT
recovered*, Percent ± SD
Zosta, 20 mg
6.86 3.39 10.30 101.40 ± 1.28 9.04 4.53 13.52 99.00 ± 0.76
6.86 6.79 13.90 103.70 ± 1.76 9.04 9.06 17.85 97.25 ± 1.04
6.86 10.19 17.12 100.70 ± 1.12 9.04 13.59 22.04 95.67 ± 0.85
Simvoix, 40 mg
7.00 3.39 10.57 103.20 ± 0.85 9.22 4.53 13.77 100.50 ± 0.64
7.00 6.79 14.02 103.30 ± 0.74 9.22 9.06 18.59 103.50 ± 1.02
7.00 10.19 17.35 101.40 ± 1.20 9.22 13.59 22.97 101.20 ± 0.86
*Mean value of three determinations
TABLE III - Results of assay of tablets and statistical evaluation
Tablet brand
name** Nominal amount mg Literature method*** Found (% of nominal amount ± SD)*Method A Method B
Simvoixa 20 99.64 ± 0.78 98.85 ± 1.26
t = 1.22 F = 2.60
100.14 ± 0.74 t = 1.04 F = 1.11
40 102.50 ± 0.62 103.10 ± 0.96
t = 1.20 F = 2.40
101.80 ± 0.36 t = 2.26 F = 2.97
Zostab 10 97.62 ± 0.86 98.74 ± 1.65
t = 1.41 F = 3.68
96.83 ± 1.11 t =1.48 F = 1.67
20 100.30 ± 0.58 101.00 ± 1.42
t = 1.10 F = 5.99
99.78 ± 1.26 t = 0.89 F = 4.72
*Mean value of ive determinations. **Marketed by: a. Bal Pharma (Servetus); b. USV (Corvette). Tabulated t-value at the 95%
REFERENCES
ALI, A.; NAMEH, E. S. M.; SHAWABKEH, R. A. High-perfromance liquid chromatographic determination of simvastatin in medical drugs. J. Anal. Chem., v.61, p.63-66, 2006.
ARAYNE, M. S.; SULTANA, N.; HUSSAIN, F.; ALI, S. A. Validated spectrophotometric method for quantitative determination of simvastatin in pharmaceutical formulations and human serum. J. Anal. Chem., v.62, p.536-541, 2007.
CHANDHARI, B.G.; PATEL, N. M.; SHAH, P. B. Determination of simvastatin, pravastatin sodium and rosuvastatin calcium in tablet dosage forms by HPTLC. Indian J. Pharm. Sci.,
v.69, p.130-132, 2007.
CAROLINA, G.; GLORIA, G. C.; MARTA, D. D.; RICARDO, G. Liquid chromatography for fast determination of simvastatin in drug substance. J.Chilean Chem. Soc., v.49, p.289-290, 2004.
CARLCUCCI, G.; MAZZEO, P., Determination of simvastatin in pharmaceutical forms by HPLC and derivative UV-spectrophotometry. Farmaco, v.47, p.817-823, 1992.
CORUH, O.; OZKAN, S. A. Determination of the antiperlipidemic simvastatin by various voltammetric techniques in tablets.
Die Pharmazie, v.61, p.285-290, 2006.
ERK, N. Rapid spectrophotometric method for quantitative determination of simvastatin and fluvastatin in human serum and pharmaceutical formulations. Pharmazie, v.57, p.817-819, 2002.
INTERNATIONAL CONFERENCE ON HARMONISATION. ICH Technical requirements for registration of pharmaceuticals for human use. Harmonised Tripartite Guideline. Validation of analytical procedures: text and methodology Q2(R1). Complementary Guideline on Methodology. Washington, DC, 1996. 13 p.
JIANWEI, X.; YING, L. HPLC determination of simvastatin and its related substances. Yaowu Fenxi Zazhi, v.25, p.523-525, 2005.
MANN, F. G.; SOUNDERS, B. C. Practical organic chemistry. 4.ed. Cambridge: Longman, 1974. p.85.
MC EVOY, G. K. HFS Drug information. Bethesda, MD: American Society of Health System Pharmacists, 2002. p.779-782.
THE UNITED STATE PHARMACOPOEIA. National Formulary 20. Rockville, MD: United States Pharmocopocial Convention Inc., 2002, p.9571-9572.
SHABIR, G.A. Validation of high-performance liquid chromatography methods for pharmaceutical analysis: understanding the differences and similarities between validation requirements of the US Food and Drug Administration, the US Pharmacopeia and the International conference on Harmonization. J. Chromatogr. A., v.987, p.57-66, 2003.
SRINIVASU, M. K.; RAJU, A. N.; REDDY, G. O. Determination of lovastatin and simvastatin in pharmaceutical dosage forms by MEKC. J. Pharm. Biomed. Anal., v.29, p.715-721, 2002.
SARADHI, S. V.; HIMABINDU, V.; RAO, G. V. Spectrophotometric methods for the determination of simvastatin. Acta Cienc. Indica, v.33, p.205-208, 2007.
WANG, L.; ASGHARNEJAD, M. Second-derivative UV spectrometric determination of simvastatin in its tablet dosage form. J. Pharm. Biomed. Anal., v.21, p.1243-1248, 2000.
WANG, J. HPLC determination of simvastatin in tablets.
Zhongguo Yiyao Gongye ZaZhi, v.31, p.121-122, 2000; Sci Finder, CAN 132:284323; AN 2000:293986.
XAN, X.; CAO, G.; HE, X.; HU, X.; GU, D. Determination of simvastatin by HPLC. Huaxi Yaoxue Zazhi, v.15, p.205-206, 2000.
XU, L., Determination of simvastatin in tablets by UV spectrophotometry. Thongguo Yiyao Gongye Zazhi, v.32, p.271-272, 2001; Sci. Finder CAN 135:362691;AN 2001: 606960.
YAN, X.; CAO, G.; HE, X.; HU, X.; GU, D.; Determination of simvastatin by HPLC. Huaxi Yaoxue Zazhi, v.15, p.205-206, 2000
ZHONGHONG, L.; SHURONG, T. Quantification determination of simvastatin in capsules by irst derivative spectrophotometry. Zhongguo Yaoxue Zazhi (Beijing), v.35, p.554-556, 2000.
Received for publication on 31st July 2008