YEAR STUDENTS
Robert Podstawski1, Danuta Zwolińska2, Renata Urbańska-Gizińska3, Danuta Nowosielska-Swadźba2 Department of Physical Education and Sport, University of Warmia & Mazury in Olsztyn1
State Higher Vocational School in Racibórz, The Institute of Physical Culture2
Faculty of Technical Sciences, Chair of Machines and Separation Processes, University of Warmia & Mazury in Olsztyn3
Annotation. The purpose of the study conducted among students of UWM in Olsztyn was to diagnose the level of biological development of first year students aged 19-20 years, depending on the location and type of secondary school attended. The research on the level of physical and motor development was carried out in 2012 during the compulsory physical education classes of 361 full-time students randomly selected with the use of statistical tables out of 250 student groups. In order to determine the level of physical development, basic anthropometric parameters of the subjects weremeasured such as body weight and height, and 13 motor tests were used to determine the motor level. The results showed that factors such as the location and type of secondary school attended did not differentiate significantly the level of physical and motor development of first-year students, and the occurring differences were rather incidental and accidental. The weak interaction of factors used was probably the result of blurring the differences and barriers between schools operating in rural areas and in urban areas, a similar curriculum, and an 8-month stay of the subjects at university.
Key words: students, physical development, motor development, motor skills, location, secondary school Introduction1
Motor fitness is one of the main indicators of human development and, therefore, it occupies an important place in the science of physical education as the subject of numerous research papers. The importance of the research on the level of motor skills has been becoming particularly important in the last two decades, due to a decrease in the presence of heavier physical activities at occupational work and other activities of life, which in turn leads to a specific impairment of biological properties in man, the reduction of his ability to adapt, and even contributes to a number of so-called civilization diseases (Starosta, 2010). Unfortunately, this phenomenon also applies to students in higher education (Bertsias et al., 2005; Sidnik et al., 2009, Gómez-López et al., 2011).
Attention should be paid to the importance and role of intellectuals in promoting physical culture and shaping the right attitudes of an individual and society toward the requirements concerning the care for physical health, which is of great importance for the development of the country (Podstawski, 2006). Higher education provides a certain, usually very high prestige in the immediate environment resulting from the fact that the executive, political and administrative personnel of the country usually derives from the ranks of the intellectuals.
Among other things, for this reason the study of the motor fitness level included also the students of the universities operating in Poland (Szopa et al., 1998;Lisicki, 2006; Podstawski, 2006; Umiastowska, 2007) and in other countries, such as for example: Russia (Negasheva & Mishkova, 2005) Slovakia (Cuberek & Machova 2009), and Japan (Tamotsu et al., 1989). In the group of studies on motor skills of students there is much less cross-sectional research, conducted regularly in a certain period of time (e.g. a decade) (Cleassens & Lefevre, 1992; Pilicz, 2000), and the research that considerates the level of motor skills depending on the selected socio-economic factors (Podstawski, 2009a, 2009b, 2010; Gill et al., 2010; Podstawski et al., 2013). The level of motor fitness is largely determined by the physical activity of man (Ford et al., 1991), but the developmental processes depend on the properties of the organism and the surrounding environment (Wolański, 2005). The response of the organism to environmental factors depends on the type of a factor, its intensity, duration and resistance of a system and its various structures (Eiben, 1998). When assessing the impact of environmental factors on the level of biological development (including motor development) of students, it should be noted that individuals coming from privileged or intellectual backgrounds are more favorable in this respect compared to children from the intermediate layers (trade, commerce), especially layers of workers and peasants (Tatarczuk, 2006; Jopkiewicz & Suliga, 2008).
Among the factors that play an important role in human development, scientists mention the social and living conditions (Tanner, 1986), among which urbanization is a very important factor. In the physical development, the dependence from the place of living, i.e. urban environment, a small town or a rural environment, is clearly visible (Kolmos, 1994). Accelerated growth and faster maturation of children in urban environment is usually due to better health and living conditions, such as nutrition, hygiene, medical care (Eiben & Mascie-Taylor, 2004). The amount of income attributable to one person in a family highly determines the fulfillment of basic needs of every man (Powell et al., 2006). Children coming from advantaged backgrounds and from homes where parents have higher education, have accelerated biological development in relation to children from less educated strata and with lower income (Vandendriessche et al., 2012). Also, higher education of parents clearly coincides with higher level of motor fitness in children from families of intellectuals (McVeigh et al., 2004). Much less research is devoted to the relationships
PHYSICAL EDUCATION OF STUDENTS
between factors related more to the educational environment like the location and type of secondary school attended, and the level of motor skills in students entering university. It is believed that the learning environment of young people who undertake studies differentiates the level of their biological development. The research presented repeatedly in the scientific literature leads to such a hypothesis, providing that the conditions for teaching physical education in schools located in smaller towns are much worse because of the bad economic situation, as well as less qualified teachers implementing physical education curriculum (Jaworski, 1994; Podstawski, 2006).
The purpose of the study conducted among students of UWM in Olsztyn was to diagnose the level of physical and motor development in first year students aged 19-20 years. The level of physical and motor development was determined on the basis of the following environmental factors: the location and type of secondary school attended.
Materials and Methods
Ethics
The research was conducted with prior consent from the Ethical Committee of UWM, on student volunteers who agreed to take part in the study, which they confirmed by signing a written statement.
Participants
The study on the level of physical and motor development was carried out at the end of the summer semester 2012 at the mandatory physical education among first year students studying at the University of Warmia & Mazury in Olsztyn (UWM). It included 361 full-time students randomly selected with the use of statistical tables (Zieliński & Zieliński, 2001) from 250 student groups. As a result, the study involved 19-20-year-old (mean 19.7 years) students from 26 randomly selected groups, representing more than 96% of all students enrolled in these groups. Only those students, who were not present in physical education classes during the study, were excluded from the experiment. The exact characteristic of the study group is presented in Table 1.
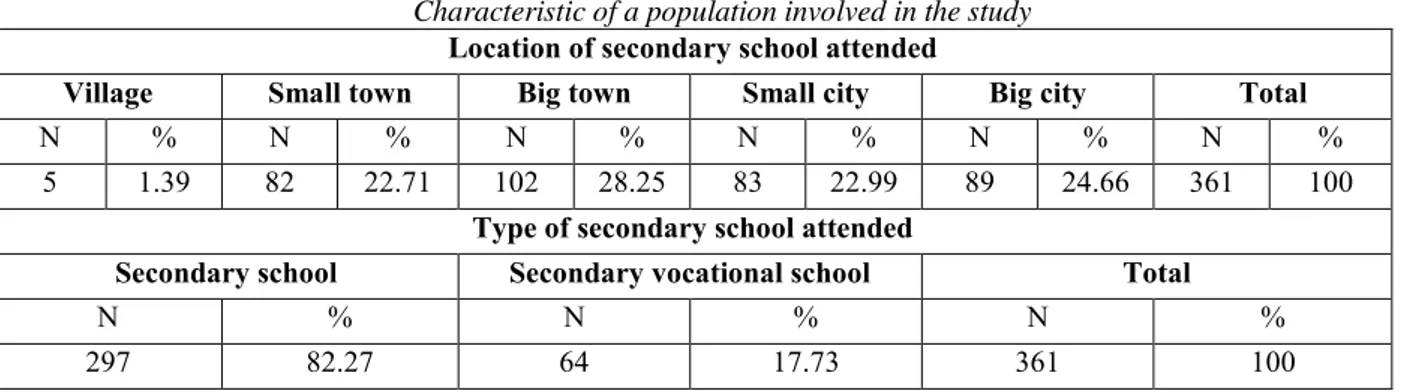
Table 1
Characteristic of a population involved in the study
Location of secondary school attended
Village Small town Big town Small city Big city Total
N % N % N % N % N % N %
5 1.39 82 22.71 102 28.25 83 22.99 89 24.66 361 100
Type of secondary school attended
Secondary school Secondary vocational school Total
N % N % N %
297 82.27 64 17.73 361 100
Explanations: N – number of responses, % - percentage share
The results presented in Table 1 indicate that most students have graduated from a secondary school in big cities (20,000-50,000 population - 28.25%). Slightly fewer attended a secondary school located in a big city (24.66%), a small city (22.99%), and a small town (22.71%). Due to the very small number of secondary schools in rural areas, the percentage of graduates from these areas was negligible (1.39%). The vast majority of first year students were secondary school graduates (82.27%), while just under one-fifth (17.73%) were graduates of secondary vocational schools. It should also be noted that the vast majority of the subjects were men living in the areas of Warmia & Mazury, coming mostly from rural areas, small towns (up to 40,000 inhabitants). The first year students were deliberately chosen for this type of research because they are a group of people who can still shape the habits of an active lifestyle. In addition, the study conducted in 2012 was a continuation of the observation on changes in the level of physical development and motor fitness in first year students, that had been carried out periodically, every two years since 2000 (Podstawski, 2006, 2013). In order to facilitate the data presented in the tables, the size of the places has been divided into the following categories: village, small town (<20,000 inhabitants), big town (20,000-50,000 inhabitants), small city (50,000-100,000 inhabitants), and big city (>100,000 inhabitants).
Tools and procedures
In order to investigate the relationships between the physical and motor level and selected environmental factors (the location and type of secondary school), the study results were analyzed using the method of analysis of variance at a significance level α = 0.05. Average object-oriented environmental factor was compared with the use of Duncan’s test (union groups). To verify the statistical hypotheses, the modulus of descriptive statistics was used, the results were summarized in the tables containing the average, standard deviation, the min. and max. values, and information about the significant differences occurring in the given motor test, depending on the specific environmental factor. Statistical calculations were performed and the results analyzed using the Statistica PL v. 10 software package (Stanisz, 2010).
Results
Table 2 presents the basic anthropometric parameters (height and weight) and the BMI calculated on the basis of them, depending on the location and type of secondary school. The Tables 3-4 show the results on the relationships between these factors and the level of specific motor skills.
Table 2
Anthropometric parameters in students depending on the location and type of secondary school attended
Location of secondary school attended
X
± S (min - max)Parameters Village Small town Big town Small city Big city p
Body height [cm] 178.40±9.762 (164-188)
178.78±7.23 7 (164-200)
179.75±6.50 8 (164-202)
179.02±5.68 7 (165-191)
180.31±6.95 9
(165-203) p=0.5619
Body mass [kg] 75.00±9.592 (65-90) 74.93±9.601 (58-100) 75.52±10.373 (55-110)
74.71±8.514
(58-98) 74.78±9.454 (60-105) p=0.9939
BMI [kg/m2] 23.69±3.664 (20.02-29.0)
23.44±2.703
(18.94-31.02)
23.38±2.996
(18.17-34.72)
23.32±2.498
(18.02-29.05)
22.97±2.289
(18.94-30.42) p=0.7739
Type of secondary school attended
X
± S (min - max)Parameters Comprehensive secondary school (1) Śecondary vocational school (2) p
Body height [cm] 179.37±6.637 (164-203) 179.98±6.772 (164-196) p=0.5063
Body mass [kg] 75.11±9.311 (55-105) 74.55±10.444 (58-110) p=0.6683
BMI [kg/m2] 23.33±2.510 (18.02-31.71) 23.04±3.256 (18.59 -34.72) p=0.4262 Notice: If p < = 0.05 – statistically significant differences
Explanations:
X
– arithmetic mean, S – standard deviation., min – minimum value, max – maximum value, p – probability of exceeding the calculated value of chi-square statisticsThe results presented in Table 2 show that the tested anthropometric parameters such as body weight and height, and the body mass index calculated on the basis of these, are not significantly different under the influenceof the location and type of secondary school attended. In all test categories, according to the above factors, BMI was within normal range (Table 2).
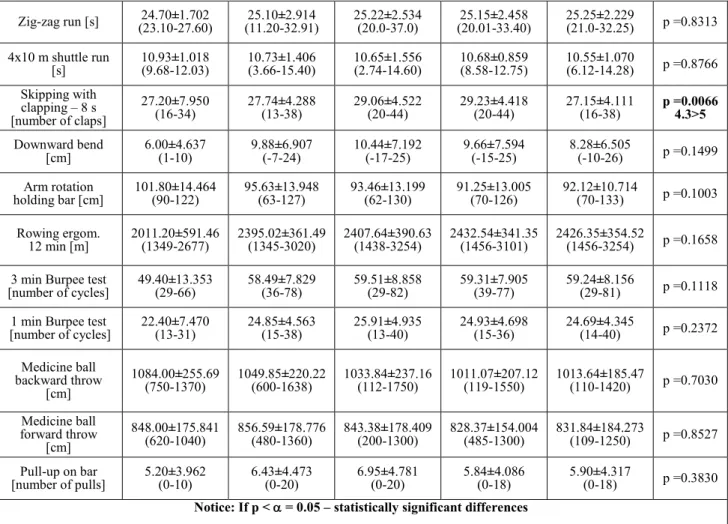
In Table 3, it was observed that in most cases there was no relationship between the location of secondary school attended and the results obtained by students in the applied motor tests. Only in the case of a skipping test with hand clapping - 8 s it was found that students who graduated from a secondary school in big towns and small cities scored significantly better results (more claps under the knees) than those who graduated from secondary schools in big cities (Table 3). The type of secondary school attended did not differentiate the level of motor skills in students in any motor test (Table 4).
Table 3
The level of motor skills in students depending on the place of secondary school attended
Motor test Place of secondary school attended
X
± S (min - max) p Village1 Small Town 2 Big Town 3 Small city 4 Big city 5 Standing long jump
[cm] 217.80±49.565 (165-280) 214.21±23.301 (146-273) 219.05±24.408 (147-275) 213.05±22.252 (168-262) 217.76±22.699 (174-270) p =0.4168
Sit-ups - 30 s
PHYSICAL EDUCATION OF STUDENTS
Zig-zag run [s] (23.10-27.60) 24.70±1.702 (11.20-32.91) 25.10±2.914 25.22±2.534 (20.0-37.0) (20.01-33.40) 25.15±2.458 25.25±2.229 (21.0-32.25) p =0.8313
4x10 m shuttle run
[s] 10.93±1.018 (9.68-12.03) 10.73±1.406 (3.66-15.40) 10.65±1.556 (2.74-14.60) 10.68±0.859 (8.58-12.75) 10.55±1.070 (6.12-14.28) p =0.8766 Skipping with
clapping – 8 s [number of claps]
27.20±7.950
(16-34) 27.74±4.288 (13-38) 29.06±4.522 (20-44) 29.23±4.418 (20-44) 27.15±4.111 (16-38) p =0.0066 4.3>5
Downward bend
[cm] 6.00±4.637 (1-10) 9.88±6.907 (-7-24) 10.44±7.192 (-17-25) 9.66±7.594 (-15-25) 8.28±6.505 (-10-26) p =0.1499
Arm rotation
holding bar [cm] 101.80±14.464 (90-122) 95.63±13.948 (63-127) 93.46±13.199 (62-130) 91.25±13.005 (70-126) 92.12±10.714 (70-133) p =0.1003
Rowing ergom.
12 min [m] 2011.20±591.46 (1349-2677) 2395.02±361.49 (1345-3020) 2407.64±390.63 (1438-3254) 2432.54±341.35 (1456-3101) 2426.35±354.52 (1456-3254) p =0.1658
3 min Burpee test
[number of cycles] 49.40±13.353 (29-66) 58.49±7.829 (36-78) 59.51±8.858 (29-82) 59.31±7.905 (39-77) 59.24±8.156 (29-81) p =0.1118
1 min Burpee test
[number of cycles] 22.40±7.470 (13-31) 24.85±4.563 (15-38) 25.91±4.935 (13-40) 24.93±4.698 (15-36) 24.69±4.345 (14-40) p =0.2372
Medicine ball backward throw
[cm]
1084.00±255.69
(750-1370) 1049.85±220.22 (600-1638) 1033.84±237.16 (112-1750) 1011.07±207.12 (119-1550) 1013.64±185.47 (110-1420) p =0.7030
Medicine ball forward throw
[cm]
848.00±175.841
(620-1040) 856.59±178.776 (480-1360) 843.38±178.409 (200-1300) 828.37±154.004 (485-1300) 831.84±184.273 (109-1250) p =0.8527
Pull-up on bar
[number of pulls] 5.20±3.962 (0-10) 6.43±4.473 (0-20) 6.95±4.781 (0-20) 5.84±4.086 (0-18) 5.90±4.317 (0-18) p =0.3830
Notice: If p < = 0.05 – statistically significant differences
Explanations:
X
– arithmetic mean, S – standard deviation, min – minimum value, max – maximum value, p – probability of exceeding the calculated value of chi-square statisticsTable 4
The level of motor skills in students depending on the type of secondary school attended
Motor test Type of secondary school attended
X
± S (min - max) p High school Vocational schoolStanding long jump [cm] 215.29±23.186 (146-275) 220.63±25.666 (165-280) p =0.1024
Sit-ups - 30 s [number of sits] 23.95±4.282 (10-35) 24.48±3.871 (14-32) p =0.3605
Zig-zag run [s] 25.32±2.589 (11.2-37) 24.53±2.044 (20.01-30.4) p =0.0710
4x10m shuttle run [s] 10.63±1.284 (2.74-14.6) 10.75±1.152 (9.03-15.4) p =0.4942
Skipping with clapping– 8 s 28.10±4.369 (13-44) 29.23±4.810 (16-38) p =0.0654
Downward bend [cm] 9.36±6.699 (-17-25) 10.38±7.506 (-15-26) p =0.2702
Arm rotation holding bar [cm] 92.65±12.576 (62-127) 95.92±13.841 (70-133) p =0.0648
Rowing ergometer
12 min [m] 2400.94±361.356 (1345-3254) 2449.91±400.667 (1349-3254) p =0.3357
3 min Burpee test
[number of cycles] 58.83±7.991 (29-81) 59.92±9.869 (29-82) p =0.3442
1 min Burpee test
[cm] (110-1750) (119-1470) Medicine ball forward throw
[cm] 837.32±173.811 (109-1360) 853.28±175.746 (310-1300) p =0.5064
Pull-up bar
[number of pulls] 6.24±4.433 (0-20) 6.56±4.475 (0-20) p =0.5955
Notice: If p < = 0.05 – statistically significant differences
Explanations:
X
– arithmetic mean, S – standard deviation, min – minimum value, max – maximum value, p – probability of exceeding the calculated value of chi-square statisticsDiscussion
The research has shown that the learning environment factors, such as the location and type of secondary school attended, had no significant effect on the level of biological development of first year students. The students did not differ significantly in terms of physical development that is basic anthropometric parameters such as body weight and height. Also, their nutritional status as BMI did not differ significantly in particular categories. The phenomenon of the lack of relationship between the physical development, nutritional status (BMI), and motor development of first year students, and their learning environment, does not coincide with the general trend prevailing in the world. Overall results of the research carried out in different parts of the world and documented with 150 publications (in the period of 1980-2004), has shown that the policy of the school environment in terms of promotingphysical activity is essential to improve the physical fitness of children and young people (Ferreira et al., 2006). These indicate that the type of completed school, namely secondary vc. vocational school, was positively associated, whereas the provision of instruction on PA or sport-related health benefits and special PE programs and/or school sports, were not related to adolescents’ PA. Similar results were also obtained by Sallis et al. (2000), while collecting data from 108 published studies (between 1970-1998), mainly from Europe.
The studies on the nutritional status of the students starting their studies at UWM, carried out periodically, every two years since 2000, also showed no significant differences in BMI in the years 2000, 2002, 2004 and 2006, depending on the location and type of secondary school attended (Podstawski, 2011). A similar phenomenon was observed when determining the level of motor development of the research subjects in 2012. In 13 motor tests applied, there was a lack of significant differences in the level of certain motor skills, taking into account the location and type of secondary school attended. It is, therefore, believed that the significant differences that occurred in the skipping with hand clapping - 8 s trial were random.
The first study on the level of motor fitness in UWM students were conducted in 2000 and it showed that the location of secondary school attended did not differentiate the level of motor skills of men in any of the motor tests applied. In contrast, the type of secondary school attended differentiated the results in the following tests: the downward bend from standing position and 1 minute Burpee tests in favour of the graduates of secondary vocational schools (Podstawski, 2006). The study conducted in 2002 showed that the location of secondary school attended significantly affected the level of motor skills in tests such as: the 4x10 m shuttle run, medicine ball (4 kg) backward throw, and pull-up bar trials, while no relationships between the type of secondary school and the level of motor skills were found in any skill test (Podstawski & Denaburski, 2005). The factors applied by us differentiated the motor skills in men in the study from 2004: the size of the location of secondary school attended – standing long jump, sit-ups 30 s, 4x10 m shuttle run, skipping with hand clapping – 8 s, and pull-up bar trials; the type of secondary school attended - 4x10 m shuttle run, and pull-up bar trials (Podstawski, 2008).
The size of location of secondary school attended significantly differentiated the level of speed capabilities of UWM students (academic year 2005/2006) in trials such as: the standing long jump (in favour of graduates of secondary schools located in bigger cities), and the skipping with hand clapping – 8 s (in favour of graduates of secondary schools located in villages). In these studies, the type of secondary school did not differentiate the speed capabilities of the research subjects (Podstawski, 2009a). The studies on endurance capacity showed no significant differences with the same environmental factors applied, in the trials such as: 1 min Burpee test, and 500 m rowing ergometer (Podstawski, 2009b). The research conducted in 2006 showed that the level of suppleness in students in the sit and reach trial was significantly better in graduates of secondary vocational schools than those of secondary schools, and the location of secondary school attended did not diversify significantly the abilities of suppleness in tests such as: the downward bend from standing position, and the sit and reach trials (Podstawski, 2009c). No significant differences for factors such as the location and type of secondary school attended were also observed in the strength tests: the medicine ball (4kg) backward throw, medicine ball (4 kg) forward throw, and pull-up bar trials (Podstawski, 2009d).
PHYSICAL EDUCATION OF STUDENTS
Conclusions
The research has shown that the factors such as the location and type of secondary school attended differentiated the level of physical and motor development of first year students to a small degree. The weak interaction of factors applied is probably the result of blurring the differences and barriers between secondary schools operating in rural areas and in urban areas. Secondary schools in Warmia & Mazury region are characterized by a similar curriculum, regardless of whether they operate in the country or in the city. An 8-month stay of first year students at university could also be a factor blurring the diversity of the results.
References
1. Bertsias G., Linardakis, M., Mammas I., & Kafatos A. Fruit and vegetables consumption in relation to health and diet of medical students in Crete, Greece. International Journal for Vitamin and Nutrition Research, 2005, vol.75,
pp. 107-117.
2. Cleassens A.L., & Lefevre J. Secular trends in somatic and motor characteristics of physical education students.
American Journal of Human Biology, 1992, vol.4(3), pp. 301-311.
3. Cuberek R., & Machova I. The motor performance progression of future undergraduate students of physical education. Acta Universitatis Polackianae Olomucensis Gymnica, 2009, vol.39, pp. 15-24.
4. Eiben O.G., Mascie-Taylor C.D.N. Children’s growth and socio-economic status in Hungary. Economic and Human
Biology 2004, vol.2, pp. 295-320.
5. Eiben O.G. Growth and maturation problems of children and social inequality during economic liberalization in Central and Eastern Europe. In SS Strickland & P Shetty, editors. Human Biology and Social Inequality.
Cambridge: Cambridge University Press. 1998, pp. 76-95.
6. Ferreira I., van der Horst K., Wendel-Vos W., Kremers S., van Lenthe F. J., & Brug J. Environmental correlates of physical activity in youth – a review and update. Obesity Reviews, 2006, vol.8, pp. 129-154.
7. Ford E.S., Merritt R.K., Heath G.W., Powell K.E., Vashburn R.A., Kriska A., Haile G. Physical Activity Behaviors in Lower and Higher Socioeconomic Status Populations. American Journal of Epidemiology. 1991, vol.133(12), pp.
1246-1256.
8. Gill M., Deol N. S., & Kaur R. Comparative Study of Physical fitness components of Rural and Urban Female Students of Punjabi University, Patala. Anthropologist. 2010, vol.12(1), pp. 17-21.
9. Gómez-López M., Granero-Gallegos A., Baena-Extremera A., & Ruiz-Juan F. The abandonment of an active lifestyle within university students: Reasons for abandonment and expectations of re-engagement. Psychologica
Belgica, 2011, vol.51(2), pp. 155-175.
10.Jaworski Z. Jobs in education for masters in physical education [Miejsca pracy w szkolnictwie dla magistrów wychowania fizycznego]. Physical Culture [Kultura Fizyczna], 1994, vol.7-8, pp. 10-12.
11.Jopkiewicz A., Suliga E. Biomedical foundations of development and education [Biomedyczne podstawy rozwoju i
wychowania]. Radom-Kielce, WNITE-PIB Press. 2008, 200 p.
12.Komlos J. Preface in Komlos, editors. Stature, Living standards, and Economic Development. Essays in
anthropometric history. Chicago & London: The University of Chicago Press. 1994, pp. 9-11.
13.Lisicki T. Students of the first year studying of medical schools to the requirements of a healthy lifestyle [Studenci I
roku akademii medycznych wobec wymogów zdrowego stylu życia]. Gdańsk, AWFiS Press. 2006, 160 p.
14.McVeigh J.A., Norris S.A., & Wet T. The relationship between socio-economic status and physical activity patterns in South African children. Acta Pediatrica. 2004, vol.93(7), pp. 982-988.
15.Negasheva M. A., & Mishkova T. A. Morphofunctional Parameters and Adaptation Capabilities of Students at the Beginning of the Third Millennium. Journal of Physiological Anthropology and Applied Human Science. 2005,
vol.24(4), pp. 397-402.
16.Pilicz S. Trends in physical development and physical fitness of female students and students of Warsaw University
of Technology [Kierunki zmian w rozwoju fizycznym i sprawności fizycznej studentek i studentów Politechniki
Warszawskiej]. Warsaw, Warsaw University of Technology Press. 2000, pp. 67-72.
17.Podstawski R., & Denaburski J. Physical training of first year students at the University of Warmia and Mazury in
Olsztyn, in the academic year 2001/2002 [Sprawność fizyczna studentów I roku Uniwersytetu
Warmińsko-Mazurskiego w Olsztynie w roku akademickim 2001/2002]. Gdańsk, AWFiS Press. 2005, pp. 439-446.
18.Podstawski R. Physical ability and opinions on health prevention among the 1st year students of the University of
Warmia and Mazury in Olsztyn in academic year 1999/2000. Olsztyn, UWM Press. 2006, 120 p.
19.Podstawski R. Physical ability of the first year students of the University of Warmia and Mazury in Olsztyn in 2003/2004. Physical activity of people of all ages [Aktywność Ruchowa Ludzi w Różnym Wieku]. 2008, vol.12, pp.
208-215.
20.Podstawski R. The level of ability speed events year students of the university studio Warmia and Mazury in Olsztyn,
in relation to the socio-environmental [Poziom zdolności szybkościowych studentów I roku studio uniwersytetu
warmińsko-Mazurskiego w Olsztynie w odniesieniu do warunków społeczno-środowiskowych]. Bydgoszcz, WSGwB Press. 2009, pp. 471-476.
21.Podstawski R. The level of endurance capacity of students of the University of Warmia and Mazury in Olsztyn, in
relation to the socio-environmental [Poziom zdolności wytrzymałościowych studentów Uniwersytetu
warmińsko-Mazurskiego w Olsztynie w odniesieniu do warunków społeczno-środowiskowych]. Bydgoszcz, WSGwB Press. 2009, pp. 429-438.
22.Podstawski R. The level of flexibility of the first year students of University of Warmia and Mazury in Olsztyn in 2005/2006. Physical activity of people of all ages [Aktywność Ruchowa Ludzi w Różnym Wieku]. 2009, vol.13, pp.
422-432.
23.Podstawski R. The level of strength abilities of the first year students of the university of Warmia and Mazury in Olsztyn in 2005/2006. Physical activity of people of all ages [Aktywność Ruchowa Ludzi w Różnym Wieku]. 2009,
vol.13, pp. 434-445.
24.Podstawski R. Effect of some environmental factors on the direction of secular trends in height, weight, BMI,
SI-year students studying at the University of Warmia and Mazury in Olsztyn in 2000-2006. [Wpływ wybranych
25.Podstawski R. Secular trends in anaerobic fitness tests performance of physically inactive young males (2000-2006).
Journal of Physical Education and Sport, 2013, vol.13(1), pp. 73-77.
26.Podstawski R., Borysławski K., & Choszcz D. Secular trends observed in anaerobic performance of students accounting for the place of permanent residence. Research in Kinesiology. 2013, vol.41(1), pp. 4-11.
27.Podstawski R., Siemianowska E., & Skibniewska K. A. Characteristics of changes in speed abilities of the first year female students of Warmia and Mazury University in Olsztyn (2000-2006). Physical activity of people of all ages
[Aktywność Ruchowa Ludzi w Różnym Wieku]. 2010, vol.14, pp. 159-170.
28.Powell L. M., Slater S., Chaloupka F. J., & Harper D. Availability of Physical Activity – Related Facilities and Neighborhood Demographic and Socioeconomic Characteristics: A National Study. American Journal of Public
Health. 2006, vol. 96(9), pp. 1676-1680.
29.Sallis J. F., Prochaska J. J., & Taylor W. C. A review of correlates of physical activity of children and adolescents.
Medicine and Science in Sports and Exercise. 2000, vol.32(5), pp. 963-975.
30.Sidnik J., Andrijašević M., & Ćurković S. Relation of students’ attitude toward leisure time activities and their preferences toward sport recreational activities. Acta Cinesiologica. 2009, vol.3(1), pp. 54-58.
31.Starosta W. How one should understand the biological minimum of daily movement activity and how important it is for the human health? Physical activity of people of all ages [Aktywność Ruchowa Ludzi w Różnym Wieku].2010,
vol.14, pp. 49-65.
32.Szopa J., Chwała W. & Ruchlewicz T. Investigations on Structure of „Energetic” Motor Abilities and Validity of their Testing. Antropomotoryka. 1998, vol.17, pp. 3-41.
33.Tamotsu Y., Yoshihide T., Minoru I. Secular trends in physique and physical fitness in Japanese students during the last 20 years. American Journal of Human Biology. 1989, vol.1, pp. 581-587.
34.Tanner J. M. Growth as a mirror of the society: secular trend and class distinction. In A. Demirjian and M Brault Dubuc, editors. Human growth: A multidisciplinary review. London & Philadelphia: Taylor and Francis. 1986, pp.
3-34.
35.Tatarczuk J. Biosocial determinants of somatic development and motor ability of selected groups of students
[Biospołeczne uwarunkowania rozwoju somatycznego i sprawność motoryczna wybranych grup młodzieży akademickiej. Zielona Gora, Zielona Gora University Press. 2006, 120 p.
36.Umiastowska D. Change of model of physical education at universities in the light of researches on participation in
physical education of students from Szczecin. Szczecin, University of Szczecin Press. 2007, 200 p.
37.Vandendriessche J.B., Vandorpe B.F., Vaeyens R., Malina R.M., Lefevre J., Lenoir M., & Philippaerts R.M. Variation in sport participation, fitness and motor coordination with socioeconomic status among Flemish children.
Pediatric Exercise Science, 2012, vol.24(1), pp. 113-128.
38.Wolański N. Development of Human Biology. Basics auxology, Gerontology and Health Promotion. [Rozwój
Biologiczny Człowieka. Podstawy Auksologii, Gerontologii i Promocji Zdrowia]. Warszaw, PWN Press. 2005. 212 p.
39.Zieliński R., & Zieliński W. Statistical tables [Tablice statystyczne]. Warsaw, Foundation for Development of