BGD
12, 18723–18768, 2015
Methods comparison to retrieve the refractive index of
small scatterers
A.-M. Sánchez and J. Piera
Title Page
Abstract Introduction
Conclusions References
Tables Figures
◭ ◮
◭ ◮
Back Close
Full Screen / Esc
Printer-friendly Version
Interactive Discussion
Discussion
P
a
per
|
Discussion
P
a
per
|
Discussion
P
a
per
|
Discussion
P
a
per
|
Biogeosciences Discuss., 12, 18723–18768, 2015 www.biogeosciences-discuss.net/12/18723/2015/ doi:10.5194/bgd-12-18723-2015
© Author(s) 2015. CC Attribution 3.0 License.
This discussion paper is/has been under review for the journal Biogeosciences (BG). Please refer to the corresponding final paper in BG if available.
Methods comparison to retrieve the
refractive index of small scatterers
A.-M. Sánchez and J. Piera
Institute of Marine Sciences (ICM-CSIC), Physical and Technological Oceanography Department, Pg. Marítim de la Barceloneta, 37–49, 08003, Barcelona, Spain
Received: 9 October 2015 – Accepted: 30 October 2015 – Published: 24 November 2015
Correspondence to: A.-M. Sánchez ([email protected])
BGD
12, 18723–18768, 2015
Methods comparison to retrieve the refractive index of
small scatterers
A.-M. Sánchez and J. Piera
Title Page
Abstract Introduction
Conclusions References
Tables Figures
◭ ◮
◭ ◮
Back Close
Full Screen / Esc
Printer-friendly Version
Interactive Discussion
Discussion
P
a
per
|
Discussion
P
a
per
|
Discussion
P
a
per
|
Discussion
P
a
per
|
Abstract
Simulation tools to generate the inherent optical properties of small scatterers are use-ful to complement data difficult to measure, as for instance their angular scattering fea-tures. However, in most cases, shapes are reduced to homogeneous spheres, which is a gross simplification for any particles in water, and the inner complex refractive index
5
is estimated using some approximations. In this paper, several methods for the retrieval of the refractive indices are used in three different examples modelling different shapes and particle size distributions. The error associated with each method is discussed and analysed. It is finally demonstrated that those inverse methods using a genetic algorithm provide optimal estimations relative to other techniques that, although faster,
10
are less accurate. The obtained results suggest that phytoplankton models can be im-proved using this kind of algorithms and a suitable shape.
1 Introduction
The discrimination of water composition in marine environments is essential to under-stand the complex aquatic ecosystems, to early detect or predict harmful algal blooms
15
(HABs), or to preserve and sustainably manage the marine resources. Water contents may include organic matter, such as phytoplankton, and inorganic matter, such as min-erals or microplastics (Andrady, 2011; Cole et al., 2011). Since the component distri-bution strongly influences the propagation of light, the water content may be estimated from remote along with in situ light-propagation measurements if the inherent optical
20
properties (IOPs) of each particle are well known, i.e., their absorption and scattering properties. However, actual instrumentation cannot provide an accurate characteriza-tion of a complete IOP (all angular scattering values are methodologically difficult to obtain), and therefore, particle modelling techniques become fundamental to comple-ment the measured data.
BGD
12, 18723–18768, 2015
Methods comparison to retrieve the refractive index of
small scatterers
A.-M. Sánchez and J. Piera
Title Page
Abstract Introduction
Conclusions References
Tables Figures
◭ ◮
◭ ◮
Back Close
Full Screen / Esc
Printer-friendly Version
Interactive Discussion
Discussion
P
a
per
|
Discussion
P
a
per
|
Discussion
P
a
per
|
Discussion
P
a
per
|
Lorenz–Mie andTMatrix theories have already been adopted to model living cells in water (such as phytoplankton cells, e.g. Quirantes and Bernard, 2006; Stramski et al., 2001) and suspended mineral particles (Twardowski et al., 2001). The first method is computationally faster than the latter but obtains the scattering angular distribution only from spheric shapes. However, only a minor number of phytoplankton species present
5
a spheric shape. As shown by Clavano et al. (2007), aspect ratios of phytoplankton (ratio of the principal axes of a particle) span between 0.4 and 72. The second method, though slower, can be applied to model more complex shapes such as spheroids, cylinders or Chebyshev particles, and allows characterizing water components more accurately. In both cases, the particle inner complex refractive index must be known
10
and, since ocean transmissometer measurements do not directly provide it, it must be estimated somehow (Aas, 1996).
Several inverse models to retrieve the refractive index from optical measurements can be found in the literature. For instance, a single equation based on the Lorenz– Mie theory is used by Twardowski et al. (2001), to estimate the bulk refractive index
15
of water particles. It is indeed a fast method if optical backscattering measurements are feasible. Stramski et al. (1988) presented an extension of a model from Bricaud and Morel (1986), based on the anomalous diffraction approximation (ADA), which al-lows the computation of the real and imaginary parts of the complex refractive index as separate variables using only the absorption and attenuation efficiency factors and
20
the particle size distribution (PSD). And Bernard et al. (2001) simplified this model by replacing the Lorentzian oscillators with a simple Hilbert transform. All these methods share one thing in common, they approximate the shape of the particles to homo-geneous spheres. Meyer (1979) first and Bernard et al. (2009) later suggested that two-layered spherical geometry models reproduce more accurately the measured
al-25
pro-BGD
12, 18723–18768, 2015
Methods comparison to retrieve the refractive index of
small scatterers
A.-M. Sánchez and J. Piera
Title Page
Abstract Introduction
Conclusions References
Tables Figures
◭ ◮
◭ ◮
Back Close
Full Screen / Esc
Printer-friendly Version
Interactive Discussion
Discussion
P
a
per
|
Discussion
P
a
per
|
Discussion
P
a
per
|
Discussion
P
a
per
|
cess of natural selection using inheritance, mutation, selection, and crossover between different possible solutions. Again, this method only requires the measured attenuation and scattering coefficients, and the PSD to find the complex refractive index. Although it is a slow method (in particular, for non-spherical particles), it can provide very accurate estimations.
5
In this paper, the refractive index retrieval models mentioned above are reviewed and tested with three simulated examples in order to analyse their accuracy when modelling real particles suspended in water such as phytoplankton. To this end, the simulated ex-amples are implemented using complex refractive indices and PSDs similar to those found in nature for phytoplankton species. Since phytoplankton particles exhibit a wide
10
variety of shapes, each example has been provided with a different outline, accounting for a homogeneous sphere, a coated sphere and a homogeneous cylinder. None of these idealized models is an exact representation of a real algae presenting cell walls, chloroplasts, vacuole, nucleus and other internal organelles, each with its own opti-cal properties. However, they can be considered a first approximation suitable for the
15
purposes of this paper.
In order to establish the foundations of the work presented in this paper, Sect. 2 reviews the formulation to obtain the IOPs from Lorenz–Mie andT Matrix character-izations (that perform the forward calculations) for polydispersed algal assemblages. In Sect. 3, a review of the different inverse approximations to retrieve the refractive
in-20
BGD
12, 18723–18768, 2015
Methods comparison to retrieve the refractive index of
small scatterers
A.-M. Sánchez and J. Piera
Title Page
Abstract Introduction
Conclusions References
Tables Figures
◭ ◮
◭ ◮
Back Close
Full Screen / Esc
Printer-friendly Version
Interactive Discussion
Discussion
P
a
per
|
Discussion
P
a
per
|
Discussion
P
a
per
|
Discussion
P
a
per
|
2 Model theory
2.1 Inherent optical properties
Lorenz–Mie andTMatrix theories are powerful methods to formulate an analytical so-lution to electromagnetic scattering by spherical and non-spherical particles. Both rely on the expansion of the incoming light into spherical harmonics and use an intensive
5
formulation to compute the coefficients that link the incident field with the scattered and transmitted ones. The complete Lorenz–Mie derivation is reviewed by Bohren and Huff -man (1998), and theTMatrix approach is described by Mischenko et al. (1996). Both theories provide the particle specific optical properties, i.e., the extinction, scattering and absorption cross sections (which describe the area of the incident-beam intensity
10
converted to extincted, scattered or absorbed light),CEXT,CSCAandCABSrespectively.
Using the obtained cross sections (size-averaged in polydisperse concentrations), the wavelength-dependent extinction, scattering and absorption coefficients (c(λ),b(λ) and a(λ) respectively) can be computed as:
c(λ)=N· hCEXT(λ)i, (1)
15
b(λ)=N· hCSCA(λ)i, (2)
a(λ)=N· hCABS(λ)i, (3)
whereN denotes the number of particles per unit volume andλthe wavelength. The relationship between the three parameters is:
c(λ)=a(λ)+b(λ). (4)
20
Scattering can be further characterized in terms of the angular distribution of the scattered light using the volume scattering function (β) as:
BGD
12, 18723–18768, 2015
Methods comparison to retrieve the refractive index of
small scatterers
A.-M. Sánchez and J. Piera
Title Page
Abstract Introduction
Conclusions References
Tables Figures
◭ ◮
◭ ◮
Back Close
Full Screen / Esc
Printer-friendly Version
Interactive Discussion
Discussion
P
a
per
|
Discussion
P
a
per
|
Discussion
P
a
per
|
Discussion
P
a
per
|
Ψis the scattering angle (i.e., the angle between the incident and scattered beams) and β(eΨ,λ) is the volume scattering phase function and the first parameter of the Stokes scattering matrix. This matrix transforms the Stokes parameters of the incident light into those of the scattered light and it is obtained with the Lorenz–Mie andTMatrix formulation when the physical characteristics of the particles are known. The integral
5
scattering in all directions, assuming azimuthal symmetry to preferential orientation, retrieves the total scattering coefficientb:
b(λ)=2π
π
Z
0
β(Ψ,λ) sin(Ψ)dΨ, (6)
which can be partitioned into its forward and backward components (bfandbb
respec-tively) by limiting the integration bounds from 0 toπ/2 and fromπ/2 toπrespectively.
10
The backscatter fraction, defined by:
Bb(λ)=
bb(λ)
b(λ) . (7)
gives the fraction of scattered light that is deflected through the scattering angles be-yondπ/2. Given Eqs. (5) and (6), the normalization condition for the volume scattering phase function is:
15
2π
π
Z
0 e
β(Ψ,λ) sin(Ψ)dΨ =1. (8)
This normalization implies that the backscatter fraction can be computed using the volume scattering phase function as:
Bb(Ψ,λ)=2π π
Z
π 2
e
BGD
12, 18723–18768, 2015
Methods comparison to retrieve the refractive index of
small scatterers
A.-M. Sánchez and J. Piera
Title Page
Abstract Introduction
Conclusions References
Tables Figures
◭ ◮
◭ ◮
Back Close
Full Screen / Esc
Printer-friendly Version
Interactive Discussion
Discussion
P
a
per
|
Discussion
P
a
per
|
Discussion
P
a
per
|
Discussion
P
a
per
|
The normalization factor 2πused in Eqs. (6), (8) and (9) is different from that used by Mischenko et al. (1996); Mischenko and Travis (1998); Wiscombe and Grams (1976); Mugnai and Wiscombe (1986), but used by Twardowski et al. (2001); Bohren and Huff -man (1998), and most of the books in Ocean Optics, and therefore, applied here.
2.2 Size distributions and polydispersions
5
Algal assemblages are typically polydispersed with regard to size, and can be de-scribed by a PSDF(d), whered is the particle diameter, andF(d)d(d) is the number of particles per unit volume in the size range d±1/2d(d). Using absorption as an example (analogous expressions may be used for the other coefficients), the absorp-tion efficiency factor representing the mean of a size distribution can be described as
10
(Bricaud and Morel, 1986):
Qa= R∞
0QaF(d)d 2
d(d)
R∞
0F(d)d2d(d)
. (10)
The relationship between the absorption efficiency factor and the absorption cross sec-tion is:
Qa=
Ca
G, (11)
15
beingGthe geometric cross section of the particle. And the resultant volume absorp-tion coefficient is given by either:
a=π
4 ∞
Z
0
BGD
12, 18723–18768, 2015
Methods comparison to retrieve the refractive index of
small scatterers
A.-M. Sánchez and J. Piera
Title Page
Abstract Introduction
Conclusions References
Tables Figures
◭ ◮
◭ ◮
Back Close
Full Screen / Esc
Printer-friendly Version
Interactive Discussion
Discussion
P
a
per
|
Discussion
P
a
per
|
Discussion
P
a
per
|
Discussion
P
a
per
|
or, if the result of Eq. (10) is used:
a=π
4Qa ∞
Z
0
F(d)d2d(d). (13)
3 Review of refractive index retrieval models
In this section, a review of the different approximations to retrieve the refractive index is presented. Each method is named using the surname of one of the authors who
5
published it. The complex refractive indexm(λ) is defined as:
m(λ)=n(λ)+ik(λ), (14)
where the real partn(λ) determines the phase velocity of the propagating wave, and the imaginary partk(λ) determines the flux decay. Note that the effective refractive index is a relative value dependent upon the surrounding medium. This paper assumes as the
10
relative refractive index in watermwater=1.334+i0 (Hale and Querry, 1973).
3.1 The Twardowski model
The Twardowski model, presented by (Twardowski et al., 2001), is based on Volz (1954) as cited in van de Hulst (1957). It is derived using the Lorenz–Mie theory and the re-lationship between the particulate spectral attenuation (cp(λ)) and the size distribution 15
to retrieve the bulk particulate refractive index from in situ optical measurements. In particular, assumes thatγ=ξ−3, beingγ the hyperbolic slope of the attenuation coef-ficient andξ the power-law slope of the PSD. It only considers power-law distributions that fulfil the conditions 2.5≤ξ≤4.5 and 0≤Bb≤0.03. The bulk refractive index is obtained using a polynomial fit to the output of Lorenz–Mie calculations as:
20
ˆ
m(Bb,γ)=1+B
0.5377+0.4867γ2 b
BGD
12, 18723–18768, 2015
Methods comparison to retrieve the refractive index of
small scatterers
A.-M. Sánchez and J. Piera
Title Page
Abstract Introduction
Conclusions References
Tables Figures
◭ ◮
◭ ◮
Back Close
Full Screen / Esc
Printer-friendly Version
Interactive Discussion
Discussion
P
a
per
|
Discussion
P
a
per
|
Discussion
P
a
per
|
Discussion
P
a
per
|
This formulation is only exact for particles spanning from 0 to infinity which do not absorb (kis neglected) and are homogeneous spheres. It was first tested by Boss et al. (2001a) and refined in Boss et al. (2001b). It must be noted that the model is consistent with the measurements obtained from an AC9 with the scattering coefficientbserving as integrated scattering from 0.93 to 180◦, which must be considered in Eq. (9). Even
5
though this was not firstly considered in the calculations in Twardowski et al. (2001), it was taken into account in Boss et al. (2004), but the regression was not recomputed.
3.2 The Stramski model
This model is based on the methods presented by Stramski et al. (1988), which is an extension of that developed by Bricaud and Morel (1986). It is based on the ADA, first
10
described in van de Hulst (1957). The ADA offers approximations to the absorption and attenuation optical efficiency factors using relatively simple algebraic formulae, based on the assumptions that the particle is large relative to wavelength (α=πdλ ≫1) and the refractive index is small (m−1≪1 andk≪1). This method allows the effects of the real and imaginary refractive indices on absorption and scattering to be decoupled.
15
Assuming homogeneous geometry, the ADA expression for the absorption efficiency factor is given by:
Qa=1+
2e−ρ′ ρ′ +2
e−ρ′−1
ρ′2 , (16)
whereρ′=4αk is the absorption optical thickness. Equations (13) and (16) are then used iteratively to determine the homogeneous imaginary part of the refractive index
20
(k(λ)) in conjunction with measured algal absorption and PSD data. According to the Ketteler–Helmholtz theory of anomalous dispersion (van de Hulst, 1957), a variation in k induce variations in n, quantified with a series of oscillators (representing discrete absorption bands) based on the Lorentz–Lorentz equations (Stramski et al., 1988; Bricaud and Morel, 1986). These spectral variations (denoted as∆n(λ)) vary around
BGD
12, 18723–18768, 2015
Methods comparison to retrieve the refractive index of
small scatterers
A.-M. Sánchez and J. Piera
Title Page
Abstract Introduction
Conclusions References
Tables Figures
◭ ◮
◭ ◮
Back Close
Full Screen / Esc
Printer-friendly Version
Interactive Discussion
Discussion
P
a
per
|
Discussion
P
a
per
|
Discussion
P
a
per
|
Discussion
P
a
per
|
a central part of the real refractive index 1+ǫ. Thus:
n(λ)=1+ǫ+ ∆n(λ). (17)
The central value 1+ǫis estimated by computing the nonabsorbing equivalent
pop-ulation attenuation efficiency factor
QNAEc
at those wavelengths where ∆n(λǫ)=0.
Considering polydispersion, this is done according to:
5
QNAEc (ρ)=
R∞
0Qc(ρ)F(ρ)ρ 2
d(ρ)
R∞
0F(ρ)ρ2d(ρ)
, (18)
where ρ=2α(n−1), F(ρ) is obtained from the experimental size distribution by the replacement of d by ρ and Qc(ρ) from the van de Hulst’s formula assuming ξ=0
(van de Hulst, 1957):
Qc=2−4
ρsinρ+ 4
ρ2(1−cosρ). (19)
10
The exact value ofǫis indicated by suchQNAEc (ρ) that it equalsQc(λǫ).
This methodology was latterly simplified by Bernard et al. (2001, 2009) by using the Kramers–Kronig relations to compute the spectral variations in the real part of the refractive index instead the Lorentzian oscillators. The Kramers–Kronig relations de-scribe the mutual dependence of the real and imaginary parts of the refractive index
15
through dispersion, as does Ketteler–Helmholtz theory, but they are more simply ap-plied than the tedious and sometimes inaccurate use of summed oscillators (the real part is the Hilbert transform of the imaginary part, van de Hulst, 1957).
3.3 The Bernard model
Meyer (1979) and Bernard et al. (2009) suggested that two-layered spherical geometry
20
BGD
12, 18723–18768, 2015
Methods comparison to retrieve the refractive index of
small scatterers
A.-M. Sánchez and J. Piera
Title Page
Abstract Introduction
Conclusions References
Tables Figures
◭ ◮
◭ ◮
Back Close
Full Screen / Esc
Printer-friendly Version
Interactive Discussion
Discussion
P
a
per
|
Discussion
P
a
per
|
Discussion
P
a
per
|
Discussion
P
a
per
|
Bernard et al. (2009), the outer layer accounts for the chloroplast and the inner layer for the cytoplasm. Refractive index values are assumed for the cytoplasm, with a spectral imaginary part modelled as:
kcyto(λ)=kcyto(400)e[−0.01(λ−400)], (20)
wherekcyto(400)=0.0005. The real refractive index spectra for the cytoplasm,ncyto(λ), 5
is obtained using the Hilbert transform (absorption has an influence on scattering and attenuation, expressed through the Kramers–Kronig relations) and Eq. (17) with 1+ǫ=
1.02. Using thekcyto(λ) of Eq. (20), volume equivalent kchlor(λ) are determined using
the Gladstone–Dale formulation given by:
kchlor(λ)=
kh(λ)−kcyto(λ)Vv
1−Vv , (21)
10
wherekh(λ) is the imaginary part of the refractive index considering homogeneous cells
and obtained using Eq. (16), and Vv is the relative chloroplast volume. According to Bernard et al. (2009), a Vv value of 20 % can be considered as a first approximation for a spherical algal geometry, although higher values should be considered for the large celled dinoflagellate and crytophyte samples. Other previous studies have employed
15
relative chloroplast volumes of Vv=41 % (Zaneveld and Kitchen, 1995), Vv=58 % (Latimer, 1984), and Vv=27 to 66 % (Bricaud et al., 1992). The real refractive index spectra for the chloroplastnchlor(λ) is then similarly generated with a Hilbert transform
and Eq. (17) with assumed 1+ǫvalues between 1.044 and 1.14 depending upon the sample.
20
3.4 The genetic algorithm model
BGD
12, 18723–18768, 2015
Methods comparison to retrieve the refractive index of
small scatterers
A.-M. Sánchez and J. Piera
Title Page
Abstract Introduction
Conclusions References
Tables Figures
◭ ◮
◭ ◮
Back Close
Full Screen / Esc
Printer-friendly Version
Interactive Discussion
Discussion
P
a
per
|
Discussion
P
a
per
|
Discussion
P
a
per
|
Discussion
P
a
per
|
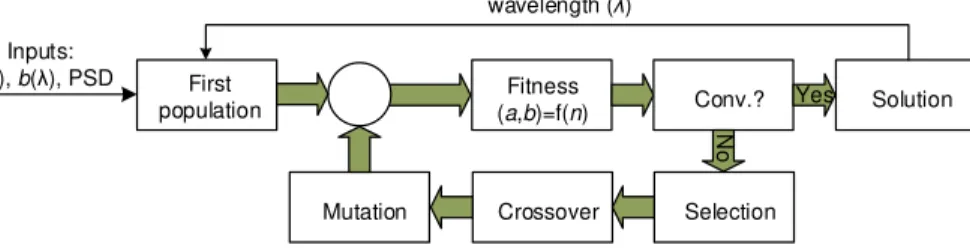
The performance of the algorithm can be summarized as follows (see Fig. 1). First, a random vector of solutions is generated for a specific wavelength ([n1(λi),n2(λi),. . .,
nn(λi)], where λi denotes the selected wavelength andn1,n2,. . .,nn the complex
re-fractive indices). If possible, the search space can be bounded in order to maximize the algorithm success. Then, the complete vector is evaluated by the fitness function.
5
This is done by computing the a and b coefficients associated to each refractive in-dex (using the Lorenz–Mie orT Matrix formulation and Eqs. 2–3) and evaluating the weighted euclidean distance between the calculated and desired coefficients. This can be obtained, for instance, as:
ea=|20 log(ak(λi))−20 log(am(λi))|, (22) 10
whereak is the calculated attenuation coefficient of thenk refractive index, am is the
desired (or measured) attenuation coefficient, andeais the committed error for the
ab-sorption coefficient. Using logarithmic values allows a suitable weighting factor when dealing with small errors over small coefficients. The same equation accounts for the scattering coefficient. Both results are finally combined using the quadratic mean,
ob-15
taining a single evaluation value that the algorithm tries to minimize.
After the evaluation, the algorithm may stop if either a maximum number of gen-erations (each generation is a new vector of solutions) or a satisfactory fitness level have been reached. If the convergence condition is not fulfilled, the best solutions are selected and separated. Part of this elite is then recombined (crossover) and
ran-20
domly mutated to provide genetic diversity and broaden the search space (crossover and mutation introduce the diversity needed to ensure that the entire sample space is reachable and avoid becoming stuck at suboptimal solutions, Greenhalgh and Mar-shall, 2000). The new set of solutions is re-evaluated and inserted again into the solu-tions’ vector, which completes the cycle. After convergence is achieved, the algorithm
25
presents the best solution it has been able to find.
BGD
12, 18723–18768, 2015
Methods comparison to retrieve the refractive index of
small scatterers
A.-M. Sánchez and J. Piera
Title Page
Abstract Introduction
Conclusions References
Tables Figures
◭ ◮
◭ ◮
Back Close
Full Screen / Esc
Printer-friendly Version
Interactive Discussion
Discussion
P
a
per
|
Discussion
P
a
per
|
Discussion
P
a
per
|
Discussion
P
a
per
|
different wavelengths), the genetic algorithm performs the search procedure at a single wavelength each time. After each convergence, the process starts again with the next wavelength-dependent values, eventually obtaining the complete complex-refractive-index signature.
The main advantage of this model is that it can be easily adapted to different Lorenz–
5
Mie or T Matrix codes, as for instance those developed for homogeneous spheres, coated spheres, cylinders, etc. Besides it can also be easily combined with other mod-els to improve the results. On the other hand, it must be noted, that some inversions could be ill-posed. A constrained optimization problem is considered to be well-posed in the sense of Haddamard if (a) a solution exists, (b) the solution is unique and (c) the
10
solution is well-behaved, i.e. varies continuously with the problem parameters. An ill-posed problem fails to satisfy one or more of the aforementioned criteria (Bhandarkar et al., 1994). In that case, techniques such as regularization methods can be applied to improve the results (Mera et al., 2004).
4 Experimental simulations
15
The models described in the previous section are used here to retrieve the refrac-tive index of well-known particles in order to determine their accuracy in estimating their refractive index and reproducing their IOPs. To this end, Sect. 4.1 deals with a simple spherical and homogeneous particle and presents the results provided by the Twardowski, Stramski and Genetic Algorithm models. Such particles, however, are
20
not a fair representation of phytoplankton particles. First, because eukaryotic phyto-plankton cells are heterogeneous particles with membrane systems and intracellular organelles, and second, because most of the phytoplankton species are not spherical. As stated by Bernard et al. (2009), the spherical structure mainly fails in the description of the backward scattering and suggests a two-layered spherical geometry as the
sim-25
BGD
12, 18723–18768, 2015
Methods comparison to retrieve the refractive index of
small scatterers
A.-M. Sánchez and J. Piera
Title Page
Abstract Introduction
Conclusions References
Tables Figures
◭ ◮
◭ ◮
Back Close
Full Screen / Esc
Printer-friendly Version
Interactive Discussion
Discussion
P
a
per
|
Discussion
P
a
per
|
Discussion
P
a
per
|
Discussion
P
a
per
|
particle and presents the estimated refractive indices provided by the genetic algorithm model, the Bernard model and a combination of both. Finally, Sect. 4.3 uses a cylin-drical shape particle with a homogeneous refractive index. This shape was selected to be far different from a sphere and similar to that of some species of phytoplankton (as for instance, the diatomThalassiosira pseudonana). Although this synthetic model do
5
not exactly reproduce the same optical behaviour as the actual phytoplankton particle (the micro details of the cells are neglected), it can serve as a first approximation. Re-fractive index estimations provided by the combination of the genetic algorithm with the Bernard model for coated spheres and the Genetic Algorithm are shown.
4.1 Spherical-shape homogeneous particles
10
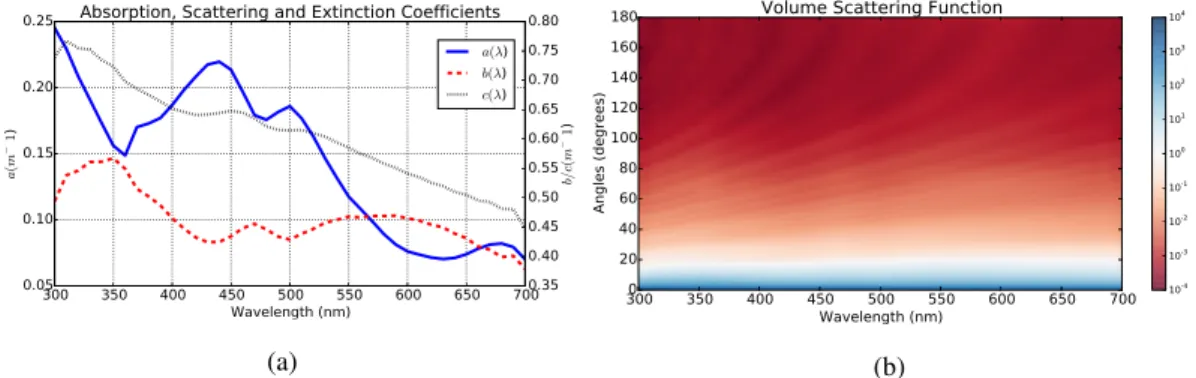
A concentration of 100 spherical particles mm−3 presenting the PSD of Fig. 2a (based on a power-law distribution – or Junge-type – with 51 points, Rmin=0.7 µm, Rmax=
12.1 µm, a slop parameter ξ=3, effective radius reff=4 µm and effective variance
veff=0.6), along with the initial complex refractive index of Fig. 2b, was simulated using the Lorenz–Mie characterization (Bohren and Huffman, 1998). In particular, the BHMIE
15
code, original from Bohren and Huffman and modified by B.T. Draine, was used (addi-tional features were added, such as polydispersion and the computation of the Stokes scattering matrix). The obtaineda(λ),b(λ) andc(λ) coefficients are shown in Fig. 3a. As can be observed, the concentration was selected in order to obtain coefficient val-ues similar to those measured by (Twardowski et al., 2001) and (Stramski et al., 2001).
20
Although the power-law distribution is not a realistic distribution for single phytoplankton species, is a fairly good approximation of natural-water composition (even with anoma-lous natural conditions such as a phytoplankton bloom), as there is always a strong background contribution to the PSD (Twardowski et al., 2001). Besides, it is the only distribution that can be used in the Twardowski model, and therefore, used here. The
25
BGD
12, 18723–18768, 2015
Methods comparison to retrieve the refractive index of
small scatterers
A.-M. Sánchez and J. Piera
Title Page
Abstract Introduction
Conclusions References
Tables Figures
◭ ◮
◭ ◮
Back Close
Full Screen / Esc
Printer-friendly Version
Interactive Discussion
Discussion
P
a
per
|
Discussion
P
a
per
|
Discussion
P
a
per
|
Discussion
P
a
per
|
dependence of the real on the imaginary part of the refractive index can be found in the Kramers–Kronig relations (Bernard et al., 2001, 2009; Bricaud and Morel, 1986; van de Hulst, 1957), which allow the spectral variations in the real refractive index to be calculated as a Hilbert transform of the imaginary refractive index. The central part of the real refractive index was selected as 1+ǫ=1.05 (for phytoplankton it typically
5
ranges from 1.02 to 1.15, relative to water, as stated in Morel, 1973; Carder et al., 1974; Aas, 1996; Bernard et al., 2001). The effects due to normal dispersion, as described in Aas (1996), have not been considered. As can be seen, the imaginary part presents three peak values, at 440, 500 and 680 nm (corresponding to the chlorophyll absorp-tion wavelengths), and, as expected, a similar shape is propagated to the absorpabsorp-tion
10
coefficient spectra,a(λ), of Fig. 3a. The volume scattering function at each wavelength is shown in Fig. 3b. As expected (since particles are relatively large regarding to wave-length), the scattering is mainly focused in the forward direction (between 0 and 10◦) and smoothly decreases in the backward direction.
4.1.1 The Twardowski model
15
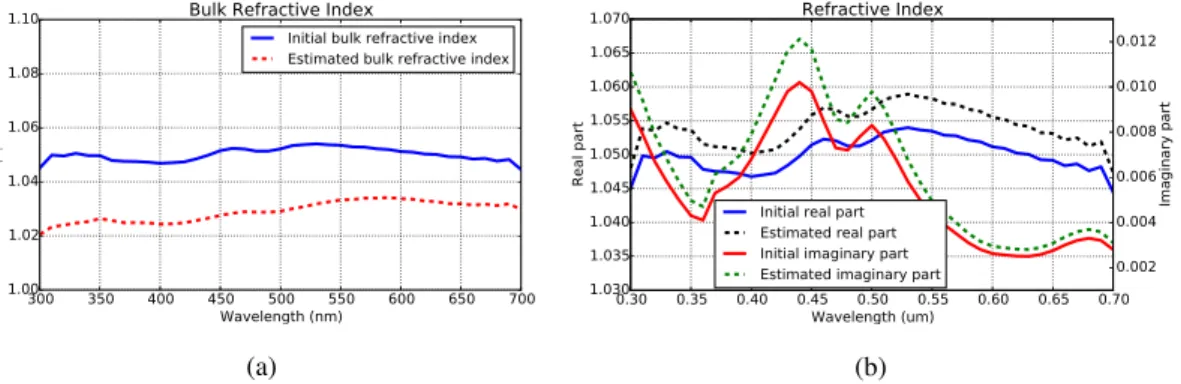
Equation (15) was applied on this example obtaining the results shown in Fig. 4a. To this end,γ=0 since the slop parameter of the PSDξ=3, and the backscatter fraction was computed with Eq. (9) using the volume scattering phase function values given by the modified BHMIE code. As can be seen, this model obtains a curve shape similar to the absolute value of the original complex refractive index, but with a slight negative
20
offset, presenting an averaged relative error of 42 % (obtained using|m| −1). It must be noted that the Twardowski model was designed for a bulk oceanic distribution present-ing different physical properties than those of isolated species of phytoplankton (e.g. index of refraction, shape, etc.), and therefore, it is used here in a different scenario it was designed to.
BGD
12, 18723–18768, 2015
Methods comparison to retrieve the refractive index of
small scatterers
A.-M. Sánchez and J. Piera
Title Page
Abstract Introduction
Conclusions References
Tables Figures
◭ ◮
◭ ◮
Back Close
Full Screen / Esc
Printer-friendly Version
Interactive Discussion
Discussion
P
a
per
|
Discussion
P
a
per
|
Discussion
P
a
per
|
Discussion
P
a
per
|
4.1.2 The Stramski model
The results obtained with this model are shown in Fig. 4b. As can be seen, this model overestimates both real and imaginary parts on all the analysed spectra, showing an averaged relative error of 0.4 % for the real part and a 15 % for the imaginary part. It should be remembered that the imaginary part of the refractive index,kh, is calculated 5
with the ADA, known to give errors of ∼10 % in comparison to Lorenz–Mie theory (Bernard et al., 2009), and some discrepancies can therefore be expected between ADA and Aden–Kerker derived values.
4.1.3 Genetic algorithm
In order to implement the genetic algorithm described in Sect. 3.4, the tools provided
10
by the DEAP and SCOOP frameworks to develop evolutionary algorithms and parallel task distribution respectively, were used (Fortin et al., 2012). The fitness function was implemented using the fast subroutines of BHMIE to compute the absorption and scat-tering properties of homogeneous spheres. The coefficientsa and b of Fig. 3a were used as inputs of the genetic algorithm model to estimate the initial complex
refrac-15
tive index and bounding conditions were applied to facilitate the convergence (typical values for the real part of the phytoplankton refractive indices fall within 1.02 and 1.15 relative to water, and the bulk value of the imaginary part is always below 0.02). The genetic algorithm was configured with a vector of 2000 solutions over 10 generations and 50 and 20 % of probability of crossover and mutation respectively, obtaining the
20
estimated values shown in Fig. 5a. The good agreement between the initial complex-refractive-index values and the estimated ones (an averaged relative error of 0.004 % for the real part and 0.24 % for the imaginary part is obtained, presenting thus the best results in this first example) shows that it is possible to perform accurate estimations with a genetic algorithm.
25
BGD
12, 18723–18768, 2015
Methods comparison to retrieve the refractive index of
small scatterers
A.-M. Sánchez and J. Piera
Title Page
Abstract Introduction
Conclusions References
Tables Figures
◭ ◮
◭ ◮
Back Close
Full Screen / Esc
Printer-friendly Version
Interactive Discussion
Discussion
P
a
per
|
Discussion
P
a
per
|
Discussion
P
a
per
|
Discussion
P
a
per
|
execute the fitness function many more times. For comparison purposes, other opti-mization algorithms were applied to determine if there is the possibility to obtain accu-rate results with an important reduction of the computation time. Figure 5b shows the results obtained with the much faster Broyden–Fletcher–Goldfarb–Shanno (BFGS) al-gorithm (BFGS is an iterative method for solving unconstrained nonlinear optimization
5
problems, Zhu et al., 1997), executed using the same bounding conditions as in the ge-netic algorithm case. In this case, only 224 s (less than 4 min) were needed in front of the 97 min used by the genetic algorithm, both in a PC with an Intel Core i7 processor at 3.2 GHz, a 16 GB RAM and running a Windows 8.1. However, although the results are quite satisfactory in general, some of the wavelengths present a significant error
10
in the real part (mainly, between 550 and 600 nm, and above 680 nm). The averaged relative error is 0.073 % for the real part and 0.72 % for the imaginary part. Other op-timization algorithms, such as the conjugated gradient algorithm (Nocedal and Wright, 1999), were also tested. The results, not shown here for space limitations, presented a worse accuracy than the BFGS, showing that the genetic algorithm is probably the
15
optimal method to solve this problem in terms of accuracy (but not in terms of time).
4.2 Spherical-shape coated particles
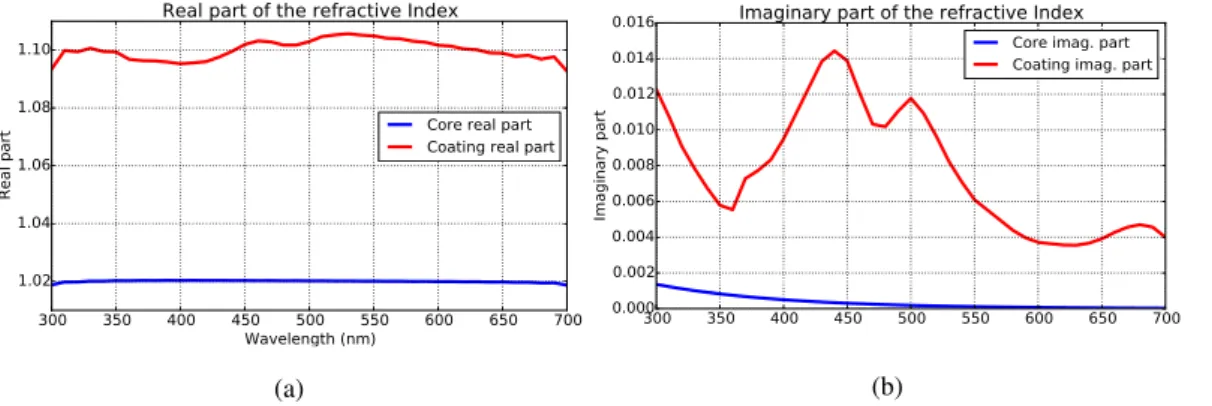
In order to use the IOPs of a two-layered spherical particle that emulates actual phyto-plankton properties, its complex refractive index was generated using the description presented in Bernard et al. (2009). The imaginary refractive index of the inner
cyto-20
plasm was obtained using Eq. (20) and its real one using the Hilbert transform and Eq. (17) with 1+ǫ=1.02. The imaginary refractive index of the outer chloroplast was obtained using Eq. (21), with Vv=30 % (since it is a value between that assumed by Bernard et al., 2009, and previous works), and its real one using the Hilbert trans-form and Eq. (17) with 1+ǫ=1.1. Figure 6a and b show the results for the real and
25
BGD
12, 18723–18768, 2015
Methods comparison to retrieve the refractive index of
small scatterers
A.-M. Sánchez and J. Piera
Title Page
Abstract Introduction
Conclusions References
Tables Figures
◭ ◮
◭ ◮
Back Close
Full Screen / Esc
Printer-friendly Version
Interactive Discussion
Discussion
P
a
per
|
Discussion
P
a
per
|
Discussion
P
a
per
|
Discussion
P
a
per
|
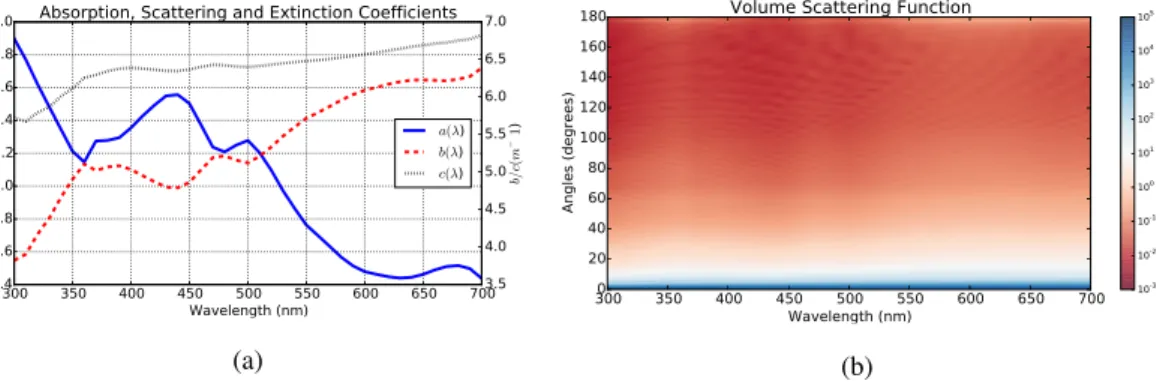
the PSD of an isolated culture was simulated with a concentration of 40 particles mm−3 (Rmin=0.7 µm,Rmax=12.1 µm). It must be noted that the PSD denotes the external
ra-dius (the inner one can be extracted using the Vv value). In this case, the function does not agree with a perfect power-law distribution since there is a minimum size beneath which there are no cells. Thus, the PSD of Fig. 7 (using 31 points) better represents
5
the case of a monoculture PSD. Using this PSD with the previous refractive indices, the absorption, scattering and extinction coefficients of Fig. 8a, and the volume scattering function of Fig. 8b were obtained.
Below, the IOPs presented above are used to estimate their complex refractive in-dices. First, this is done using the genetic algorithm in order to see if a basic shape
10
such as a homogeneous sphere is useful when modelling more complex particles. If coated particle models better characterize the optical properties of general phytoplank-ton species, as stated in Bernard et al. (2009), this can be used to estimate the error committed when using spheres. Then, the inner and the outer complex refractive in-dices of the original particle are retrieved using the Bernard model for coated particles.
15
Finally, a combination of the genetic algorithm and the Bernard model is applied to improve the previous results.
4.2.1 The genetic algorithm
The genetic algorithm model to retrieve the refractive index of spherical-shape ho-mogeneous particles was applied in order to measure the error committed in such
20
approximation. The same configuration as in the previous example was used (an ini-tial vector of 2000 solutions over 10 generations and 50 and 20 % of probabilities for crossovers and mutations respectively). The estimated complex refractive index is shown in Fig. 9a. Both real and imaginary parts present values between the inner and the outer real and imaginary parts of Fig. 6a and b respectively. The volume scattering
25
BGD
12, 18723–18768, 2015
Methods comparison to retrieve the refractive index of
small scatterers
A.-M. Sánchez and J. Piera
Title Page
Abstract Introduction
Conclusions References
Tables Figures
◭ ◮
◭ ◮
Back Close
Full Screen / Esc
Printer-friendly Version
Interactive Discussion
Discussion
P
a
per
|
Discussion
P
a
per
|
Discussion
P
a
per
|
Discussion
P
a
per
|
the backscattering, presenting values far below those of Fig. 8b. This example demon-strates that the common characterization using homogeneous spheres is not a suitable methodology when dealing with complex particles. Even though it is not a surprising result (this is well known and has been discussed for years, by Bohren and Huffman, 1998, in the atmospheric literature, and by Stramski et al., 2004; Clavano et al., 2007;
5
Dall’Olmo et al., 2009, and Bernard et al., 2009), in the oceanic literature), a compari-son between the two volume scattering functions manifests that the backscattering can achieve errors up to one order of magnitude.
4.2.2 The Bernard model
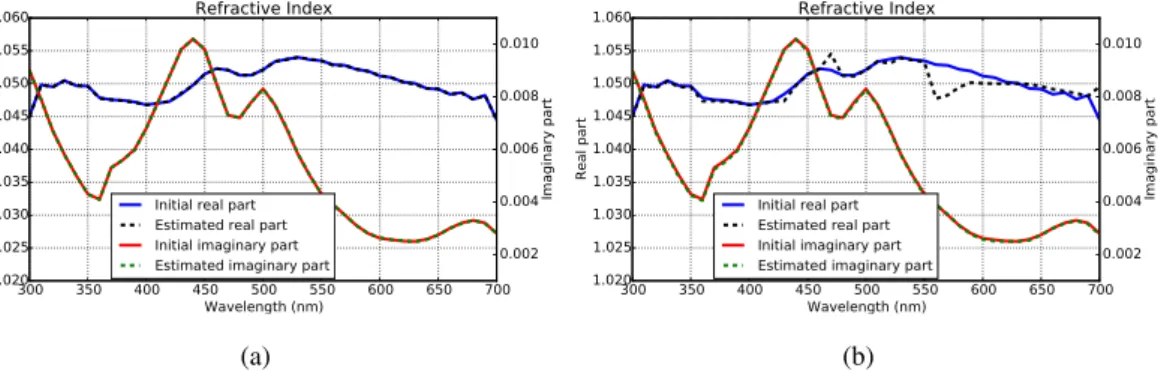
The Bernard model of Sect. 3.3 was used to estimate the complex refractive index of
10
the two-layered particle. Figure 10a shows the initial and estimated real part of the in-ner and outer layers and Fig. 10b shows the initial and estimated imaginary parts. As expected, the inner refractive index is well estimated (since the same equation is used for both generation and retrieval), but the outer refractive index does not present an accurate agreement. In particular, the imaginary part is meaningfully underestimated,
15
with an averaged relative error of 51 %. On the other hand, the simulation of the esti-mated refractive indices in coated spheres produce a volume scattering function which is in a better agreement with that of Fig. 8b than the volume scattering function pro-duced by the homogeneous spherical particle (the volume scattering function figure has not been added in this case since errors are not appreciated; a deeper analysis is
20
done in Sect. 5).
4.2.3 The Bernard model combined with genetic algorithm
In order to improve the results presented by the Bernard model in the previous sub-section, the genetic algorithm, which showed a suitable performance when applied to homogeneous spherical particles, could be coupled to the BART code (instead the
BH-25
BGD
12, 18723–18768, 2015
Methods comparison to retrieve the refractive index of
small scatterers
A.-M. Sánchez and J. Piera
Title Page
Abstract Introduction
Conclusions References
Tables Figures
◭ ◮
◭ ◮
Back Close
Full Screen / Esc
Printer-friendly Version
Interactive Discussion
Discussion
P
a
per
|
Discussion
P
a
per
|
Discussion
P
a
per
|
Discussion
P
a
per
|
hardly be accurate since the solution has a higher dimension (the two refractive indices with real and imaginary parts each, that is, four dimensions) than the information data (the attenuation and scattering coefficients, that is, two dimensions). However, there is the possibility to combine the genetic algorithm with the Bernard model to increase the convergence probability. In this case, the inner refractive index is firstly estimated using
5
the Bernard model, as it was done before, and the outer refractive index is obtained secondly with the genetic algorithm (coupled to the BART code). In this case, the ge-netic algorithm only has to find a solution with two dimensions (the real and imaginary parts of the outer refractive index), more affordable than the whole set of refractive indices.
10
This method was applied on the coated particle example (using he coefficients of Fig. 8a as input data and configured using an initial vector of 2000 solutions, 10 gener-ations, 50 % of probability for crossovers and 20 % for mutations), obtaining the initial and estimated real part of the inner and outer layers shown in Fig. 11a and the ini-tial and estimated imaginary parts shown in Fig. 11b. As it can be seen, accurate
15
results were obtained, meaningfully improving the refractive index estimation for the outer sphere. In this particular case, an average relative error of 0.01 % was obtained for the real part and a 0.14 % for the imaginary part.
4.3 Cylindrical-shape particles
As a final example, a cylindrical shape particle has been chosen. As commented above,
20
phytoplankton species usually present complex shapes, far from perfect homogeneous or coated spheres (as it is the case of the diatom Thalassiosira pseudonana). In or-der to find which is the most accurate model for the characterization of such complex shapes, an example considering 100 prolate cylinders mm−3with a diameter-to-length ratio equivalent to 0.8, the PSD of Fig. 12 (showing the radius of an equivalent volume
25
sphere with a slop parameterξ=3, effective radiusreff=3.2 µm and effective variance
veff=0.005 resulting inRmin=0.8 µm toRmax=3.6 µm), and the initial refractive index
BGD
12, 18723–18768, 2015
Methods comparison to retrieve the refractive index of
small scatterers
A.-M. Sánchez and J. Piera
Title Page
Abstract Introduction
Conclusions References
Tables Figures
◭ ◮
◭ ◮
Back Close
Full Screen / Esc
Printer-friendly Version
Interactive Discussion
Discussion
P
a
per
|
Discussion
P
a
per
|
Discussion
P
a
per
|
Discussion
P
a
per
|
Mischenko and Travis, 1998). To this end, the code from M. Mischenko (Mischenko and Travis, 1998) forT Matrix computations on randomly oriented, rotationally symmetric scatterers (cylinders, spheroids and Chebyshev particles) was used. The PSD presents a small effective variance for convergence limitations of the code. The initiala(λ),b(λ) andc(λ) coefficients are shown in Fig. 13a, and the volume scattering function at each
5
wavelength is shown in Fig. 13b.
4.3.1 The Bernard model combined with genetic algorithm
Even though this IOP is not an exact copy of an actual phytoplankton IOP (for the reasons commented before), the coated sphere model is used here to model the cylin-drical shape to analyse their differences. Figure 14a shows the initial and estimated real
10
part of the inner and outer layers and Fig. 14b shows the initial and estimated imagi-nary parts. The volume scattering function is shown in Fig. 15. The committed error in this last figure is noticeable even to the naked eye, especially at higher wavelengths, achieving an averaged relative error of 77 %. It should be noted that these differences may decrease when using real phytoplankton, since backscattering of heterogeneous
15
particles is different from that of homogeneous particles.
4.3.2 The genetic algorithm
One possible action could be exerted using the genetic algorithm combined with the
TMatrix code in order to consider cylindrical shapes when estimating the inner com-plex refractive index. However, one simulation of cylindrical shape particles with such
20
dimensions, using the Mischenko code, needs about 67 min in a computer with an i7 at 3.20 GHz and running Windows 8.1. This prevents the use of the genetic algorithm in such circumstances, since it needs to execute this simulation several hundreds of times at each wavelength in order to accurately estimate the complex refractive index. That means that several months would be required to estimate the whole refractive index
25
BGD
12, 18723–18768, 2015
Methods comparison to retrieve the refractive index of
small scatterers
A.-M. Sánchez and J. Piera
Title Page
Abstract Introduction
Conclusions References
Tables Figures
◭ ◮
◭ ◮
Back Close
Full Screen / Esc
Printer-friendly Version
Interactive Discussion
Discussion
P
a
per
|
Discussion
P
a
per
|
Discussion
P
a
per
|
Discussion
P
a
per
|
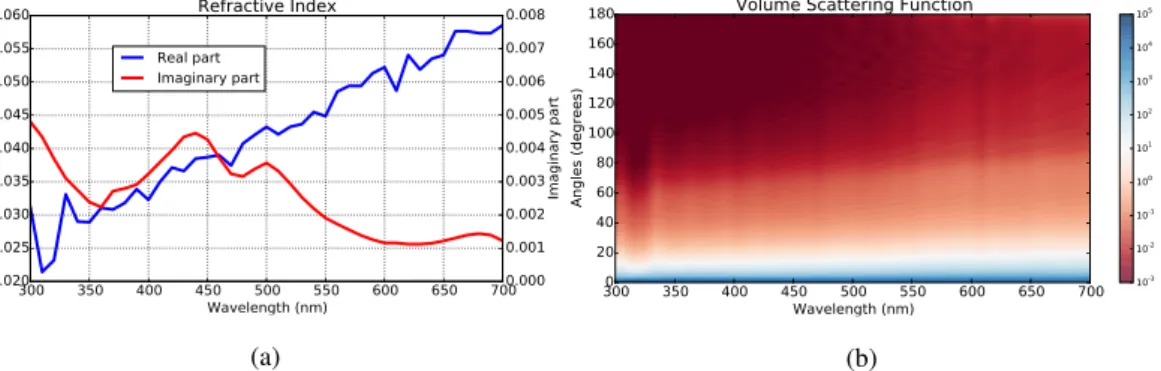
must be considered. In order to perform fast estimations, equal-volume homogeneous particles with spherical shape are considered instead of the cylinders. This allows us-ing the Lorenz–Mie theory instead theT Matrix approach, dramatically improving the simulation time. Then, the estimated refractive index using homogeneous spheres is finally applied on homogeneous cylinders to obtain their IOP, since the volume
scatter-5
ing function values are case sensitive to the particle shape. Although the slowTMatrix approach is needed for this simulation, it has to be executed only once.
The methodology was applied on this last example using the same PSD of Fig. 12. The estimated complex refractive index is shown in Fig. 16a. The averaged relative error of the real part is 7.75 and 2.61 % for the imaginary part. The major differences are
10
obtained at the lowest wavelengths, which is also noticeable in the volume scattering function, as seen in Fig. 16b, with some artefacts in those wavelengths where abrupt changes of the real part of the refractive index occur (330 and 350 nm). However, the averaged relative error committed decreases from 77 % in the previous method to 16 %. If homogeneous spheres are used instead of cylinders to obtain the IOP, the averaged
15
relative error increases to 22 %, which demonstrates that choosing a suitable shape improves the results.
5 Discussion
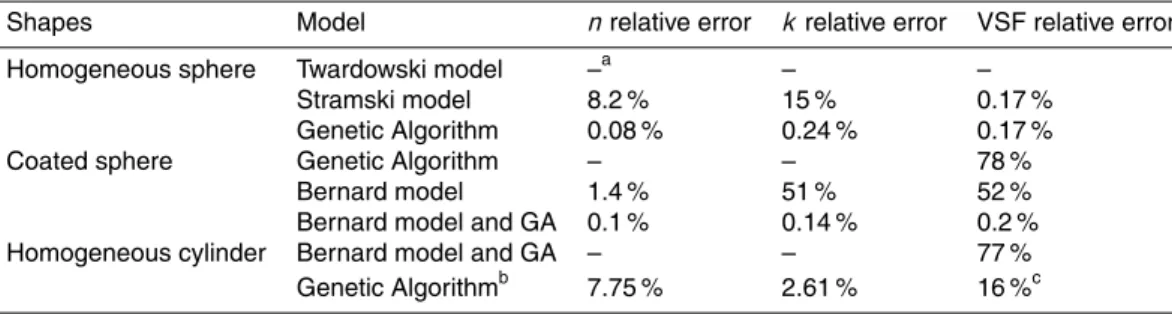
Table 1 shows the averaged relative errors associated with each method when estimat-ing the real and imaginary parts of the refractive indices and the one committed by the
20
respective volume scattering functions in the three examples of the previous section. In the real part case, the error was obtained usingn−1 instead ofn.
In the homogeneous sphere example, only the errors committed by the Stramski model and the Genetic Algorithm are shown, since the Twardowski model computes the bulk refractive index, and real and imaginary parts cannot be separated. Thus,
nei-25
BGD
12, 18723–18768, 2015
Methods comparison to retrieve the refractive index of
small scatterers
A.-M. Sánchez and J. Piera
Title Page
Abstract Introduction
Conclusions References
Tables Figures
◭ ◮
◭ ◮
Back Close
Full Screen / Esc
Printer-friendly Version
Interactive Discussion
Discussion
P
a
per
|
Discussion
P
a
per
|
Discussion
P
a
per
|
Discussion
P
a
per
|
It can also be seen in the table that, although the errors of the Stramski model are considerably higher than the ones of the Genetic Algorithm, specially in the imaginary part estimation, similar estimations of the volume scattering function are recovered in both cases. This implies that there is no need of an accurate refractive index estima-tion in this particular example to obtain a suitable characterizaestima-tion of the scattering
5
properties. However, the Genetic Algorithm performs with an extreme accuracy for the refractive-index retrieval.
In the coated sphere example, the Genetic Algorithm approximates the coated par-ticle to a homogeneous one with a single complex refractive index. Therefore, errors for the inner and outer refractive indices cannot be obtained. Besides, this method
10
presents an important disagreement when computing the volume scattering function. This result shows that, in case the optical behaviour of coated spheres were closer to that of actual phytoplankton particles, as stated in (Bernard et al., 2009), homogeneous spheres would not be a suitable choice to accurately reproduce their optical behaviour. The Bernard model is a fast technique to estimate the inner and outer refractive
in-15
dices, but mainly fails in estimating the imaginary part of the refractive index (with an error up to 51 %). This leads to a significant error committed by the computed volume scattering function. However, if the Bernard model is combined with the Genetic Algo-rithm (the Bernard model is used to estimate the inner refractive index, and the Genetic Algorithm to retrieve the external one), accurate values are obtained for the complex
20
refractive indices and for the volume scattering function.
Finally, in the homogeneous cylinder case, it can be seen that the optical properties of this kind of particles are not accurately reproduced using a coated sphere which refractive indices are obtained with the combination of the Bernard model and the Ge-netic Algorithm. From the previous results, it could be expected that the optimal retrieval
25
BGD
12, 18723–18768, 2015
Methods comparison to retrieve the refractive index of
small scatterers
A.-M. Sánchez and J. Piera
Title Page
Abstract Introduction
Conclusions References
Tables Figures
◭ ◮
◭ ◮
Back Close
Full Screen / Esc
Printer-friendly Version
Interactive Discussion
Discussion
P
a
per
|
Discussion
P
a
per
|
Discussion
P
a
per
|
Discussion
P
a
per
|
homogeneous spheres with equal volume are used instead of cylinders. The retrieved refractive index is then used to obtain the IOPs using cylinders this time. Using this method, the volume scattering function shows an averaged relative error of 16 %, im-proving the result obtained using spheres (22 %). Therefore, this result confirms that selecting a suitable shape is important for an improvement of the modelling (at least in
5
this ideal case).
To conclude, the results presented in Table 1 do not determine which is the best method to estimate phytoplankton optical properties but which one is more accurate when retrieving the refractive index of some ideal particles (such as homogeneous and coated spheres or cylinders). However, synthetic particles serve as a first
approxima-10
tion of actual phytoplankton and are useful to extract some preliminary conclusions. Most of the methods shown in the paper are used for the retrieval of the refractive indices of isolated particles or bulk oceanic distributions, and a comparison of their performance can only be done using well-known models. As it has been shown on each example, the Genetic Algorithm is a versatile technique that alone or combined
15
with other methods improve the accuracy of the estimations. However, it is not a fast technique, and several minutes are required for each estimation (when using spherical shapes; slower with aspherical particles) in front of the few seconds required by the other methods, being the Twardowski model the faster of them.
Further work must be done in order to study their performance when using the
op-20
tical properties of actual phytoplankton species and bulk oceanic measurements. New shapes may be required to improve the results, as for instance coated cylinders to model algae with a cylindrical shape (as stated by Bernard et al., 2009, in the spherical case, coated particles generate backscattering functions closer to those produced by actual phytoplankton particles) or other outlines more similar to the actual shape of
25
BGD
12, 18723–18768, 2015
Methods comparison to retrieve the refractive index of
small scatterers
A.-M. Sánchez and J. Piera
Title Page
Abstract Introduction
Conclusions References
Tables Figures
◭ ◮
◭ ◮
Back Close
Full Screen / Esc
Printer-friendly Version
Interactive Discussion
Discussion
P
a
per
|
Discussion
P
a
per
|
Discussion
P
a
per
|
Discussion
P
a
per
|
of the retrieval methods, and if they are not accurate, the retrieved refractive indices will not be as well. As stated by Ramírez-Pérez et al. (2015), the acceptance angle of the optical instruments affect severely on the amplitude of the measurements. By com-paring the extinction coefficient of two different instruments with different acceptance angles, different magnitude values were obtained, showing an averaged ratio of 0.67.
5
This is a key issue that must be considered and dealt in order to improve the faithful-ness of the whole methodology. Otherwise, the accuracy of the retrieval methods, as studied here, is useless.
6 Conclusions
A performance analysis was carried out in order to examine the accuracy of different
10
inverse methods that use the optical properties of small scatterers and their particle size distribution to retrieve their refractive indices. To this end, three different synthetic examples were contemplated, each one with a different shape and distribution. The se-lected shapes were homogeneous spheres, coated spheres and homogeneous cylin-ders. Results evidenced that those methods using a genetic algorithm to optimize the
15
inversion were the most accurate ones, but also the slowest. In particular, an excel-lent agreement between estimated and actual refractive indices and volume scattering functions was obtained for the homogeneous and coated sphere cases, and a fair agreement for the homogeneous cylinder. These results suggest that better character-izations could be obtained for the actual phytoplankton optical properties. Therefore,
20
next step is a further analysis of the performance of these methods when applied on measurements of isolated cultures of phytoplankton.
BGD
12, 18723–18768, 2015
Methods comparison to retrieve the refractive index of
small scatterers
A.-M. Sánchez and J. Piera
Title Page
Abstract Introduction
Conclusions References
Tables Figures
◭ ◮
◭ ◮
Back Close
Full Screen / Esc
Printer-friendly Version
Interactive Discussion
Discussion
P
a
per
|
Discussion
P
a
per
|
Discussion
P
a
per
|
Discussion
P
a
per
|
References
Aas, E.: Refractive index of phytoplankton derived from its metabolite composition, J. Plankton Res., 18, 2223–2249, 1996. 18725, 18737
Andrady, A.: Microplastics in the marine environment, Mar. Pollut. Bull., 62, 1596–1605, 2011. 18724
5
Bernard, S., Probyn, T., and Barlow, R.: Measured and modelled optical properties of particulate matter in the southern Benguela, S. Afr. J. Sci., 97, 410–420, 2001. 18725, 18732, 18737 Dutreuil, S., Bopp, L., and Tagliabue, A.: Impact of enhanced vertical mixing on marine
biogeo-chemistry: lessons for geo-engineering and natural variability, Biogeosciences Discuss., 6, 1–26, doi:10.5194/bgd-6-1-2009, 2009. 18725, 18732, 18733, 18735, 18736, 18737, 18738, 10
18739, 18740, 18741, 18745, 18746
Bhandarkar, S., Zhang, Y., and Potter, W.: An edge detection technique using genetic algorithm-based optimization, Pattern Recogn., 27, 1159–1180, 1994. 18735
Bohren, C. and Huffman, D. (Eds.): Absorption and Scattering of Light by Small Particles, Wiley, New York, Oxford, 1998. 18727, 18729, 18736, 18741
15
Boss, E., Pegau, W., Gardner, W., Zaneveld, J., Barnard, A., Twardowski, M., Chang, G., and Dickey, T.: Spectral particulate attenuation and particle size distribution in the bottom bound-ary layer of a continental shelf, J. Geophys. Res., 106, 9509–9516, 2001a. 18731
Boss, E., Twardowski, M., and Herring, S.: Shape of the particulate beam attenuation spectrum and its inversion to obtain the shape of the particulate size distribution, Appl. Optics, 40, 20
4885–4893, 2001b. 18731
Boss, E., Pegau, W., Lee, M., Twardowski, M., Shybanov, E., Korotaev, G., and Baratange, F.: Particulate backscattering ratio at LEO 15 and its use to study particles composition and distribution, J. Geophys. Res., 109, C01014, doi:10.1029/2002JC001514, 2004. 18731 Bricaud, A. and Morel, A.: Light attenuation and scattering by phytoplanktonic cells: a theoreti-25
cal modeling, Appl. Optics, 25, 571–580, 1986. 18725, 18729, 18731, 18737
Bricaud, A., Zaneveld, J., and Kitchen, J.: Backscattering efficiency of coccol-25 ithophorids: use of a three-layered sphere model, in: Ocean Optics XI Proc SPIE, San Diego, CA, 19 July, 27–33, 1992. 18733
Carder, K., Betzer, P., and Eggimann, D. W. (Eds.): Physical, chemical, and optical measures of 30
BGD
12, 18723–18768, 2015
Methods comparison to retrieve the refractive index of
small scatterers
A.-M. Sánchez and J. Piera
Title Page
Abstract Introduction
Conclusions References
Tables Figures
◭ ◮
◭ ◮
Back Close
Full Screen / Esc
Printer-friendly Version
Interactive Discussion
Discussion
P
a
per
|
Discussion
P
a
per
|
Discussion
P
a
per
|
Discussion
P
a
per
|
Clavano, W., Boss, E., and Karp-Boss, L.: Inherent optical properties of non-spherical marine-like particles – from theory to observation, Oceanogr. Mar. Biol., 45, 1–38, 2007. 18725, 18741
Cole, M., Lindeque, P., Halsband, C., and Galloway, T.: Microplastics as contaminants in the marine environment: a review, Mar. Pollut. Bull., 62, 2588–2597, 2011. 18724
5
Dall’Olmo, G., Westberry, T. K., Behrenfeld, M. J., Boss, E., and Slade, W. H.: Significant con-tribution of large particles to optical backscattering in the open ocean, Biogeosciences, 6, 947–967, doi:10.5194/bg-6-947-2009, 2009. 18741
Fortin, F., Rainville, F. D., Gardner, M., Parizeau, M., and Gagné, C.: DEAP: evolutionary algo-rithms made easy, Machine Learning Research, 13, 2171–2175, 2012. 18738
10
Greenhalgh, D. and Marshall, S.: Convergence criteria for genetic algorithms, J. Computing, 30, 269–282, 2000. 18734
Hale, G. and Querry, M.: Optical constants of water in the 200 nm to 200 µm wavelength region, Appl. Optics, 12, 555–563, 1973. 18730
Latimer, P.: Light scattering by a homogeneous sphere with radial projections, Appl. Optics, 23, 15
442–447, 1984. 18733
Mera, N., Elliott, L., and Ingham, D. B.: A multi-population genetic algorithm approach for solving ill-posed problems, Comput. Mech., 33, 254–262, 2004. 18735
Meyer, R.: Light-scattering from biological cells – dependence of backscatter radiation on mem-brane thickness and refractive index, Appl. Optics, 18, 585–588, 1979. 18725, 18732 20
Mischenko, M. and Travis, L.: Capabilities and limitations of a current Fortran implementation of theT Matrix method for randomly oriented, rotationally symmetric scatterers, J. Quant. Spectrosc. Ra., 60, 309–324, 1998. 18729, 18743
Mischenko, M., Travis, L., and Mackowski, D.:T Matrix computations of light scattering by non-spherical particles: a review, J. Quant. Spectrosc. Ra., 55, 535–575, 1996. 18727, 18729, 25
18742
Morel, A.: Diffusion de la lumière par les eaux de mer; résultats expérimentaux et approche théorique, in: Optics of the Sea, AGARD Lecture Ser., vol. 61, Advisory Group for Aeronau-tical Research and Development, NATO, Brussels, 3.1.1.–3.1.76, 1973. 18737
Mugnai, A. and Wiscombe, W.: Scattering from nonspherical Chebyshev particles. I: Cross sec-30
tions, single-scattering albedo, asymmetry factor, and backscattered fraction, Appl. Optics, 25, 1235–1244, 1986. 18729
BGD
12, 18723–18768, 2015
Methods comparison to retrieve the refractive index of
small scatterers
A.-M. Sánchez and J. Piera
Title Page
Abstract Introduction
Conclusions References
Tables Figures
◭ ◮
◭ ◮
Back Close
Full Screen / Esc
Printer-friendly Version
Interactive Discussion
Discussion
P
a
per
|
Discussion
P
a
per
|
Discussion
P
a
per
|
Discussion
P
a
per
|
Quirantes, A.: AT Matrix method and computer code for randomly oriented, axially symmetric coated scatterers, J. Quant. Spectrosc. Ra., 92, 373–381, 2005. 18739
Quirantes, A. and Bernard, S.: Light-scattering methods for modelling algal particles as a col-lection of coated and/or nonspherical scatterers, J. Quant. Spectrosc. Ra., 100, 315–324, 2006. 18725
5
Ramírez-Pérez, M., Röttgers, R., Torrecilla, E., and Piera, J.: Cost-effective hyperspectral trans-missometers for oceanographic applications: performance analysis, Sensors, 15, 20967– 20989, 2015. 18747
Sánchez, A., Zafra, E., and Piera, J.: Hyperspectral characterization of marine particles based on Mie–Lorentz and T Matrix codes and a genetic algorithm, in: IEEE Workshop on Hy-10
perspectral Image and Signal Processing: Evolution in Remote Sensing (WHISPERS), Lau-sanne, Switzerland, 24–27 June 2014. 18725, 18733
Stramski, D., Morel, A., and Bricaud, A.: Modeling the light attenuation and scattering by spheri-cal phytoplanktonic cells: a retrieval of the bulk refractive index, Appl. Optics, 27, 3954–3956, 1988. 18725, 18731
15
Stramski, D., Bricaud, A., and Morel, A.: Modeling the inherent optical properties of the ocean based on the detailed composition of the planktonic community, Appl. Optics, 40, 2929–2945, 2001. 18725, 18736
Stramski, D., Boss, E., Bogucki, D., and Voss, K.: The role of seawater constituents in light backscattering in the ocean, Prog. Oceanogr., 61, 27–56, 2004. 18741
20
Twardowski, M., Boss, E., Macdonald, J., Pegau, W., Barnard, A., and Zaneveld, J.: A model for estimating bulk refractive index from the optical backscattering ratio and the implications for understanding particle composition in case I and case II waters, Geophys. Res. Oceans, 106, 14129–14142, 2001. 18725, 18729, 18730, 18731, 18736, 18756
van de Hulst, H. (ed.): Ligh Scattering by Small Particles, Wiley, New York, Oxford, 1957. 18730, 25
18731, 18732, 18737
Volz, F.: Die Optik und Meteorologie der Atmosphärishen Trübung, Ber. Dtsch. Wetterdienstes, 13, 1–47, 1954. 18730
Wiscombe, W. and Grams, G.: The backscatered fraction in two-stream approximations, J. Atmos. Sci., 33, 2440–2451, 1976. 18729
30
BGD
12, 18723–18768, 2015
Methods comparison to retrieve the refractive index of
small scatterers
A.-M. Sánchez and J. Piera
Title Page
Abstract Introduction
Conclusions References
Tables Figures
◭ ◮
◭ ◮
Back Close
Full Screen / Esc
Printer-friendly Version
Interactive Discussion
Discussion
P
a
per
|
Discussion
P
a
per
|
Discussion
P
a
per
|
Discussion
P
a
per
|