www.atmos-chem-phys.net/12/8491/2012/ doi:10.5194/acp-12-8491-2012
© Author(s) 2012. CC Attribution 3.0 License.
Chemistry
and Physics
Systematic variations of cloud top temperature and precipitation
rate with aerosols over the global tropics
Feng Niu1,2and Zhanqing Li1,2
1State Key Laboratory of Earth Surface Processes and Resource Ecology, GCESS, Beijing Normal University, Beijing 100875, China
2Dept. of Atmospheric and Oceanic Sciences & Earth System Science Interdisciplinary Center, University of Maryland, College Park, MD 20740, USA
Correspondence to:Z. Li ([email protected])
Received: 5 January 2011 – Published in Atmos. Chem. Phys. Discuss.: 10 February 2011 Revised: 23 July 2012 – Accepted: 8 August 2012 – Published: 21 September 2012
Abstract.Aerosols may modify cloud properties and precip-itation via a variety of mechanisms with varying and con-tradicting consequences. Using a large ensemble of satellite data acquired by the Moderate Resolution Imaging Spec-troradiometer onboard the Earth Observing System’s Aqua platform, the CloudSat cloud profiling radar and the Cloud-Aerosol Lidar and Infrared Pathfinder Satellite Observations (CALIPSO) satellite over the tropical oceans, we identified two distinct correlations of clouds and precipitation with aerosol loading. Cloud-top temperatures are significantly negatively correlated with increasing aerosol index (AI) over oceans and aerosol optical depth (AOT) over land for deep mixed-phase clouds with liquid droplets near the warm bases and ice crystals near the cold tops; no significant changes were found for uniformly liquid clouds. Precipitation rates are positively correlated with the AI for mixed-phase clouds, but negatively correlated for liquid clouds. These distinct cor-relations might be a manifestation of two potential mech-anisms: the invigoration effect (which enhances convection and precipitation) and the microphysical effect (which sup-presses precipitation). We note that the highly limited in-formation garnered from satellite products cannot unequiv-ocally support the causal relationships between cloud-top temperature/precipitation rate and aerosol loading. But if aerosols are indeed the causes for the observed relationships, they may change the overall distribution of precipitation, leading to a more extreme and unfavorable rainfall pattern of suppressing light rains and fostering heavy rains.
1 Introduction
Many studies have shown that aerosols suppress rainfall through indirect effects (Squires, 1958; Albrecht, 1989; Rosenfeld, 2000). On the other hand, several recent stud-ies suggested that the suppression of warm rain by aerosols may allow more cloud particles to ascend above the freezing level, initiating an ice process in which more latent heat is released thus invigorating convection (Andreae et al., 2004; Khain et al., 2005; Lin et al., 2006; Bell et al., 2008; Koren et al., 2005). The opposite effects of suppression and invigora-tion of precipitainvigora-tion by aerosols are also supported by mod-eling studies (Tao et al., 2007; Khain et al., 2005; Lee et al., 2010). A further study of the invigoration effect using a par-cel model suggests that this effect exists when ice processes are involved and is much stronger for clouds with warm bases because cloud particles have longer distances to grow before freezing (Rosenfeld et al., 2008). However, the lack of full cloud geometry information in these studies, i.e. cloud top and base heights, makes it difficult to investigate this effect, especially if cloud phase and base height are concerned. This can be further complicated by warm rain processes for which aerosols are generally known to suppress precipitation (Gunn and Phillips, 1957; Albrecht, 1989; Rosenfeld, 1999).
8492 F. Niu and Z. Li: Changes of cloud top and precipitation rate with aerosol loading
Table 1.Summary of satellite and model datasets employed in this study.
Geophysical Parameter Product Sensor Spatial Resolution
AOT MYD08 MODIS 1 × 1 degree
Cloud Geometry 2B-GEOPROF-LIDAR CloudSat and CALIPSO Horizontal: 1.4 km × 2.5 km Vertical:∼250 m
Cloud Ice Water 2B-CWC CloudSat 1.4 km × 2.5 km
Column Water Vapor ECMWF-AUX N/A 1.4 km × 2.5 km
Atmospheric Temperature Profiles ECMWF-AUX N/A 1.4 km × 2.5 km
Precipitation Rate 2C-PRECIP-COLUMN CloudSat 1.4 km × 2.5 km
Table 2.Definitions of warm and cold base mixed-phase clouds and
liquid clouds in this study.
Deep Shallow
mixed-phase mixed-phase
clouds with clouds with Liquid
warm bases cold basesclouds
Cloud base temperature >15◦C 0–15◦C >0◦C
Cloud top temperature <−4◦C <−4◦C >0◦C
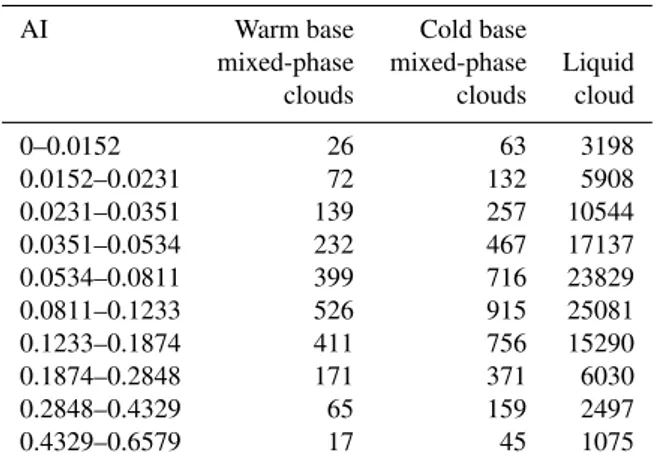
Table 3.Sample sizes for the data points in Fig. 1a and b.
AI Warm base Cold base
mixed-phase mixed-phase Liquid clouds clouds cloud 0–0.0152 26 63 3198 0.0152–0.0231 72 132 5908 0.0231–0.0351 139 257 10544 0.0351–0.0534 232 467 17137 0.0534–0.0811 399 716 23829 0.0811–0.1233 526 915 25081 0.1233–0.1874 411 756 15290 0.1874–0.2848 171 371 6030 0.2848–0.4329 65 159 2497 0.4329–0.6579 17 45 1075
aerosols than any other ground observations (Li et al., 2011). A-Train satellite active and passive sensors also provide an unprecedented amount of data on a global scale that may also help tackle complicated problems such as cloud geometry, rainfall, and aerosol attributes.
In this study, we perform a statistical analysis by first clas-sifying clouds according to their top and base heights as de-tected by space-borne active sensors, and then investigate if they have any dependence on the aerosol index (AI) or aerosol optical thickness (AOT) retrievals from a passive sen-sor aboard the A-Train constellation. We show that clouds and precipitation are correlated well with aerosol loading dif-ferently for different types of clouds. The probability of rain occurrence is also different under relatively clean and pol-luted atmospheric conditions.
Table 4.Sample sizes for the data points in Fig. 1c and d.
AOT Warm base Cold base
mixed-phase mixed-phase Liquid clouds clouds cloud 0.0–0.1 353 599 5586 0.1–0.2 814 1513 7277 0.2–0.3 612 1294 4283 0.3–0.4 340 806 2464 0.4–0.5 186 499 1443 0.5–0.6 81 298 951
2 Data and methodology
Satellite products employed in this study include one year’s worth (2007) of observations from CloudSat and Cloud-Aerosol Lidar and Infrared Pathfinder Satellite Observations (CALIPSO) as well as from the Aqua/MODerate resolution Imaging Spectroradiometer (MODIS) over the tropical re-gion extending from 20◦N to 20◦S. MODIS products
in-clude Level 3 AOT at 550 nm and the Angstrom exponent (Kaufman et al., 1997; Remer et al., 2005). Level 3 products were generated by averaging the daily Level 2 data with a resolution of 10 km to 1◦× 1◦grids. The validation of Level
2 aerosol products with ground-based observations shows good agreement (Li et al., 2007; Mi et al., 2007; Levy et al., 2007, 2010). CloudSat/CALIPSO products include cloud bases and top heights, cloud ice water paths, and precipita-tion rates (Stephens et al., 2002; Haynes et al., 2009). Atmo-spheric state variables from the ECMWF-AUX data set are interpolated to each CloudSat pixel and cloud profiling radar (CPR) bin. Variables include atmospheric pressure, temper-ature, and specific humidity at each level. These data are used to convert cloud top and base heights to cloud top and base temperatures. The column water vapor and lower tropo-spheric static stability (LTSS), defined as the potential tem-perature difference between the surface and the 700 hPa pres-sure level (Klein and Hartmann, 1993), are calculated from this data set to constrain meteorological conditions. These products are summarized in Table 1.
CloudSat takes measurements at the nadir, so the “cur-tain” of CloudSat data is averaged over 1◦× 1◦ grid boxes
Fig. 1.Cloud-top temperature(A, C)and ice water path(B, D)as functions of AI/AOT for warm (blue dots) and cold (red dots) base mixed-phase clouds and liquid clouds (green dots) over ocean (upper panels ) and land (lower panels). The right-hand axes of(A)and(C)are for liquid clouds. The AI is plotted using a logarithmic scale. Linear regressions were performed on the averaged values of each bin.R2andP
are the correlation coefficient and significance level according to a t-test for each type of clouds, respectively.
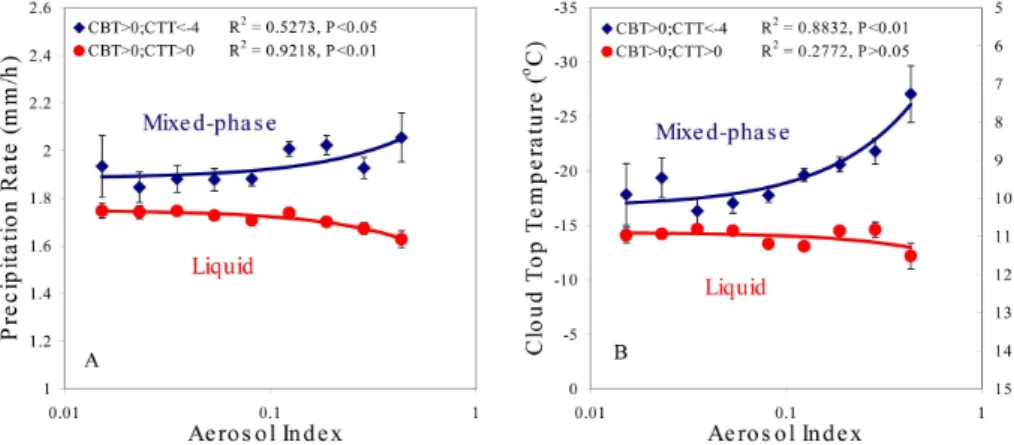
Fig. 2.Precipitation rate(A)and corresponding cloud-top temperature(B)as functions of AI for mixed-phase (blue dots) and liquid clouds
(red dots) over the ocean. Note that only clouds with precipitation rates greater than 1 mm h−1are included here. The right-hand y-axis of
8494 F. Niu and Z. Li: Changes of cloud top and precipitation rate with aerosol loading
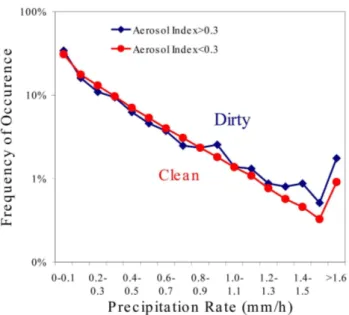
Fig. 3.Frequency of occurrence of different precipitation rates
un-der relatively clean and polluted atmospheric conditions.
aerosol indirect studies, it is essential to obtain both cloud and aerosol parameters within a certain proximity so that interactions are possible. Due to the inherent limitation of satellite remote sensing, the separation distance must not be too short because cloud contamination may occur or too few samples are collected. This is why we did not use the higher resolution Level 2 AOT product. Level 3 data have less cloud contamination but we need to assume that AOT retrievals up to 100 km are well correlated, if not the same. Since the re-gion of our study is the entire tropics of 20◦S–20◦N, we are
concerned primarily with large-scale aerosol episodes whose de-correlation length should be rather long, at least much longer than the scales of convective clouds that are most abundant in this zonal band.
Grids with AOT>0.6 are excluded in our study to fur-ther reduce the possibility of cloud contamination in AOT retrievals. Cloud top and base heights at the original resolu-tion are converted to temperatures using temperature profiles from the ECMWF-AUX product. This information is used to define different cloud types: deep mixed-phase clouds with cloud-base temperatures (CBT)>15◦C and cloud-top
tem-peratures (CTT)<−4◦C, shallow mixed-phase clouds with CBT in the range of 0–15◦C and CTT<
−4◦C, and pure liquid clouds with CBT>0◦C and CTT>0◦C. Note that
these criteria are consistent with those used in the ground-based study of Li et al. (2011). Only single-layer clouds de-tected by the CloudSat are chosen here. Table 2 summarizes the cloud types under study.
The AI, which is a product of AOT and the aerosol Angstrom exponent, is binned and the dependencies of av-eraged cloud properties in each bin on the AI are examined over the ocean. AI serves a better proxy for cloud
conden-sation nuclei (CCN) than the AOT (Nakajima et al., 2001; Feingold et al., 2006). How the precipitation rate and its dis-tribution change with AI is also examined. Over land, AOT is used instead of AI because the Angstrom exponent retrieved from MODIS over land is much less reliable than over oceans (Levy et al., 2010). Tests on the dependencies of LTSS and column water vapor on AI or AOT are also done over both land and ocean.
Untangling meteorological influences from aerosol effects using observational data is always a daunting task, espe-cially for satellite-based studies. One way to reduce the in-fluence of meteorological factors is to fix their variability when analyzing the relationship between clouds and precipi-tation with aerosols. However, only column-averaged, large-scale quantities were available for this investigation (shown in Tables 3 and 4), the relatively small sample sizes for warm base mixed-phase clouds do not allow for more detailed con-straints on cloud water or other conditions. Therefore, we tried to lessen/remove the influences of meteorological con-ditions by analyzing them within fixed ranges of AOT.
3 Results
Figure 1 shows correlations of the cloud-top temperature and ice water path with AI over oceans and AOT over land for dif-ferent cloud types as defined in Table 2. The CTT for mixed-phase clouds with warm bases is highly negatively correlated with AI, whereas the CTT for liquid cloud does not show a significant correlation with AI. The results for mixed-phase clouds with cold bases lie somewhere in-between. The ice water path (IWP) is positively correlated with AI for mixed-phase clouds. Similar results are obtained over land using AOT instead of AI (bottom panels of Fig. 1). Note that a logarithmic scale is used on the abscissa in the top panels. The sample sizes for the points in Fig. 1a and c are shown in Tables 3 and 4. These satellite-based findings are consistent with those found from the analysis of a 10-yr set of extensive ground-based Atmospheric Radiation Measurements (ARM) data over the US South Great Plains (Li et al., 2011), as well as with those in other regions (Koren et al., 2005; Andreae et al., 2004). According to the theory of Rosenfeld et al. (2008), the aerosol invigoration effect is more significant for mixed-phase clouds with warm bases than those with cold bases because the former generate more latent heat which can fuel cloud convection into higher altitudes.
Previous studies (Khain et al., 2005; Lin et al., 2006) sug-gest that deeper clouds and enhanced ice processes under polluted conditions can lead to enhanced rainfall, which is examined here by studying the correlation between AI and precipitation rates inferred from CloudSat radar measure-ments.
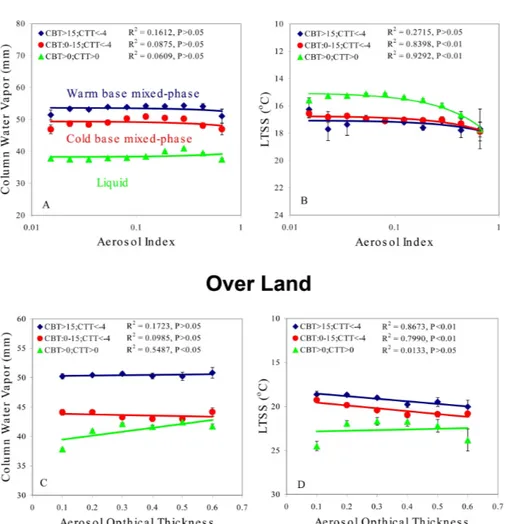
Fig. 4.Column water vapor(A, C)and LTSS(B, D)as a function of AI over the ocean (upper panels) and AOT over land (lower panels) for warm (blue dots) and cold (red dots) base mixed-phase clouds and liquid clouds (green dots). LTSS is plotted in descending order; smaller values (top part of the y-axis) indicate a more unstable atmosphere.
than 1mm h−1are studied here. If the aerosol invigoration
ef-fect exists, it would be most significant for deep clouds which favor the production of heavy rain (Rosenfeld et al., 2008). To increase the sample size, only two types of clouds are dif-ferentiated here: mixed-phase and liquid clouds, regardless of cloud-base heights. Results show a positive correlation be-tween precipitation rate and AI for mixed-phase clouds, but a negative correlation for liquid clouds. Again, this finding is virtually the same as that from our ground-based study (Li et al., 2011) which suggested that aerosols enhance precipita-tion from mixed-phase clouds by inducing stronger convec-tion, but suppress precipitation from liquid clouds because of the microphysical effect that reduces cloud particle size and thus precipitation rate.
In reality, precipitation may remove aerosols through the scavenging effect, which could lead to a false aerosol ef-fect on the precipitation rate. If aerosols and precipitation are measured simultaneously, there may exist a scavenging
8496 F. Niu and Z. Li: Changes of cloud top and precipitation rate with aerosol loading
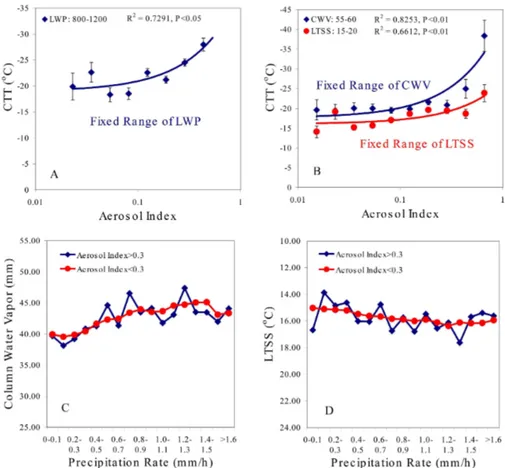
Fig. 5.Correlations between cloud-top temperature and AI under fixed ranges of LWP(A), CWV and LTSS(B)for warm base
mixed-phase clouds. The panels(C)and(D)show CWV and LTSS as functions of precipitation rate for polluted (AI>0.3) and clean (AI<0.3) atmospheric conditions.
As shown in Fig. 2, the precipitation rate is positively cor-related with the AI for mixed-phase clouds, but negatively correlated with the AI for liquid clouds. This reversal in cor-relation cannot be explained by the scavenging effect, which would exhibit a ubiquitous negative correlation. The oppo-site behaviors do, however, agree with two dominant mech-anisms proposed in many earlier studies, namely, the sup-pression of warm cloud/rain (Albrecht, 1989; Andreae et al., 2004). Nevertheless, they do not prove, but suggest the causal effects, given the limited amount of satellite data available. If the correlations are the manifestation of causal relation-ships, they can explain the overall distribution of the pre-cipitation frequency as a function of prepre-cipitation rate un-der two distinct aerosol indices, as shown in Fig. 3. Unun-der polluted environments (AI>0.3), heavy rains (high precip-itation rates) occur much more frequently than under clean conditions (AI<0.3). Conversely, light rains (low precipita-tion rates) are more likely to occur under cleaner condiprecipita-tions than under polluted ones.
Cloud formation is greatly influenced by changes in at-mospheric stability and cloud-scale relative humidity. To study the likelihood of aerosol serving as a proxy of any of these two atmospheric variables, the correlation between
two atmospheric parameters (column water vapor (CWV) and LTSS) and AI/AOT was examined and results are pre-sented in Fig. 4. It shows that that the average column water vapor and LTSS are similar for different AI and AOT bins in many cases, although there is a systematic correlation for column water vapor and AOT over land for liquid clouds, and some co-variations of AI and AOT with LTSS. For mixed-phase clouds over oceans (red and blue curves), CWV and LTSS are generally invariant with respect to the AI or to the AOT. The two meteorological variables are thus unable to explain the changes in cloud-top temperature or precipita-tion rate shown in Fig. 2. For mixed-phase clouds over land, LTSS is positively correlated with AOT, which means that the atmosphere becomes more stable as AOT increases. Clouds tend to develop higher in the atmosphere under unstable con-ditions, therefore, the positive correlation between LTSS and AOT cannot explain the decrease in cloud-top temperature with increasing AOT. This is not surprising given that the LTSS is computed using large-scale variables that seem un-affected by the aerosol invigoration effect.
base mixed-phase clouds, as shown in Fig. 5. LWP, CWV and LTSS fall within the ranges of 800–1200 g cm−2, 55–
60 mm and 15–20◦C, respectively. Previously observed
rela-tionships still exist, providing more support to the idea that meteorological factors are not the dominant reason for the correlations between CTT and aerosols, as shown in Fig. 1.
Tests on CWV and LTSS under clean and polluted condi-tions were also conducted but no systematic differences were found, as shown in Fig. 5c and d. These tests do not support the premise that the change in the precipitation rate distri-bution is caused by systematic differences in the large-scale integral meteorological quantities investigated.
4 Concluding remarks
Strong but conditional correlations of cloud-top tempera-ture/height, cloud ice water path, and precipitation rate with the AI and AOT are observed from one year’s worth of satellite data acquired by multiple sensors aboard the EOS Aqua platform over the global tropical regions. Results show that cloud-top temperatures are negatively correlated with AI over the ocean (or AOT over land) for deep mixed-phase clouds of warm bases and cold tops. Cloud ice water path is positively correlated with AI/AOT for mixed-phase clouds. The precipitation rate is positively correlated with the AI for mixed-phase clouds, but negatively correlated with the AI for liquid clouds.
The above findings are all consistent with those from our ground-based study making use of a 10-yr dataset of high-quality and extensive measurements collected at the ARM Southern Great Plains site (Li et al., 2011). It pointed to two prominent mechanisms: the aerosol invigoration effect and the microphysical effect, although the current study does not any direct evidence of causal relationships due to the in-herent limitations of the satellite products. It was hypothe-sized theoretically (Rosenfeld et al., 2008) that the invigo-ration effect is stronger for mixed-phase clouds with warm bases than with cold bases due to the fact that cloud parti-cles in clouds with warmer bases have more opportunities to grow before freezing. If more liquid water is frozen, more latent heat is released. This effect may lead to faster decreas-ing rates of cloud-top temperatures with AI/AOT for clouds with warm bases than those with cold bases as observed in Fig. 1. For liquid clouds, the dearth of ice processes does not result in any significant invigoration, and precipitation from these clouds is most likely suppressed due to the aerosol mi-crophysical effect. Tests on the dependencies of column wa-ter vapor and LTSS on AI/AOT show that the above results cannot be explained by any changes in meteorological condi-tions. The correlation study as presented here alone, however, cannot lead to an affirmative conclusion that these findings are the evidence of these two aerosol effects. The fact that all the findings presented here are in good agreement with those from ground-based long-term data, and the fact that
they can be simulated with a cloud resolving model, lend us some confidence on the aforementioned explanations.
The findings reported here, if they are truly caused by aerosols, may have great implications for studying both the Earth’s radiation budget and the global hydrological cycle. Smaller cloud particles caused by higher aerosol loading re-flect more solar radiation and result in negative forcing at the top of the atmosphere (the Twomey effect). However, this effect can be compensated by changes in the overall distribu-tion of cloud geometries. Clouds with higher tops, which oc-cur more frequently under polluted atmospheric conditions, emit less longwave radiation than do clouds with lower tops, leading to a warming instead of a cooling effect (Koren et al., 2010). The suppression and enhancement of precipita-tion from shallow and deep clouds changes the overall distri-bution of precipitation rates. Heavy rain becomes more fre-quent and light rain becomes less frefre-quent under polluted conditions than under cleaner conditions. This change could have a very large impact on the hydrological cycle, leading to more frequent flooding or drought events under a polluted environment.
Acknowledgements. This study is supported by the MOST (2013CB955800) and DOE (DESC0007171). The authors are grateful to K.-H. Lee for his help in analyzing the satellite data and Maureen Cribb for the editorial work.
Edited by: P. Stier
References
Albrecht, B. A.: Aerosols, cloud microphysics and fractional cloudiness, Science, 245, 1227–1230, 1989.
Andreae, M. O., Rosenfeld, D., Artaxo, P., Costa, A. A., Frank, G. P., Longo, K. M., and Silva-Dias, M. A. F.: Smoking rain clouds over the Amazon, Science, 303, 1337–1342, 2004.
Andronache, C.: Estimated variability of below-cloud aerosol re-moval by rainfall for observed aerosol size distributions, Atmos. Chem. Phys., 3, 131–143, doi:10.5194/acp-3-131-2003, 2003. Bell, T. L., Rosenfeld, D., Kim, K.-M., Yoo, J.-M., Lee, M.-I., and
Hahnenberger, M.: Midweek increase in U.S. summer rain and storm heights suggests air pollution invigorates rainstorms, J. Geophys. Res., 113, D02209, doi:10.1029/2007JD008623, 2008. Feingold, G., Furrer, R., Pilewskie, P., Remer, L. A., Min, Q., and Jonsson, H.: Aerosol indirect effect studies at Southern Great Plains during the May 2003 intensive operations period, J. Geo-phys. Res., 111, D05S14, doi:10.1029/2004JD005648, 2006. Gunn, R. and Phillips, B. B.: An experimental investigation of the
effect of air pollution on the initiation of rain, J. Meteorol., 14, 272–280, 1957.
8498 F. Niu and Z. Li: Changes of cloud top and precipitation rate with aerosol loading
Jennings, S. G., Harrison, R. M., and Van Grieken, R. (Eds): Wet processes affecting atmospheric aerosols, John Wiley & Sons publisher, 1998.
Kaufman, Y. J., Tanr´e, D., Remer, L. A., Vermote, E. F., Chu, A., and Holben, B. N.: Operational remote sensing of tropospheric aerosol over land from EOS moderate resolution imaging spec-troradiometer, J. Geophys. Res., 102, 17051–17067, 1997. Khain, A., Rosenfeld, D., and Pokrovsky, A.: Aerosol impact on the
dynamics and microphysics of deep convective clouds, Q. J. Roy. Meteorol. Soc., 131, 1–25, 2005.
Klein, S. A. and Hartmann, D. L.: The seasonal cycle of low strati-form clouds, J. Clim., 6, 1587–1606, 1993.
Koren, I., Kaufman, Y. J., Resonfeld, D., Remer, L. A., and Rudich, Y.: Aerosol invigoration and restructuring of Alantic convctive clouds, Geophys. Res. Lett., 32, L14828, doi:10.1029/2005GL023187, 2005.
Koren, I., Remer, L. A., Altaratz, O., Martins, J. V., and Davidi, A.: Aerosol-induced changes of convective cloud anvils produce strong climate warming, Atmos. Chem. Phys., 10, 5001–5010, doi:10.5194/acp-10-5001-2010, 2010.
Lee, S. S., Donner, L. J., and Penner, J. E.: Thunderstorm and stra-tocumulus: how does their contrasting morphology affect their interactions with aerosols?, Atmos. Chem. Phys., 10, 6819–6837, doi:10.5194/acp-10-6819-2010, 2010.
Levy, R. C., Remer, L. A., Mattoo, S., Vermote, E. F., and Kauf-man, Y. J.: Second-generation operational algorithm: Retrieval of aerosol properties over land from inversion of Moderate Resolu-tion Imaging Spectroradiometer spectral reflectance, J. Geophys. Res., 112, D13211, doi:10.1029/2006JD007811, 2007.
Levy, R. C., Remer, L. A., Kleidman, R. G., Mattoo, S., Ichoku, C., Kahn, R., and Eck, T. F.: Global evaluation of the Collection 5 MODIS dark-target aerosol products over land, Atmos. Chem. Phys., 10, 10399–10420, doi:10.5194/acp-10-10399-2010, 2010. Li, Z., Niu, F., Lee, K.-H., Xin, J., Hao, W.-M., Nordgren, B., Wang, Y., and Wang, P.: Validation and understanding of MODIS aerosol products using ground-based measurements from the handheld sunphotometer network in China, J. Geophy. Res., 112, D22S07, doi:10.1029/2007JD008479, 2007.
Li, Z., Niu, F., Fan, J., Liu, Y., Rosenfeld, D., and Ding, Y.: The long-term impacts of aerosols on the vertical develop-ment of clouds and precipitation, Nature-Geosci., 4, 888–894, doi:10.1038/NGEO1313, 2011.
Lin, J. C., Matsui, T., Pielke Sr., R. A., and Kummerow, C.: Effects of biomass-burning-derived aerosols on precipitation and clouds in the Amazon Basin: a satellite-based empirical study, J. Geo-phys. Res., 111, D19204, doi:10.1029/2005JD006884, 2006. Mi, W., Li, Z., Xia, X., Holben, B., Levy, R., Zhao, F., Chen, H.,
and Cribb, M.: Evaluation of the Moderate Resolution Imag-ing Spectroradiometer aerosol products at two Aerosol Robotic Network stations in China, J. Geophys. Res., 112, D22S08, doi:10.1029/2007JD008474, 2007.
Nakajima, T., Higurashi, A., Kawamoto, K., and Penner, J. E.: A possible correlation between satellite-derived cloud and aerosol microphysical parameters, Geophys. Res. Lett., 28, 1171–1174, doi:10.1029/2000GL012186, 2001.
Radke, L. F., Hobbs, P. V., and Eltgroth, M. W.: Scavenging of aerosol particles by precipitation. J. Appl. Meteorol., 19, 715– 722, 1980.
Remer, L. A., Kaufman, Y. J., Tanre, D., Mattoo, S., Chu, D. A., Martins, J. V., Li, R-R., Ichoku, C., Levy, R. C., Kleidman, R. G., Eck, T. F., Vermote, E., and Holben, B. N.: The MODIS aerosol algorithm, products and validation, J. Atmos. Sci., 62, 947–973, 2005.
Rosenfeld, D.: TRMM observed first direct evidence of smoke from forest fires inhibiting rainfall, Geophys. Res. Lett., 26, 3105– 3108, 1999.
Rosenfeld, D.: Suppression of rain and snow by urban and industrial air pollution, Science, 287, 1793–1796, 2000.
Rosenfeld, D., Lohmann, U., Raga, G. B., O’Dowd, C. D., Kulmala, M., Fuzzi, S., Reissell, A., and Andreae, M. O.: Flood or drought: How do aerosols affect precipitation?, Science, 321, 1309–1313, 2008.
Squires, P.: The microstructure and colloidal stability of warm clouds. I. The relation between structure and stability. Tellus 10, 256–271, 1958.
Stephens, G. L., and the CloudSat Science Team: The CloudSat mission and the A-train. A new dimension of space observations of clouds and precipitation, B. Am. Meteorol. Soc., 83, 1771– 1790, doi:10.1175/BAMS-83-12-1771, 2002.