1Department of Geography, Universidade do Estado do Rio de Janeiro, Rio de Janeiro (RJ), Braszil. E-mail: [email protected]
2Department of Geology, Universidade Federal Fluminense, Niterói (RJ), Brazil. E-mail: [email protected]; [email protected]; [email protected]
*Corresponding author
Manuscrito ID: 30084. Submetido em: 09/02/2014. Aceito em: 13/05/2014. AbstrAct: he coastal geomorphology of Maricá (Rio de Janeiro state) is characterized by a large lagoon and by two sandy barriers that conine a series of small isolated chain-like lagoons. Data collected from ground-penetrating radar and boreholes from the central coas-tal plain of Maricá provided information on the sedimentary archi-tecture and evolution of this area in the Quaternary. Six lithological units were identiied comprising three depositional sequences limited by erosional surfaces, related to barrier–lagoon systems that migrated onshore, ofshore, and longshore, giving rise to a sedimentary deposit 25 m thick or more. he data reveal a retrograding barrier overlying a basal mud unit which rests in unconformity upon Precambrian basement, thus characterizing an important Pleistocene transgres-sion. A second Pleistocene barrier of 45,000 cal years BP migrated over a lagoonal mud unit (48,000–45,000 cal years BP) reaching over the previous barrier. A progradational phase followed due to a fall of sea level. A long interval of erosion of the barrier created an unconformity that represents the Pleistocene–Holocene boundary. A beachrock in nearby Itaipuaçu, 100 m ofshore from the present-day beach, dated as 8,500 cal years BP marks the onset of Holocene sedimentation due to gradually rising sea level, which continued un-til at about 5,000 years ago. his promoted the retrogradation of the barrier–lagoon system. A brief episode of progradation is observed as a series of paleobeach scarps. Today’s rising sea level is causing the retrogradation of the barrier.
KEYWOrDs: Quaternary; barrier–lagoon systems; ground-penetrating radar; sea-level change; radiocarbon ages; southeast Brazil.
rEsUMO: A geomorfologia costeira de Maricá (estado do Rio de Janeiro) é caracterizada por uma imponente lagoa e por duas barreiras arenosas que coninam uma série de pequenas lagunas isoladas e colmatadas. Dados de georadar (GPR) e sondagens realizadas na área provém informações sobre sua arquitetura sedimentar e evolução no Quaternário. Os resultados indicam a existência de seis unidades litológicas compondo três sequências deposicionais limitadas por superfícies erosivas, relacionadas a sistemas barreira-laguna que migraram para o continente, para o mar e lateralmente, formando um de-pósito sedimentar de 25 metros ou mais de espessura. Há evidências de uma barreira retrogradante sobre uma unidade lamosa basal, que se formou sobre uma superfície erosiva representada pelo topo do embasamento Pré-Cambri-ano, apontando uma importante transgressão no Pleistoceno. Uma segunda barreira, formada há cerca de 45.000 anos cal A.P., migrou sobre uma uni-dade lamosa lagunar (48.000–45.000 anos cal A.P.) alcançando a barreira anterior. A seguir, uma fase de progradação ocorre em resposta a um rebaix-amento do nível do mar. Um longo período de erosão da barreira resulta em uma discordância representando o limite entre Pleistoceno e Holoceno. O arenito de praia em Itaipuaçu, submerso a cerca de 100 metros da linha de praia atual, datado em 8.500 anos cal A.P., marca o início da sedimentação holocênica devido ao aumento gradual do nível do mar até 5.000 anos atrás. Este evento promoveu a retrogradação do sistema barreira-laguna. Um breve episódio de progradação é observado através de uma série de paleoescarpas de tempestades. Atualmente, uma elevação do nível do mar tem causado a retrogradação da barreira.
Palavras-chave: Quaternário; sistemas barreira-laguna; georadar; mudanças do nível do mar; idades do radiocarbono; sudeste do Brasil.
Sedimentary architecture and depositional
evolution of the Quaternary coastal plain
of Maricá, Rio de Janeiro, Brazil
Arquitetura sedimentar e evolução deposicional no Quaternário
da planície costeira de Maricá, Rio de Janeiro, Brasil
INtrODUctION
Understanding the evolution of the barrier–lagoon sys-tems is important for coastal planning and management projects so crucial for rapidly developing areas. he com-plex interaction between diferent coastal processes, such as coastal dynamics and sea-level changes, can be better understood as consequence of them. Barriers are the sites of some of the world’s most beautiful beaches. hey may represent some of the most expensive real estate in many countries due to their development by the resort indus-try and because many people wish to live next to the sea. hey form due to the combined action of wind, waves, and longshore currents, whereby these strips of land are but a few to several meters above sea level and they pro-tect the mainland from the forces of the sea, particularly storms. Barriers are prominent depositional features of many coasts, and similar sandstone bodies are represented in the stratigraphic record and may become important res-ervoirs for water, gas, and oil. he external geometry, dis-tribution, nature of facies, and associations are variables in this setting and depend on sediment supply, relative sea-level changes, and other aspects of the history of indi-vidual examples. A useful approach is to identify major facies, determine their lateral distribution and relation-ships, and use available information on local and regional settings for interpretation (McCubbin 1982; Davis Jr. & Fitzgerald 2004; Clifton 2006).
The well-established models proposed by Kraft and Chrzastowski (1985) to explain the evolution of barrier– lagoon systems are here applied for the understanding of Maricá coastal plain (Rio de Janeiro, Brazil) (Fig. 1). hese models represent starting points for understanding ancient coastal records, the geochronological evolution of a coast, correlation of coastal records, and regressive and trans-gressive sea-level events. Records formed by coastal progra-dation are better understood and many examples have been recognized compared to records formed by retrogradation of a shoreline due to a transgressive event. he low preserva-tion potential of these regressive sand bodies, formed during sea-level rise, makes the understanding of such events and geological records more complex (Friedmam & Sanders 1978; McCubbin 1982; Kraft & Chrzastowski 1985; Davis & Fitzgerald 2004; Clifton 2006). Such is the case for the Maricá coastal plain, where measurements have indicated a landward migration of the barrier of about 15 m for the past 30 years (Lins-de-Barros 2005; Silva et al. 2008b).
Ground-penetrating radar (GPR) provides high-reso-lution images of the shallow stratigraphy with much more detail and continuity than previous methods. he appli-cation of GPR became a common practice in many parts
of the world from the 1970s onwards (Neal 2004) and in Brazil mainly during the last decade. In this work, GPR has been used to map the almost unknown sedimentary depos-its and architecture of the Quaternary barrier–lagoon sys-tems. Boreholes were fundamental in identifying the sedi-mentary units and sequences as well as in providing samples for radiocarbon dates.
he APA Maricá, part of Rio de Janeiro coast (Fig. 1), is an environmental protection area and, thus, is relatively well preserved as compared to extensively urbanized coastal areas of Rio de Janeiro state. Nevertheless, illegal sand mining has been destroying the local vegetation and landscape, and there is an increasing population concentration in nearby areas mainly due to the construction of an oil reinery not far away. Despite this, the well-preserved barriers are suit-able for the GPR working.
his article provides information about the sedimentary architecture and the stages of evolution of the Maricá coastal plain (Rio de Janeiro, Brazil) in the Quaternary (Fig. 1). It is based on a research accomplished by integrating data from GPR and boreholes in addition to sediment analysis and radiocarbon dates.
stUDY ArEA
he study area corresponds to APA Maricá, located in the central coastal plain near the town of Maricá (Fig. 1). he area is about 8 km long and 1 km wide in average, extending from the Costa and São Bento channels to an intermittent breaching on the barrier (near Barra de Maricá) towards the east. he study area is limited by the Maricá lagoon to the north and the Atlantic Ocean to the south (Fig. 1). his is a wave-dominated coast with predominant more intense S–SW stormy waves during winter months (Muehe 1979; Silva et al. 2008a; Pardal 2009). he pre-dominant longshore currents are to the west in response to the southeast waves. However, the occasional wave inci-dence from more than one direction (SE and SW) contrib-utes to the generation of currents to the east as well (Silva
et al. 2008a). Maximum spring tidal luctuation is 1.5 m (Navy Hydrograph Directory). he wind climate is strongly inluenced by the South Atlantic subtropical anticyclone. he prevailing wind directions are from the east and north-east quadrants (Amarante et al. 2002). Occasionally, winds of greater intensity come from the south and southwest associated with polar masses (CPTEC-INPE).
(Pleistocene), 5–9 m above contemporary mean sea level, presents gentle, undulating relief, whereas the outer barrier (Holocene) is 5–7 m above sea level and, at many places, is levelled out as a consequence of sand mining. Few dunes are still preserved in the Holocene barrier and reach 12 m of height. he distance between the crest of the two barri-ers is 300 m. he lagoonal plain is about 150 m wide and 1.5 m above sea level. It gradually disappears towards the easternmost limit of the study area where the two barriers meet (Fig. 2). he coastal ranges of Tiririca and Ponta Negra (Fig. 1) are made up of Precambrian granites, gneisses, and pegmatites cut by Mesozoic maic dykes. Weathering of these rocks supply medium—coarse, quartz-rich sand to this coastal plain.
he mechanisms responsible for the evolution of the Rio de Janeiro coast during the Quaternary, as well as its stratigraphy and depositional sequences, are poorly
known. One of the irst hypotheses, based on the surface morphology, proposed the formation of a spit enclosing large embayments giving rise to barrier–lagoon systems for the coast of Rio de Janeiro as a whole (Lamego 1940, 1945) and speciically to the Jacarepaguá coastal plain, about 50 km from the study area (Roncarati & Neves 1976). Sea-level luctuations began to be considered later as the most important process for evolution of the Rio de Janeiro coast, with submergence of the low-lying areas and formation of barriers as a mechanism for straight-ening the coastline (Perrin 1984; Coe Neto et al. 1986; Ireland 1987; Muehe & Corrêa 1989; Turcq et al. 1999; Pereira et al. 2003). In addition to sea-level luctuations as a cause of changing coastline, coastal dynamics due to longshore currents generated by waves oblique to the shoreline has been proposed as a mechanism inluencing the evolution of Rio de Janeiro barrier–lagoon systems
Brazil
Topographic and GPR
proiles
500 m N P7
P5 P4
P2
P-1
Maricá Lagoon
Maricá Lagoon
APA Maricá
São BentoChannel LagoonBarra GuarapinaLagoon
Barra Beach Ponta Negra Beach Jaconé
Beach Itaipuaçu BeachCosta Channel
Itaipu
Lagoon
Tiririca Coastal Range
Ponta Negra Coastal Range
Maricá
Islands
22º 57’ S
42º 52’ W
Maricá coastal plain
1 km N
c
b
Boreholes
Precambrian basement Quaternary deposits
(DMR, 1977)
Pleistocene barrier Holocene lagoonal plain Holocene barrier
Maricá coast
A
Atlantic Ocean
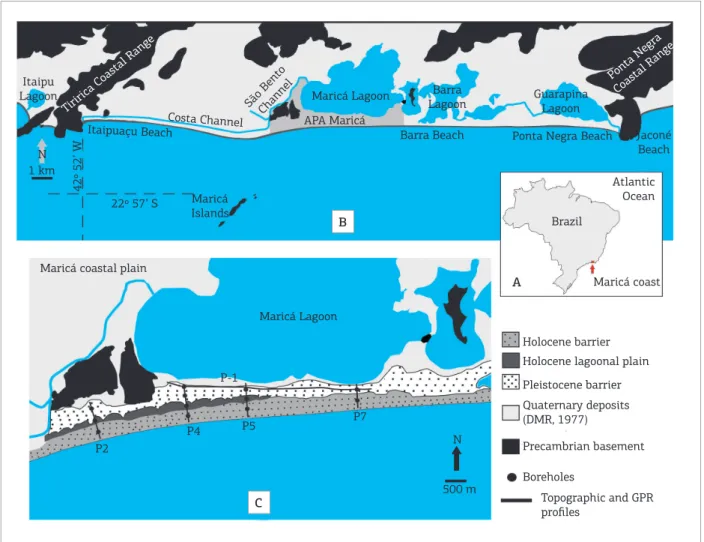
Figure 1. (A) Location of the study area in Rio de Janeiro, southeast Brazil. (B) Main geomorphological features of the Maricá: area in grey, designated APA Maricá, is the study site; Costa and São Bento channels are the limits to the west, Maricá Lagoon to the north, and a beach in the Holocene barrier, near Barra Lagoon, to the east.
(C) Barrier–lagoon system with topographic and GPR proiles and borehole locations (other proiles obtained
during survey are indicated but will not be discussed in this article). Barrier–lagoon system ages based on Ireland (1987), Turcq et al. (1999), Pereira et al. (2003), and Silva (2011).
B
A
(Perrin 1984). Perrin also proposed that an important transgressive event at around 120,000 years BP formed a large embayment in the Maricá area, followed by a regression of the sea, which caused the progradation of the coastline and exposure of the continental shelf (Perrin 1984). Paleontological evidence from Maricá and Niterói
lagoonal sediments indicate that the outer barrier started to form at around 7,150 years BP during a sea level rise that lasted until about 5,000 years BP (Ireland 1987). Similar behavior has been observed elsewhere in Brazil (Martin et al. 1993, 2003). Sediment analysis of the Brejo do Espinho and Vermelha lagoons, which occupy the
Figure 2. (A and B) Geomorphology of Maricá coastal plain: Maricá Lagoon to the north, two barriers (Pleistocene and Holocene) and the lagoonal plain in between. Approximately 800 m wide from beach to lagoon margin (photos by Guichard, D. 2009).
A
depression between the two barriers, in nearby areas, indi-cate the ages between 5,100 and 7,000 years BP, pointing out that the barrier–lagoon system was indeed formed during the Holocene transgression. Lagoonal deposits identiied by GPR and drilling dated as 6,000 years BP are present under the outer barrier, thus corroborating the retrograding character of the outer barrier during the Holocene (Pereira et al. 2003), as proposed before by Ireland (1987) and Turcq et al. ( 1999).
In this article, evidence is presented on the sedimentary architecture and depositional sequences of the Quaternary coastal plain of Maricá which will provide a better under-standing of the processes responsible for its evolution.
MaTerIals aND MeThODs
The various geomorphological environments of the Maricá coastal plain were characterized by a topographic survey. A total of ive proiles were obtained, one parallel and four perpendicular to the coastline, from the beach to the Maricá lagoonal margin (Fig. 1C). For this task, con-ventional topographic equipment was used because of the diiculty of moving along the dense bush and marsh areas. Mean sea level was deduced from the topographic proiles: the starting point for the perpendicular proiles was mean sea level, always at times of calm sea and same tidal regime (quarter moon). Topographic proiles were georeferenced with a Garmin GPS 12 XL equipment, and navigation sys-tem used was a WGS 84. GPR data were collected along the same lines.
GPR data of approximately 7 km area were collected using an SIR-2000 system (Geophysical Survey Systems Inc.) with a 200 MHz antenna. his system recorded relec-tion data up to 25 m below surface. he basic parameters used in the data acquisition of GPR include sampling win-dow 400 nanoseg, spacing of 10 cm between shot points, 512 samples per trace, frequency limits between 100 and 450 MHz, transmit antenna with 100 W of radiated power, 16-bit and survey-wheel record method. Velocities were adopted as of 0.10 m/ns previously determined from CMP (common mid-point) surveys in nearby areas (Pereira
et al. 2003). his is the medium velocity calculated from other CMP surveys in lagoonal muds and undersaturated and saturated sands below the water table (Neal & Roberts 2000 in Neal 2004). Data processing was conducted using RADAN 6.6 (Radar Data Analysis) software and included application of gains and ilters, deconvolution, topographic correction, and migration.
Basic principles of seismic stratigraphy have been applied for interpretation of the radargrams. he main relection
patterns considered for this work are dip, shape, continuity, intensity, and relector relationships (Neal 2004).
Five GPR profiles were acquired, four perpendicu-lar (Figs. 3 to 6) and one parallel to the coastline (Fig. 7). Proiles perpendicular to the coastline show better resolu-tion in areas of the lagoonal plain and inner barrier (Figs. 3 to 6); the proximity to the saltwater causes reduction of the radar resolution due to signal attenuation, thus decreasing the quality of the Holocene barrier images (Fig. 4A). he parallel proile (Fig. 7) shows good resolution except towards the east on the back of the inner barrier, where the road has been paved with a thick layer of mud. For this reason, only the west part of proile 1 is presented in this article.
Twelve boreholes were made, using either percussion or mechanical borers and reaching a maximum depth of 27 m. Sediments were collected during drilling and, depending upon their homogeneity, sampling was carried out at intervals of every meter or centimeter in order to characterize changes. he drilling company hired for this research used PVC tubes of diferent diameters varying from 150 mm (for the irst few meters) to 40 mm (for greater depth) in order to avoid closure of the boreholes and mixing of the sediments. Approximately 300 sediment samples were collected and described during drillings, and 1-m-long cores were also described and sampled. A total of 160 samples representing the main units were selected for grain-size and organic matter concentration analyses. Still in the ield, the samples were selected for 14C analy-sis and immediately placed in a freezer. Five samples con-taining shells and organic matter were sent to the Center for Applied Isotope Studies at the University of Georgia (USA) for radiocarbon dating by the accelerator mass spectrometry (AMS) method. Age calibrations were per-formed using OxiCal4 software (https://c14.arch.ox.ac uk). Organic matter samples were calibrated with SHCal13 curve and shells samples were calibrated with Marine13 curve (Reimer et al. 2013; Hogg et al. 2013; Bronk Ramsey
et al. 2009). For mud-sized particles, grain size analyses were carried out in a laser difraction machine (Malvern Mastersizer 2000). For sand and gravel, screen analyses were carried out. All sediments were classiied according to the Wentworth scale (1922, in Pettijohn 1975). Organic matter concentration in muddy sediments was obtained by calcination in a mule at 480 °C, and in coarse sedi-ments, by hydrogen peroxide.
DAtA PrEsENtAtION
(Figs. 3 to 6) and thus allow mapping of the main depo-sitional units and sedimentary architecture. Also, coastal sequences can be identiied, and the stratiication patterns indicate moments of retrogradation and progradation of the barrier–lagoon systems during the Quaternary. Furthermore, parallel proiles (Figs. 7 and 8) enable the recognition of channels and the lateral migration of the barrier as a whole (as a spit) through mapping of the inclined stratiication along the trend of the coastline. he integration of GPR data and boreholes allowed us to recognize six lithologi-cal units forming this 27-m-thick coastal deposit, made up mainly by sand and mud layers with subordinate amounts of gravel (Figs. 9 to 11).
The surface of basement rock (very weathered Precambrian gneiss) at about 20–27 m depth was iden-tiied as the basal boundary of the coastal sedimentary architecture (Fig. 9A). he basement surface comprises a low-amplitude, discontinuous interval relection with a general dip towards the sea and corresponds to Relector A (Figs. 3 to 6). his relector decreases in amplitude in the area of the Holocene outer barrier. he basement is a relection-free unit regarded as typical of basement (Neal 2004; Switzer et al. 2006).
Above Relector A, there occurs a 5-m-thick mud layer, Unit I (Figs. 4 to 6, 9B, and 10), that presents very few relectors and low relectance. he top of Unit I is limited by
Proile 2
Inner Barrier Lagoonal Plain Outer Barrier Ocean South North
M 0 50 5 0 -5 -10 -15 -20 5 0 m m 10 15 20 30 25 100 50 100 150 150 Reflector X
Reflector C Reflector E Reflector A Water table
Unit IV
Unit II Unit III
Unit V Unit VI Saltwater surface Weathered rock MSL 200 200 250 250 300 300 350 350 450 450 550 550 650 650 400 400 500 500 600 600 700 700 A B Figure 3. (A) GPR Proile 2 collected perpendicularly to the shoreline. (B) Interpretation of the GPR transects. The arrows indicate the main patterns of termination and relections observed. Proile 4
Inner Barrier Lagoonal Plain Outer Barrier Ocean South North
Maricá Lagoon
M 0 50 5 0 -5 -10 -15 -20 5 0 m m 10 15 20 30 25 100 50 100 150 150 Reflector X
Reflector C Reflector E Reflector D Gap Reflector B
Reflector A
Water table
Unit IV Unit II
Relector B, a horizontal to slightly seawardly inclined relec-tor, that extends 250 m to the south (Figs. 4 to 6). Relector B is interpreted as an erosional surface formed during a low-sea-level event. On the western side of the study area, this paleosurface is cut by three channels (Figs. 7 and 8, parallel proile). hese channels, located at about 10–15 m depth in the proiles, are similar in size, about 6 m deep and 20 m wide (channels A and B, Fig. 7) and 100 m wide (channel
C, Fig. 7). he stratiication of the channel ill dips mostly to the east, but also to the west, suggestive of a predomi-nant and progressive lateral migration of these channels to the east (Figs. 7 and 8).
Unit II occurs above Relector B, between 17 and 21 m depth, in the area of the Pleistocene inner barrier (Figs. 3 to 6). his unit, composed of white sand (Fig. 10), dis-plays a variety of relection patterns: sets of plane-parallel
Proile 5
Inner Barrier
Maricá Lagoon Lagoonal Plain Outer Barrier Ocean South North
M M
0 50
5
0
-5
-10
-15
-20
5
0 m m
10
15
20
30
25
100
50 100
150 150
Reflector X
Reflector C Reflector E Reflector D Reflector B
Water table
Unit IV
Unit IV
Unit II Unit I
Unit III
Unit V Unit VI
Saltwater surface
MSL
200 200
250 250
300 300
350 350
450 450
400 400
500 500
A
B
Figure 5. (A) GPR Proile 5 collected perpendicularly to the shoreline. (B) Interpretation of the GPR transects. The arrows indicate the main patterns of termination and relections observed.
Proile 7
Inner Barrier
Maricá Lagoon Outer Barrier Ocean South North
M 0 50
5 0 -5 -10 -15 -20 5 0 m m
10 15 20
30 25
100
50 100
150 150
Reflector X
Reflector C Reflector A
Reflector E Water table
Weathered rock
Unit IV
Unit IV
Unit II
Unit I
Unit V Unit VI
Saltwater surface
surface MSL
200 200
250 250
300 300
A
B
Figure 6. (A) GPR Proile 7 collected perpendicularly to the shoreline. (B) Interpretation of the GPR transects. The arrows indicate the main patterns of termination and relections observed.
A
A B
Proile 1
East
West
M 5 0 -5
-10 -15
-20 5 0 m m
10 15
20 25
50.0 100 150
Reflector B
Weathered rock
Reflector B
Reflector B
Reflector A Reflector A
Paleochannel A
Paleochannel B
Paleochannel C
Water table
Water table
Water table Water table
Unit IV Unit IV
Unit IV
P-4
P-5
Unit II?
Unit II? Unit I
Unit I Unit I
Unit IV
Unit IV Unit I
Unit I Surface
Surface
Surface Surface
MSL
MSL
200 250 300 350 400 450 500 550 600 650 700 750 800 850 900
900 10001050 1100 1150 1200 1250 1300 1350 1400 1450 1500 1550 1600 1650 1700 1750
1800
950
50.0 100 150 200 250 300 350 400 450 500 550 600 650 700 750 800 850 900
A
B
A
B
M 5 0 -5
-10 -15
-20 5 0 m m
10 15
20 25
Figure 7. (A) GPR Proile 1 acquired parallel to the shoreline. (B) Interpretation of GPR transect. The arrows indicate the main patterns of termination and relections observed. P-4 and P-5 show the points of intersection between the perpendicular and parallel proiles.
Proile 1
M
5
0
-5
-10
-15
-20
Paleochannel A
MSL
West Surface East
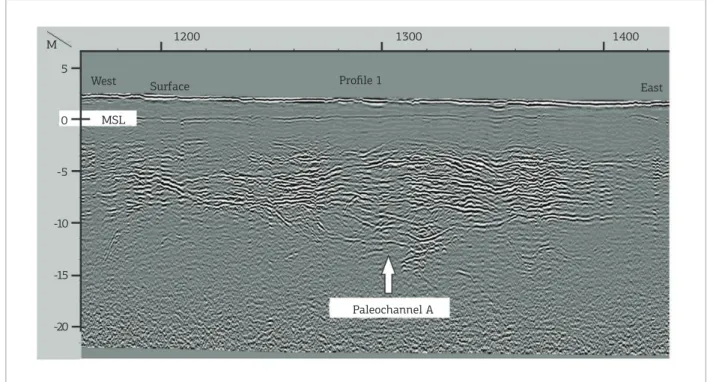
1200 1300 1400
Figure 8. Paleochannel A, about 200 m wide and 6 m thick, in GPR Proile 1.
horizontal strata, sets of strata dipping 20°–25° towards the sea, and groups of strata dipping 18°–22° towards the
continent (downlaps), thus indicating the occurrence of a former episode of barrier retrogradation. Unit II is limited
A
A B
B2 - OB B5 - LP B5 - LP
B5 - LP
B2-OB B7-OB
25-27 m 20,1 m depth
Precambrian basement
A b c
D
F E
Pleistocene mud
Holocene sands
white sand light yellow sand
Holocene sands
Holocene mud
Pleistocene mud Pleistocene mud Pleistocene mud
Pleistocene mud
Bioturbation
Organic matter
Pleistocene mud
20,5 m
23,6 m 21,6 m 19,6 m
23,0 m
11 m 10 m 9 m 8 m 7,5 - 8,5 m 6 m 4 m 2 m Surface
21,0 m 19,0 m
19,3 m 23,4 m
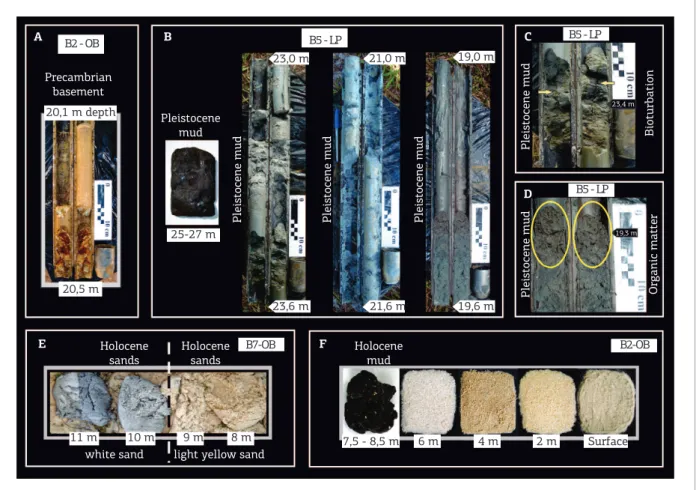
Figure 9. (A–F) Sediment samples collected with percussion or mechanical borers allowed the recognition of a
27-m-thick coastal deposit, composed mainly of sand and mud layers.
by Relector C, which can be followed for about 400 m to the lagoonal plain between the barriers (Figs. 3 to 6). here, stratiication within Unit II appears truncated, indicating the erosive nature of the event that gave rise to this prom-inent surface (Relector C). hus, Unit II must have been more widespread than observed now, corresponding to an earlier barrier–lagoon system in a more northern position.
Unit III, a 5- to 8-m-thick mud layer, occurs mainly below the lagoonal plain area (Figs. 3, 4, 5, and 10). he mud is bioturbated (Fig. 9C) with intercalated sandy layers (or sandy mud layers). Dating of shells and organic matter (Fig. 9D) indicated ages of approximately 47,567, 46,842, and 45,627 cal years BP (Tab. 1). Unit III presents stratii-cation dipping 10°–12° seaward near the margin, but these strata are not seen under the Holocene barrier. he lentic-ular geometry of this mud deposit is very suggestive of a paleolagoon. Relector D would correspond to the surface of this illed-up lagoon.
Unit IV, a 15- to 22-m-thick layer, formed by medi-um-to-coarse white sand, lies directly over Relector C or between Relectors D and E (Figs. 3 to 6, 9E, and 10). he most striking feature of Unit IV is a set of plane-parallel
strata dipping 24°–26° toward the continent (downlap), about 5 m beneath the surface in the inner barrier area, denoting a previous phase of retrogradation of this bar-rier. A second and more abundant set of strata dips steeply 30°–45° seaward, indicating a later phase of progradation of this barrier. Radiocarbon dating revealed ages of approx-imately 45,125 cal years BP for this unit (Tab. 1). Parallel Proile 1 (Fig. 7) shows inclined strata within Unit IV; the inclination is both to the west (seen at about 7–12 m under the surface) and to the east (depths 4–7 m) (Fig. 7). his stratiication pattern may indicate the result of long-shore drift and lateral migration of the barrier, in this case, predominantly to the west. An eastward component probably existed, as seen in the cross-stratiication within the paleochannels (Fig. 7). Relector X, which appears in Proiles 4, 5, and 7 (Figs. 4 to 6), represents a transitional contact between a layer of dark-brown coarse sand rich in organic matter and a layer of white coarse sand, con-irmed by drilling.
M 5 0 -5 -10 -15 -20
M 5 0 -5 -10 -15 -20
M 5 0 -5 -10 -15 -20
M 5 0 -5 -10 -15 -20 Weathered
gneiss/granite
Weathered gneiss/granite
Weathered gneiss/granite IV
IV
IV II
II
I
I
I III
III V
V
IV
IV VI MSL
MSL VI
Gap
B4-IBr
B5-IB B5-OB
B4-LP B2-LP
B5-LP B4-IBr
II
V
III
VI IV
MSL
~47567 ~45627
~45627
B7-OB B7-IB
II IV
VI
I
MSL B2-OB ~46842 B2-1B
50
0 100 150 200 250 300 350 400 450 500 550 600 650
50
0 100 150 200 250 300 350 400 450 500 550 600 650 700
Proile 2
Proile 4
50
0 100 150 200 250 300 350 400 450 500
Proile 5
Holocene Sandy Barrier (outer)
Water table
Boreholes Inferred top of the outer barrier
before sand mining.
Radiocarbon dating by AMS 14C
Cal years BP Pleistocene Lagoonal and Embayment Mud
Pre-Cambrian Basement
Pleistocene Sandy Barrier I (remaining) Pleistocene Lagoonal Mud
Pleistocene Sandy Barrier II (inner) Lagoonal Plain
50
0 100 150Proile 7200 250 300 Inner Barrier Lagoonal Plain Outer Barrier
Ocean South
North
Maricá Lagoon
Figure 10. Depositional model of the Maricá coastal plain: GPR proiles made perpendicularly to the coastline,
integrating geological drilling data and the results of radiocarbon dating (14C).
DIscUssION
The Quaternary stratigraphy of the Maricá coastal plain consists of three sedimentary sequences: Pleistocene Sequence I (PSI), Pleistocene Sequence II (PSII), and the Holocene Sequence (HS) (Fig. 11). hese sequences are limited by discontinuities, designated as Surfaces A, B, C, and E, representing the partial erosion of the various bar-rier–lagoon systems during the time interval in question (Figs. 11 and 12).
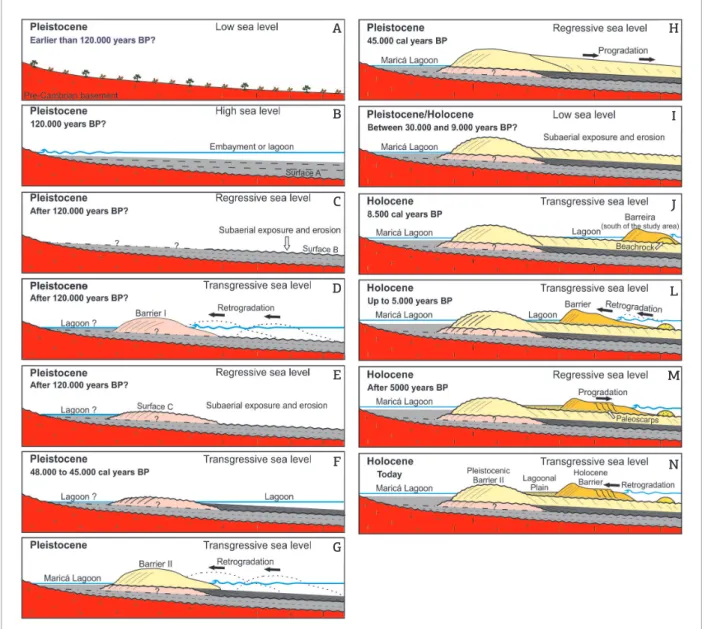
Sedimentation began with deposition of Unit I, inter-preted as lagoonal/embayment muds resting on top of eroded basement (Surface A) (Figs. 11, 12A and B). A marine transgression at about 120,000 years BP proposed for the extending for 500 m. It corresponds to an important
ero-sional interval during which part of Unit IV was eroded. It is also the unconformable contact between the Pleistocene and Holocene barriers.
Mainland Ocean
Paleolagoon (Unit V)
Paleolagoon (Unit III)
Embayment/paleolagoon (Unit I)
Basement
Surface A Surface B
Holocene Sequence
Unit VIb ~5 Ka
~8.5 cal ka BP (beachrock)
~35-9 ka BP ~48-45 ka BP Unit VIa
Unit V
Unit IVaUnit IVb
Unit II Unit III
E
C
B
A Present-day
sea level Rising Falling Unit I
Pleistocene Sequence II
Pleistocene Sequence I Surface E
(Unit IVa)
Surface C Pleistocene Barrier II (Unit IVb) Holocene Barrier
(Unit VIb) (Unit VIa)
Pleistocene Barrier I (Unit II)
Figure 11. Lithologic units and depositional sequences that form the coastal sedimentary deposit of Maricá: Pleistocene Coastal Sequence I, Pleistocene Coastal Sequence II, and Holocene Coastal Sequence.
coast of Rio de Janeiro as a whole (Perrin 1984) and the mud deposited during this phase of maximum inundation were the starting point for the coastal sedimentation his-tory of the studied area, previously interpreted to be related to a large lagoon or an embayment (Lamego 1940, 1945; Perrin 1984). his transgression has also been recognized along the southern coastal plain of Brazil where a barrier– lagoon system known as Barrier Island System III is believed to have formed around 123,000 years BP (Villwock et al. 1986; Tomazelli & Villwock 1996; Tomazelli et al. 2000). A subsequent erosional phase is represented by Surface B (Figs. 11 and 12C).
Prominent stratification dipping towards the conti-nent, above Surface B (Fig. 12D), indicates retrogradation of a barrier that reached maximum inland position in the study area (Pleistocene Barrier I, Fig. 11). hree channels are seen in the PBI (Fig. 7), and the sedimentary architecture of the channels points to their migration mainly eastward. Consequently, during this time interval, the barrier grew as a spit. We assume that PBI was formed during a high sea level, which caused the retrogradation of the barrier and at the same time longshore currents promoted growth of a spit to the east. Units I and II form Pleistocene Sequence I, limited by erosional surfaces A and C (Fig. 11).
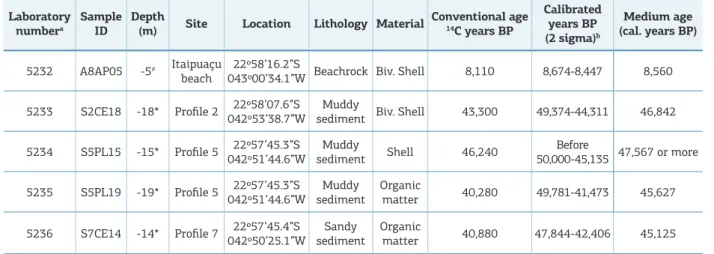
Table 1. AMS radiocarbon data of the beachrock and borehole samples
Laboratory numbera
sample ID
Depth
(m) site Location Lithology Material
conventional age
14c years bP
calibrated years bP (2 sigma)b
Medium age (cal. years bP)
5232 A8AP05 -5# Itaipuaçu
beach
22º58’16.2”S
043º00’34.1”W Beachrock Biv. Shell 8,110 8,674-8,447 8,560
5233 S2CE18 -18* Proile 2 22º58’07.6”S
042º53’38.7”W
Muddy
sediment Biv. Shell 43,300 49,374-44,311 46,842
5234 S5PL15 -15* Proile 5 22º57’45.3”S
042º51’44.6”W
Muddy
sediment Shell 46,240
Before
50,000-45,135 47,567 or more
5235 S5PL19 -19* Proile 5 22º57’45.3”S
042º51’44.6”W
Muddy sediment
Organic
matter 40,280 49,781-41,473 45,627
5236 S7CE14 -14* Proile 7 22º57’45.4”S
042º50’25.1”W
Sandy sediment
Organic
matter 40,880 47,844-42,406 45,125
aCenter for Applied Isotope Studies (CAIS), University of Georgia, USA. b95.4% reliable.
#Below modern mean sea level.
Figure 12. (A–N) Model showing the various stages that mark the evolution of the Maricá coastal plain.
A lenticular bioturbated mud deposit, rich in shells and organic matter, and dated at 47,567–45,627 cal years BP (Tab. 1),indicates formation of a late Pleistocene lagoon following the previous barrier–lagoon system (Figs. 11 and 12F) that was intensively eroded (sur-face C) leaving a remnant of the previous PBI Figs. 11 and 12E). Similarly, dating of muddy sediments from the Itaipu lagoon (Fig. 1) yielded ages between 42,500 and 35,000 years BP (Ireland 1987).
With the continuous rise of the sea, the barrier ret-rograded (Unit IVa) to a more northern position, giving rise to Pleistocene Barrier II (PBII), as clearly indicated by strata dipping to the north (Figs. 11 and 12G). his is, in fact, the inner barrier that outcrops today along the northern limit of the study area (Figs. 1 and 2). In sub-surface, under the Holocene system, stratiication dips
towards the sea (IVb). he relationship between Units III and IV (Fig. 11) point to a regressive sequence, called Pleistocene Sequence II (Fig. 11). However, at about 45,125 cal years BP (Tab. 1), the PBII presented progra-dational behavior, as seen by the downlaps in the GPR radargrams (Figs. 3 to 5). GPR parallel proile (Fig. 7) shows that strata in the barrier, at this time, dipped both westward and eastward (although less to the east). his is an indication of longshore currents causing lat-eral migration of the barrier system, predominantly to the west apparently. his pattern of drifting sand is sim-ilar to today’s dynamics which result from the oblique incidence of southeast waves (Silva et al. 2008a). here is evidence that the mechanism for the evolution of the barrier system is a combination of multiple causes, as proposed by Schwartz (1971).
A H
I
J
L
M
N B
C
D
E
F
An important erosional phase of the barrier system fol-lowed as sea level continued to fall (Surface E) (Figs. 11 and 12I). Sea-level curves for southern Brazil point to a fall of 120 m, which exposed the continental shelf (Correa 1996 cited by Suguio et al. 2005). If we consider the ages of 46–40,000 years BP (Tab. 1) for the sediments described here and 42,500–35,000 years BP (Ireland 1987) for the Itaipu lagoon muds as representing the last episode of sedimentation, we see that the erosional interval lasted from about 35,000 to about 8,560 cal years BP (Tab. 1), when Holocene sedimentation recommenced in the study area. Surface E is the unconformable contact between the Pleistocene sequences and the Holocene sequence. On the surface, the Pleistocene sands can be easily distin-guished by their bright white color as opposed to the yel-lowish Holocenic sands.
he ages of the sediments found for the Pleistocene Sequence II point to a position of the sea level at 48–45,000 cal years BP (Tab. 1) closer to the present-day level. his is very diferent from those observed on the global eustatic sea level curve chart for this time interval: at about 40,000 years BP sea level was 50 m below today’s level – MIS3 isotope stage (Lambeck & Chappell 2001; Waelbroeck et al. 2002; Peltier & Fairbanks 2006). Such contradiction needs to be better understood. he three samples dated for this work charac-terize very well this time interval for the study area and need to be taken into account. In São Paulo, at the São Sebastião Canal, about 280 km west of the Maricá coast, dating of muddy marine deposits, now in a very coastal setting, also indicates a higher than expected sea level at about 40,000 years BP (Klein & Mahiques 2003; Klein 2005; Mahiques
et al. 2010). his problem, which may be either method-ological or gemethod-ological, will be addressed as future research continues to enhance and clarify Brazilian sea-level behav-ior during the Quaternary.
A 8,560 cal years BP (Tab. 1) beachrock is the irst evi-dence of Holocene sedimentation in the area. his beachrock forms a 3-km long submarine outcrop at a depth of about 5 m and approximately 100 m from the beach at nearby Itaipuaçú (Figs. 1 and 2). It marks the base of the Holocene Sequence, overlying surface E (Figs. 11 and 12J). Similarly, in Jaconé beach (Fig. 1), a beachrock has been found and dated as 8,198–7,827 cal years BP (Mansur et al. 2011).
he Holocene Sequence is a transgressive (Fig. 11) and formed by two depositional units (V and VI), which are related to a barrier–lagoon system moving mostly inland (Unit Via: Figs. 11 and 12L), but also exhibiting a brief phase of progradation (Unit VIb: Figs. 11 and 12M). In nearby Itaipuaçu (Fig. 1), at the same stratigraphic level that of plane-parallel, very continuous strata are seen in GPR images, lagoonal peats indicated an age of 6,040–5,900 years
BP (Pereira et al. 2003) (Fig. 12 L), suggesting the existence of a lagoon associated with the barrier where the beachrock was formed.
A continuous trend of rising sea level promoted retro-gradation of the barrier, which reached a maximum at about 5,000 years BP, when sea level was about 3–5 m above present mean sea level (Angulo & Lessa 1997; Angulo et al. 1999; Lessa & Angulo 1998; Angulo et al. 2006; Martin et al. 1993, 1998, 2003). his is corroborated by a set of strata dipping towards the continent and resulted in the inilling of the lagoonal depression between the two barriers, giving rise to the geomorphological feature seen today as a paleo-lagoon plain (Figs. 1 and 2).
Later, the barrier prograded, as shown by groups of relec-tors deep down in the sand deposit, resembling present-day beach scarps (Figs. 3, 4, 5, and 6) and indicative of former beach positions (Fig. 12M). Retrogradation followed by progradation in the Holocene is also observed in diferent parts of the Brazilian coast (Villwock et al. 1986; Tomazelli & Villwock 1996; Tomazelli et al. 2000).
Today, the barrier is again retreating and overwash depos-its are commonly seen along the barrier system (Figs. 12N and 2B). Lins-de-Barros (2005) and Silva et al. (2008b) showed that the barrier has retrograded about 15 m in the past 30 years.
cONcLUsIONs
he geological evolution of the Maricá coastal plain during the Quaternary was strongly controlled by relative changes in sea level. Transgressions and regressions of the sea were responsible for deposition and erosion of lithological units as the barrier–lagoon systems formed and migrated throughout the study area.
Six lithological units were identiied, forming three dep-ositional sequences limited by erosional surfaces: Pleistocene Sequence I, Pleistocene Sequence II, and the Holocene Sequence containing the present-day barrier system.
A model for the evolution of the Maricá coastal plain includes the following main episodes of sedimentation and erosion:
■ Over Precambrian basement, a 25-m-thick or so deposit of mostly sand and mud is found.
points to a phase of intense retrogradation. hese two unities compose Pleistocene Sequence I. he existence of the Maricá Lagoon can be envisaged at this point.
■ Erosion of the barrier due to low sea level formed Surface C, leaving only a remnant of the previous barrier. Erosive Surface C, together with part of Surface B, forms the upper limit of Pleistocene Sequence I.
■ At about 47,000 cal years BP, Unit III was deposited as lagoonal muds. his is highly suggestive of a barrier located farther south, part of another barrier–lagoon system. Rising sea level caused retrogradation of such a barrier, leaving sandy Unit IV. his unit is seen today as the inner barrier at the northern limit of the study area. he Maricá Lagoon was deinitely present at this point in time. Later, a lowering of sea level caused progradation of the barrier, which reached a new position at about 45,000 cal years BP. hese two units (Units III and IV) make up Pleistocene Sequence II. With the continuous fall of sea level, the area underwent erosion, from at least 35,000 to about 9,000 years BP, which resulted in the important erosional Surface E, marking both the upper limit of PSII as well as the limit between the Pleistocene and the Holocene.
■ Holocene sedimentation started with formation of beachrock at 8,560 cal years BP, that represents an old barrier positioned about 100 m south of today’s beach. his barrier may have been associated with a paleola-goon (Unit V) at about 6,000 years BP (Pereira et al. 2003). Continuous rise of sea level during most of the
Holocene, with a maximum at about 5,000 years BP (Angulo & Lessa 1997; Angulo et al. 1999; Lessa & Angulo 1998; Angulo et al. 2006; Martin et al. 1993, 1998, 2003), promoted the retrogradation which formed Unit VIa whose sands illed up the lagoon and gave rise to today’s lagoonal plain. hese two units compose the Holocene Sequence overlying Surface E. A brief epi-sode of falling sea level allowed the barrier to prograde (Unit VIb). Today, as sea level is rising once again, the barrier has retrograded 15 m in the past 30 years (Lins-de-Barros 2005; Silva et al. 2008b).
Understanding the evolutionary history of the Maricá coastal plain is important for better management and preservation of this coastal area in the face of global cli-mate changes and sea-level rise. Moreover, our results and the model proposed here provide a modern ana-logue for oil and gas reservoirs associated with barrier– lagoon systems.
AcKNOWLEDGMENts
his project was funded by FAPERJ (E-26/170 452/07). We thank Cenpes-Petrobras for the GPR equipment and for processing the GPR data. We also thank those responsible for the Maricá APA for permitting access to the study area. We are very grateful to friends and students who helped during ield work.
Amarante O.A.C., Silva F.J.L., Filho L.G.R. 2002. Estado do Rio de Janeiro: Atlas Eólico. Secretaria de Estado de Energia, da Indústria Naval e do Petróleo, Camargo Schubert, p. 83.
Angulo R.J. & Lessa G.C. 1997. The Brazilian sea-level curves: a critical review with emphasis on the curves from Paranagua and Cananéia regions. Marine Geology, 140:141-166.
Angulo R.J., Paulo C.F., Giannini P.C.F., Suguio K., Pessenda L.C.R. 1999. Relative sea-level changes in the last 5500 years in southern Brazil (Laguna–Imbituba region, Santa Catarina State) based on vermetid 14C ages. Marine Geology, 159:323-339.
Angulo R.J., Lessa G.C., Souza M.C. 2006. A critical review of mid-
to late-Holocene sea-level luctuations on the eastern Brazilian
coastline. Quaternary Science Reviews, 25:486-506.
Bristow C.S. & Pucillo K. 2006. Quantifying rates of coastal progradation
from sediment volume using GPR and OSL: the Holocene ill of
Guichen Bay, south-east South Australia. Sedimentology, 53:769-788. Bronk Ramsey C. 2009. Bayesian analysis of radiocarbon dates.
Radiocarbon, 51(1):337-360.
rEFErENcEs
Cliton H.E. 2006. A reexamination of facies models for clastic
shorelines. In: Posamentier H.W. & Walker R.G. (eds.). Facies Models Revisited. SEPM (Society for Sedimentary Geology), Oklahoma, Special Publication no. 84, p. 293-337.
Coe Neto, R., Froidefond, J. M. and Turcq, B. 1986. Geomorphologie et chronologie relative des depots sedimentaires recents du littoral bresilien a l’est de Rio de Janeiro. Bull. Inst. Geól. Bassin d’Aquitaine,
Bourdeaux, 40: 67-83.
CPTEC-INPE. Centro de Previsão do Tempo e Estudos Climáticos do Instituto Nacional de Pesquisas Espaciais. Available from: http:// ondas.cptec.inpe.br/ (acessado em 30/10/12).
Davis Jr. A.R. 1985. Coastal Sedimentary Environments. New York, Springer-Verlag, 716 p.
Davis Jr. A.R. & Fitzgerald D.M. 2004. Beaches and Coasts. Oxford,
Blackwell, p. 115-166.
Hogg A.G., Hua Q., Blackwell P.G., Niu M., Buck C.E., Guilderson T.P., Heaton T.J., Palmer J.G., Reimer P.J., Reimer R.W., Turney C.S.M., Zimmerman S.R.H. 2013. SHCal13 southern hemisphere calibration 0–50,000 years cal BP. Radiocarbon, 55(4):1889-1903. Ireland S. 1987. The Holocene sedimentary history of the coastal lagoons of Rio de Janeiro State, Brazil. In: Tooley M. & Shennam I. (eds.), Sea Level Changes. Oxford, Brazil Blackwell Ltd., p. 25-66.
Klein D.A. & Mahiques M.M. 2003. Evidências de variações do nível relativo do mar durante o último ciclo glacial, na porção norte do canal de São Sebastião, litoral norte do estado de São Paulo. II Congresso sobre Planejamento e Gestão das Zonas
Costeiras dos Países de Expressão Portuguesa, Florianópolis,
p. 1-5.
Klein D.A. 2005. Registros de variações ambientais no Canal de São Sebastião (Estado de São Paulo), durante o Último Ciclo Glacial. Tese de Doutorado, Universidade de São Paulo, São Paulo, 85 p.
Krat J.C. & Chrzastowski M.J. 1985. Coastal stratigraphic
sequences. In: Davis Jr. A.R. (ed.), Coastal Sedimentary Environments. New York, Springer-Verlag, p. 620-663.
Lambeck K. & Chappell J. 2001. Sea level change through the last glacial cycle. Science, 292:679–686.
Lamego A.R. 1940. Restingas na Costa do Brasil. Divisão de Geologia e Mineralogia. DNPM, Boletim 96, 63 p.
Lamego A.R. 1945. Ciclo Evolutivo das Lagunas Fluminenses. Divisão de Geologia e Mineralogia. DNPM, Boletim 118, 47 p. Lessa G.C. & Ângulo R.J. 1998. Oscillations or not oscillations, that is the question – Reply. Marine Geology, 150:189-196. Lins-de-Barros F.M., 2005. Risco, Vulnerabilidade Física à Erosão Costeira e Impactos Sócio-econômicos na Orla Urbanizada do Município de Maricá, Rio de Janeiro. Revista Brasileira de Geomorfologia, 6(2):83-90.
Mahiques M.M., Souza S.H.M., Furtado V.V., Tessler M.G., Toledo F.A.L., Burone L. et al. 2010. The southern Brazilian shelf: general characteristics Quaternary evolution and sediment distribution.
Brazilian Journal of Oceanography, 58(2):25-34.
Mansur K.L., Ramos R.R.C., Godoy J.M.O., Nascimento V.M.R. 2011. Beachrock de Jaconé, Maricá e Saquarema – RJ: importância para a história da ciência e para o conhecimento geológico. Revista Brasileira de Geociências, 41(2):290-303.
Martin L., Bittencourt A.C.S.P., Dominguez J.M.L., Flexor J.M.,
Suguio K. 1998. Comment on the paper by R.J. Angulo and G.C. Lessa. The Brazilian sea-level curves: a critical review with emphasis on the curves from the Paranaguá and Cananéia regions. Marine Geology, 150:179-187.
Martin L., Dominguez J.M.L., Bittencourt A.C.S.P. 2003. Fluctuating Holocene sea levels in Eastern and Southeastern Brazil: evidence from multiple fossil and geometric indicators. Journal of Coastal Research (West Palm Beach, Florida), 19(1):101-124.
Martin L., Suguio K., Flexor J.M. 1993. As lutuações de nível do
mar durante o Quaternário Superior e a evolução geológica de “deltas” brasileiros. Boletim IG-USP 15, 186 p.
McCubbin D.G. 1982. Barrier-island and strand plain facies. In:
Scholle P.A. & Spearing D. Sandstone Depositional Environments, Tulsa, Oklahoma, The American Association of Petroleum Geologists, p. 247-279.
Muehe D.C.E.H. 1979. Sedimentology and topography of a high energy coastal environment between Rio de Janeiro and Cabo Frio – Brazil. Anais da Academia Brasileira de Ciências,
51(3):473-481.
Muehe D.C.E.H. & Corrêa C.H.T. 1989. The coastline between Rio de Janeiro and Cabo Frio. Coastlines of Brazil. New York, American Society of Civil Engineers, p. 110-123.
Neal A. 2004. Ground-penetrating radar and its use in sedimentology: principles, problems and progress. Earth Science Reviews, 66:261-330.
Pardal M.T.C. 2009. Mudanças morfológicas e suas implicações para a estabilidade da praia na Região do Recanto de Itaipuaçu, Maricá, RJ. Dissertação de Mestrado, Programa de Pós Grad. em Geologia e Geofísica Marinha da Universidade Federal Fluminense, 148 p.
Peltier W.R. & Fairbanks R.G. 2006. Global glacial ice volume
and Last Glacial Maximum duration from an extended
Barbados sea level record. Quaternary Science Reviews,
25:3322–3337.
Pereira A.J., Gamboa L.A.P., Silva M.A.M., Rodrigues A.R., Costa A. 2003. A Utilização do Ground Penetrating Radar (GPR) em Estudos de Estratigrafia na Praia de Itaipuaçú – Maricá (RJ). Revista Brasileira de Geofísica. EDUFF, Niterói,
21(2):163-171.
Perrin P. 1984. Evolução da Costa Fluminense entre as Pontas de Itacoatiara e Negra, preenchimentos e restingas. In: Lacerda L.D., Araújo D.S.D., Cerqueira R. & Turcq B. (eds.), Restingas, origens, processos, CEUFF, Niterói, p. 65-74.
Pettijohn F.J. 1975. Sedimentary Rocks, 3rd ed., New York, Harper and Row, p. 68-81.
Reimer P.J., Bard E., Bayliss A., Beck J.W., Blackwell P.G., Bronk Ramsey C. et al. 2013. Intcal 13 and Marine13 radiocarbon age – calibration curves 0–50,000 years cal BP. Radiocarbon
55(4):1869-1887.
Roncarati H. & Neves L.E. 1976. Projeto Jacarepaguá. Estudo
geológico preliminar dos sedimentos recentes supericiais da Baixada de Jacarepagua, Município do Rio de Janeiro – RI. Petrobras, Cenpes. Dexpro. 89 p.
Santos C.L., Silva M.A.M., Salvador M.V.S. 2004. Dinâmica Sazonal e os Efeitos das Ressacas nas Praias de Niterói/RJ. Revista Brasileira de Geociências, 34:355-360.
Santos P.F., Mello C.L., Morais R.M.O., Ribeiro C.S. 2006. Estudo
de Depósitos da Formação Barreiras com base em relexão por
ondas de radar. Revista do Instituto de Geociências – USP, São Paulo, 6(2):31-42.
Schwartz M.L. 1971. The multiple causality of barrier island.
Journal of Geology, 79:91-94.
Silva A.L.C., Silva M.A.M., Santos C.L. 2008a. Comportamento Morfológico e Sedimentar da Praia de Itaipuaçú (Maricá, RJ) nas Últimas Três Décadas. Revista Brasileira de Geociências,
38(1):89-99.
Silva A.L.C., Silva M.A.M., Santos C.L. Ribeiro G.B., Santos R.A., Vasconcelos S.C. 2008b. Retrogradação da Barreira Arenosa e Formação de Leques de Arrombamento na Praia de Itaipuaçú (Oeste de Maricá, RJ). Revista Brasileira de Geomorfologia,
9(2):75-82.
Suguio K., Angulo R.J., Carvalho A.M., Corrêa I.C.S., Tomazelli L.J., Willwock J.A. et al. 2005. Paleoníveis do mar e paleolinhas de costa. In: Souza C.R.G., Suguio K., Oliveira A.M.S. & Oliveira P.E (eds.). Quaternário do Brasil. Holos, Brasil, p. 114-127.
Tomazelli L.J. & Villwock J.A. 1996. Quaternary geological evolution of Rio Grande do Sul Coastal Plain, Southern Brazil.
Anais da Academia Brasileira de Ciências, 68:373-382.
Tomazelli L.J., Dillenburg S.R., Villwock J.A. 2000. Late Quaternary geological history of Rio Grande do Sul Coastal Plain, Southern Brazil. Revista Brasileira de Geociências, 30(3):474-476.
Turcq B., Martin L., Flexor J.M., Suguio K., Pierre C.,
Tasayaco-Ortega L. 1999. Origin and evolution of the Quaternary coastal plain between Guaratiba and Cabo Frio, State of Rio de Janeiro, Brazil. In: Knoppers B., Bidone E.D., Abrao J.J. (eds.), Environmental Geochemistry of Coastal Lagoon Systems. Série Geoquímica Ambiental 6, Rio de Janeiro, Brazil, p. 25-46.
Villwock J.A., Tomazelli L.J., Loss E.L., Dehnhardt E.A., Horn Filho N.O., Bachi F.A. et al. 1986. Geology of the Rio Grande do Sul coastal province. Quaternary of South America and Antarctic Peninsula, 4:79-97.
Waelbroeck C., Labeyrie L., Michel E., Duplessy J.C., Mcmanus J.F., Lambeck K. et al. 2002. Sea-level and deep water temperature changes derived from benthic foraminifera isotopic records.
Quaternary Science Reviews, 21:295-305.