Short Report
S
J. Braz. Chem. Soc., Vol. 24, No. 8, 1380-1384, 2013. Printed in Brazil - ©2013 Sociedade Brasileira de Química 0103 - 5053 $6.00+0.00*e-mail: [email protected]
Thermometric Quantitative Selective Analysis of Sodium Methoxide in
Methanol Industrial Solutions
Flavio A. Bastos, Sabir Khan, Eduardo H. Simões, Carlos A. Teixeira and Matthieu Tubino*
University of Campinas, Institute of Chemistry, PO Box 6154, 13083-970 Campinas-SP, Brazil
O metóxido de sódio é usado como reagente ou como catalisador em muitos processos industriais como, por exemplo, na síntese de fármacos e de biodiesel. O presente trabalho apresenta um novo e seletivo método analítico quantitativo termométrico para a determinação de metóxido de sódio em soluções de metanol na presença de íons hidróxido. Para fins de comparação com o método Karl-Fischer, os dois procedimentos foram aplicados a quatro diferentes soluções de metóxido de sódio em metanol, inclusive em presença de hidróxido de sódio, e os resultados foram comparados estatisticamente mostrando total concordância.
Sodium methoxide is used as a reagent or a catalyst in many industrial processes such as, for example, pharmaceuticals and biodiesel syntheses. This work presents a new and selective quantitative analytical thermometric method for sodium methoxide determination in methanol solutions in the presence of hydroxide ions.For comparative purposes with the Karl-Fischer procedure, these two methods were applied to four different solutions of sodium methoxide in methanol, including in presence of sodium hydroxide, and the results were compared statistically showing total agreement.
Keywords: methylate, methoxide, thermometry, quantitative analysis, methanol solutions
Introduction
Sodium methoxide (or sodium methylate) is an alkoxide widely employed in different applications in organic
syntheses1 in condensation and esterification reactions and
in transesterification reactions in which it acts as alkaline homogenous catalyst, being a principal way to obtain
biodiesel.2 In the pharmaceutical industry, it is used, for
example, in vitamin production.3
It is commonly furnished in methanol solutions in
30% m m-1 concentration. Despite its great importance
in industrial processes, the quantitation of the methoxide present in such solutions is done indirectly through acid-base titration that gives the total alkalinity expressed as percentage in weight of sodium methoxide in methanol
(including NaOH and Na2CO3). In order to obtain the
true methoxide concentration in the methanol solution, gaseous HCl or alternatively a solid acid as, for example, benzoic or salicylic, is added to an amount
of the methanol solution. In this process, hydrochloric acid (benzoic, salicylic) acid is transformed to sodium chloride (benzoate, salicylate) and methanol; NaOH is transformed to sodium chloride (benzoate, salicylate) and
H2O; sodium methoxide is transformed to methanol;
Na2CO3 is transformed to sodium chloride (benzoate,
salicylate) and to H2O and CO2. The H2O formed in
these reactions is correlated to the NaOH and Na2CO3
present in the solution. This water is then quantified through a Karl-Fischer titration and the partial alkalinity
corresponding to NaOH plus Na2CO3 is calculated, in
percentage in weight, as being simply NaOH. This value is then transformed, by molar relation, into the percentage in
weight of NaOCH3 and subtracted from the total alkalinity
obtained through the acid-base titration. The result is the alkalinity due to the actual concentration of sodium
methoxide in the methanol solution.4
Experimental
Equipment
A thermometric titrator from Metrohm, model
Titrotherm 859®, coupled to a PC-like computer was used;
time response 0.3 s; resolution 10-5 K. Experiments were
registered and processed through theTiamo®software. The
reaction flask was thermally isolated from the environment with a polyurethane jacket.
Materials
Stock solutions
All chemicals were of analytical grade and were used without further purification. A standardized stock solution of
30% m m-1 (total alkalinity) sodium methoxide in methanol
was used to prepare the other solutions, through dilutions with methanol. The total alkalinity of the stock solution was determined by titration with a previously standardized
HCl solution (0.1021 ± 0.004 mol L 1, against anhydrous
Na2CO3) using phenolphthalein as indicator.
5
Thermometric reagent
A solution of pure water (18 MΩ cm-1; Milli-Q Plus) at
10% (v v-1) in methanol was used as the thermometric reagent.
NaOCH3 solutions in presence of NaOH
Variable concentrations of NaOCH3 solutions also
containing NaOH were prepared by adding adequate quantities of pure water (Milli-Q Plus; accurately weighed
to 0.0001 g) to the stock 30% m m-1 solution.
Analytical curve
Variable concentrations of NaOCH3 solutions in the
presence of NaOH were prepared to construct the analytical
curve: 21.31, 23.02, 24.74, 26.15, 27.46 and 28.83% m m-1
starting from a 29.96 or a 30.20% m m-1 stock solution of
NaOCH3 were prepared. Determinations were performed
in triplicate.
A quantity corresponding to about 25.0 mL of each methoxide solution was carefully weighed to 0.0001 g and introduced into the thermometric flask. The maximum stirring rate of the instrument (2500 rpm) was applied. The signal of the base line was continuously registered.
In sequence, 10.0 mL of the reagent (10% m m-1 water in
methanol) were added at the dosing rate of 35 mL min-1.
The signal was registered until it was parallel to the initial background one (about 50 s). The difference between these two lines, before and after the addition of the
reagent, was calculated offering the temperature variation
(∆T) corresponding to the methoxide concentration. The
analytical curve was constructed plotting ∆T against the
concentration of the analyte. Considering that the thermal conditions of the instrument were not maintained perfectly constant throughout the day and also that the instrument is not actually an adiabatic calorimeter, the analytical
curve or alternatively the determination of the ∆T of an
individual reference concentration was always done when an analytical procedure was performed.
Results and Discussion
The technique used in this work is thermometry, which consists of adding a reagent to a flask that is thermally
isolated containing an amount of the analyte,6 measuring
the temperature change that is correlated to this amount. As an approximation, the instrumental system was considered as being adiabatic, i.e., all the heat is supposed to have originated exclusively from the implicit chemical reaction and from the mechanical stirring of the system and no loss of heat to environment occurs.
The temperature variation measurements were
performed essentially using a thermistor.7 The data were
collected and analyzed graphically in a computer. The
changes in temperature (∆T) were represented on the
ordinate and the correlated analyte concentrations on the abscissa.
When compared to the acid-base titration used to determine the concentration of the sodium methoxide in methanol solution, the thermometric procedure presented here specifically measures methoxide, discriminating between this anion and the hydroxide and even the carbonate. The eventual carbonate present is in low concentration because the solubility of this salt in
methanol is only about 0.27% m m-18 that, as it will be
seen below, is within the mean standard deviation of the used analytical methods.
Industrial solutions of sodium methoxide in methanol
are usually sold at the concentration of about 30% m m-1. It
is widely known that if this kind of solution enters in contact with humidity, due, for instance, to storage problems, methoxide will react with water generating hydroxide
ions according the following reaction, in which ∆H is the
enthalpy of the process:
NaOCH3+ H2O = H3COH + NaOH + ∆H (1)
Similarly, if CO2 enters in the methanol solution of
methoxide containing sodium hydroxide, Na2CO3 and
2 NaOH + CO2 = Na2CO3 + H2O (2)
H2O + NaOCH3 = H3COH + NaOH (3)
As Na2CO3 is slightly soluble in methanol, quantities
higher than about 0.27% m m-1 precipitate and, if filtered,
they will be not included in the total alkalinity obtained by the acid-base titration.
It can be observed in equation 1 that the thermal energy released from the reaction of methoxide with water producing methanol and hydroxide is stoichiometrically related to methoxide quantity. This indicates that if water is used in excess with respect to methylate, the reaction can be considered to occur quantitatively and therefore the anion methoxide can be specifically determined in the presence of hydroxide.
In order to avoid interference from solvation and desolvation, energies intrinsic in the process, water used as reagent was previously dissolved in anhydrous methanol. In such a way, the enthalpy of dissolution of water in methanol at the moment of the analysis was minimized. All other energy changes, related to phenomena of interaction with the solvent, are maintained almost constant. Therefore a linear, or quasi linear, correlation between
∆T and concentration was expected and in fact this was
experimentally observed.
Analytical curve
The obtained curve is described by the equation
∆T = (–16.83 ± 1.87) + (4.12 ± 0.18) C, where C is the
methoxide concentration in % m m-1 and ∆T the temperature
variation in oC (or K). The correlation coefficient is
R = 0.9961. It was observed that analytical curves for
a range from 15% m m-1 to concentrations higher than
29% m m-1 were better fit by a second order correlation.
For concentrations below 15% m m-1, the observed ∆T
became very small and the imprecision of the results rapidly increases.
In order to verify if the proposed thermometric method is selective with respect to the anion methylate in presence of hydroxide the following experiment was performed. Considering that the reaction of the ion methoxide with water occurs completely, three less concentrated solutions of this ion with concentrations of 23.83, 26.57 and 28.00%
(m m-1) were prepared starting from a stock sodium
methoxide (30.20% m m-1) by adding quantities of pure
water in known weights of the stock solution. Quantities of NaOH were formed in the methanol solution by the
reaction of NaOCH3 with H2O according to reaction 3. The
analytical results can be seen in Table 1. The total alkalinity
of the stock solution (30.20% m m-1) was determined
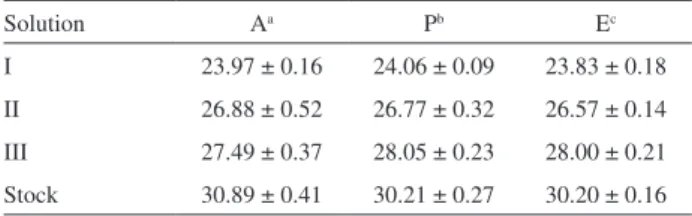
through acid-base titration and, as an approximation, it was initially considered as representing only the quantity of sodium methylate as the aim of this experiment was simply to observe if the proposed thermometric method is able to distinguish between hydroxide and methoxide anions. Usually the quantity of hydroxide and methylate anions contained in the stock solution, in this case, is very small, and in the present case, the objective of the experiment was to verify if the proposed thermometric method is able to detect only the residual methylate, ignoring the hydroxide formed with the introduction of water in the methanol solution of methylate. As shown in Table 1 this is effectively the case. It can be noted also that the results obtained through the analytical (A) curve and through the proportionality rule (P) using as reference the analytical signal of a solution whose concentration is near to that analyzed are similar. The same can be said when A and P are compared to expected concentrations (E) calculated considering the quantity of water added to the stock solution whose concentration was determined by acid-base titration. In Table 2, it is shown a statistical comparison between these results through the Snedecor
F-test and the paired Student’s t-test between the results
obtained and agreement at the 95% confidence level was observed in all cases.
The data in Table 1, particularly those related to the stock solution, show that the original solution used presents
low concentrations of NaOH and of Na2CO3. If such
substances are present in the solution their concentrations are below the mean standard deviation of the verified total alkalinity. Considering the analytical results obtained for the solutions of methylate prepared from the stock solution, Table 1. Determination of the concentration of sodium methoxide in methanol solutions in the presence of sodium hydroxide, using the proposed thermometric method. Values are means of three determinations and the concentrations are expressed in percentage of sodium methylate in methanol by weight
Solution Aa Pb Ec
I 23.97 ± 0.16 24.06 ± 0.09 23.83 ± 0.18
II 26.88 ± 0.52 26.77 ± 0.32 26.57 ± 0.14
III 27.49 ± 0.37 28.05 ± 0.23 28.00 ± 0.21
Stock 30.89 ± 0.41 30.21 ± 0.27 30.20 ± 0.16
aThermometric method: values determined from the analytical curve. bThermometric method: values determined through the proportionality
rule using as reference the analytical signal of a known and similar concentration. cExpected methylate concentration as calculated from
it is clear that the proposed thermometric procedure offers specific results for methoxide, distinguishing it from hydroxide.
In order to compare the thermometric method with the Karl-Fischer procedure, these two methods were applied to four different solutions and the results were compared statistically. The total alkalinity through acid-base titration was also determined for these solutions. The results can be seen in Table 3. The statistical comparison of these
data using the Student’s t-test and the Snedecor F-test are
shown in Table 4.
The statistical parameters shown in Table 2 show that there is agreement between the values of the concentration
of the sodium methoxide solutions prepared by reaction
with pure water and those determined by: (i) calculating
from the acid-base titration concentration value of the
stock solution; (ii) thermometric procedure using an
analytical curve; (iii) thermometric procedure using a
reference solution whose concentration is close to that
under determination; and (iv) calculating through the
proportionality rule.
Conclusion
The results obtained in this work reveal that the proposed method is feasible and reliable, meaning a breakthrough Table 2. Statistical comparison of the values obtained through (i) the acid-base titrimetric method,a (ii) the calibration curve and (iii) the proportionality
rule. The paired Student t-test and the Snedecor F-test were applied; n1 = n2 = 3; n = 4. For α = 0.05, critical t-value = 2.78 and critical F-value = 19.09
Calculated F and t-value
(i) Acid-base titrationavs. analytical curve (ii) Acid-base titrationavs. proportionality rule (iii) Analytical curve vs. proportionality rule
F t F t F t
1.27 0.82 4.00 1.62 3.16 0.69
13.8 0.81 5.22 0.81 2.64 0.25
3.10 1.70 1.20 0.23 2.59 1.86
6.57 2.22 2.85 0.05 2.31 1.96
aMethod applied to stock solutions and to solutions containing NaOH obtained by the addition of known quantities of water to methylate solutions in methanol.
Table 3. Determination of the concentration of the methylate present in methanol solutions using the Karl-Fischer method, the proposed thermometric method (calibration curve and proportionality rule) and the total alkalinity. Sodium methylate concentrations are in % m m-1
Method Solution
a
A B C D
Karl-Fischer 30.57 ± 0.24 29.75 ± 0.11 29.31 ± 0.18 27.85 ± 0.11
Proposedb 30.72 ± 0.06 30.03 ± 0.31 29.61 ± 0.53 28.40 ± 0.26
Proposedc 31.17 ± 0.34 29.79 ± 0.46 29.23 ± 0.57 28.17 ± 0.17
Total alkalinity 31.14 ± 0.22 30.83 ± 0.11 30.70 ± 0.18 30.66 ± 0.11
aSolution prepared by adding water to stock solution A. bValues obtained through the analytical curve. cValues obtained through the proportionality rule
using as reference the analytical signal of a solution whose concentration was close to that being analyzed.
Table 4. Statistical comparison of the values obtained through Karl-Fischer, thermometric analytical curve and proportionality rule. The paired Student
t-test and the Snedecor F-test were applied; n1 = n2 = 3; n = 4. For α = 0.05, critical t-value = 2.78 and critical F-value = 19.0. For α = 0.01, critical
t-value = 4.60 and critical F-value = 99.09
Solution
Calculated F and t-value Karl-Fischer vs. thermometric
analytical curve
Karl-Fischer vs. thermometric proportionality rule
Thermometric-analytical curve vs. proportionality rule
F t F t F t
A 16.0 0.86 2.01 2.04 32.1 1.84
B 7.94 1.20 17.5 0.12 2.20 0.61
C 8.67 0.76 10.0 0.19 1.16 0.69
in the direct determination of sodium methoxide in methanol solutions. The procedure is rapid and simple to be performed, mainly if the proportionality rule is used. It was successfully applied in the present work and can be suggested for the determination of sodium methoxide concentration in industrial solutions in methanol.
Acknowledgments
The authors would like to thank Metrohm for the loan
of the Thermometric Titrator model Titrotherm 859®, CNPq
for financial support and Prof. Carol H. Collins for English revision of the manuscript.
References
1. Chul, J. H.; Lin, P. S.; Wu, M. J.; Organometallics2010,29, 4058.
2. Puna, J. F.; Gomes, J. F.; Correia, M. J. N.; Fuel 2010, 89, 3602. 3. Ah, Y.; Choi, J.; Choi, Y.; Ki, H; Bae, J.; Int. J. Pharm.2010,
385, 12.
4. Rizescu, I.; Lessen, T.; Rev. Chim.1974, 2, 335.
5. Blaedel, W. J.; Meloche, V. W.; Elementary Quantitative Analysis – Theory and Practice, 2nd ed.; Harper & Row: New
York, USA, 1964, ch. 18.
6. Tyrrell, H. J. V.; Beezer, A. E.; Thermometric Titrimetry; Chapman and Hall Ltd: London, UK, 1968, ch. 3.
7. Eatough, D. J.; Christensen, J. J.; Izatt, R. M.; Experiments in Thermometric Titrimetry and Titration Calorimetry; Brigham Young University Press: Provo, USA, 1974, ch. 2.
8. Ellingboe, J. L.; Runnels, J. H.;J. Chem. Eng. Data1966, 11, 232.
9. Eckschlager, K.; Errors Measurement and Results in Chemical Analysis; Van Nostrand Reinhold: London, UK, 1972, ch. 4.
Submitted: January 14, 2013 Published online: June 28, 2013