Article
Printed in Brazil - ©2013 Sociedade Brasileira de Química0103 - 5053 $6.00+0.00A
*e-mail: [email protected]
Simultaneous Determination of the Organochlorine and Pyrethroid Pesticides in
Drinking Water by Single Drop Microextraction and Gas Chromatography
Elenice A. Carlos, Renata D. Alves, Maria Eliana L. R. de Queiroz* and Antônio A. Neves
Departamento de Química, Universidade Federal de Viçosa, Campus Universitário, s/n, 36570-000 Viçosa-MG, Brazil
Um método para determinação simultânea de 14 agrotóxicos (organoclorados e piretroides) em água foi desenvolvido utilizando microextração em gota única (SDME) e cromatografia gasosa com detector de captura por elétrons. Variáveis experimentais incluindo solvente orgânico, volume da microgota, tempo de extração, volume e velocidade de agitação da amostra e adição de sal foram avaliadas a fim de maximizar o desempenho da técnica SDME. Coeficientes de variação (CV), abaixo de 20% e recuperações relativas entre 71 e 107% indicaram boa precisão e exatidão do método. O protocolo desenvolvido também mostrou seletividade e boa linearidade com coeficientes de correlação (r) superiores a 0,99. Os limites de detecção dos analitos de interesse
apresentaram-se entre 0,003 e 0,6 µg L-1, todos abaixo dos respectivos níveis máximos de contaminantes para
água potável. Amostras de água potável foram analisadas utilizando o método proposto e nenhum dos pesticidas foi detectado.
A method for simultaneous determination of 14 pesticides (organochlorine and pyrethroid) in water was developed using the single drop microextraction (SDME) and gas chromatography with an electron capture detector. Experimental variables including organic solvent, volume of the microdrop, extraction time, volume and stirring speed of the sample and the addition of salt were evaluated to maximize the performance of the SDME technique. Coefficients of variation (CV) lower than 20% and relative recoveries between 71 and 107% indicated good precision and accuracy of the method. The developed protocol also showed selectivity and good linearity with correlation coefficients (r) greater than 0.99. Limits of detection of the analytes of interest were
between 0.003 and 0.6 µg L-1, all below the respective maximum contaminant levels (MCL) for
drinking water. Drinking water samples were analyzed using the proposed method and none of the pesticides were detected.
Keywords: single drop microextraction, organochlorine, pyrethroid, gas chromatography, electron capture detector
Introduction
The intensive use of pesticides in agriculture and non-agricultural activities, such as livestock production and public health campaigns, can generate potentially toxic substance residues in the environmental compartments: soil, water and air, and in foods as well. The exposure of humans to these substances, either directly or by consumption of contaminated food and water, increases the risk of cancer incidence since many of these substances are identified as potentially carcinogenic.1,2
Organochlorine pesticides tend to bioaccumulate in foodstuffs of animal origin, mostly in fatty tissues, in milk and dairy products, eggs and fish due to their lipophilic nature.3,4 The harmful action of the pesticides
to the environment and public health has been proven, leading to the restriction and even prohibition in different countries. Even banned, these pesticides have been found in several matrices,5-11 proving their persistence in the
environment. In Brazil, the organochlorine pesticides are prohibited since 1985,12 however these pesticide residues
have been found in blood samples of people who lived and worked in the urban area of Rio de Janeiro (Brazil),13 and
in drinking water14 samples in Bartolomeu River in Viçosa
of the organochlorine pesticides until the present days, it is so important to analyze organochlorine pesticides in a variety of matrices.
Avoiding the intake of such substances at levels that may cause health risks, the government agencies have established maximum residue limits of pesticide in foods and water intended for human consumption. In order to guide the assessment of the drinking water quality, maximum contaminant levels (MCL) were established for pesticides, the majority being organochlorines. Another class of contemplated compounds is that of synthetic pyrethroids, for which an MCL level was established for permethrin.2,15
The demand for low concentrations of a variety of pesticides to be monitored in drinking water has spurred the development of analytical methods for multiresidue analyses of these compounds with high sensitivity. Besides, currently, there is also a request for environmentally safe methods, reducing or eliminating the use of organic solvents which are often toxic substances.16
These methods have been developed by the association of gas chromatography and sample preparation techniques that do not employ organic solvents, or which employ a reduced amount of solvent such as solid phase microextraction (SPME)17-20 and the single drop microextraction (SDME).21-27
Review articles have covered different aspects of SDME.27-37
Single drop microextraction, as first developed by Jeannot and Cantwell38 in the late 1990s, was initially
combined with gas chromatography.
Single drop microextraction is a sample preparation technique for chromatographic analyses which uses simple equipment and causes low environmental impact. The first applications of SDME were performed by the immersion of an immiscible solvent drop in the bulk solution (direct SDME) for the extraction of organic analytes.23,24 In the
last years, the headspace single drop microextraction (HS-SDME) was developed for the extraction of volatile analytes.39,40 The preferred technique for the analyses of the
organic compounds is the gas chromatography (GC)23,31 in
spite of the fact that SDME has also been combined with high performance liquid chromatography (HPLC).41,42
This technique is coupled with graphite furnace atomic absorption spectrometry,43,44 inductively coupled plasma
mass spectrometry,45 electrothermal atomic absorption
spectrometry,46,47 UV-Vis spectroscopy,30,48,49 capillary
electrophoresis50 and mass spectrometry.51
This technique is currently gaining prominence since it drastically reduces the consumption of organic solvent and provides a high concentration factor, as well as integrates extraction and injection.21,52 In addition, the SDME technique
is not exhaustive, offers the freedom to select the most suitable solvent for the target analytes, requires only short
time for analyses. It has a high sensitivity and low cost when compared to SPME and solid phase extraction (SPE).22,24,53,54
This technique involves maintaining a microdrop of a water-immiscible solvent suspended at the tip of a microsyringe needle, which is then immersed in an aqueous sample under agitation. The analytes are transferred from the aqueous solution to the organic phase, and after a determined time, the microdrop is retracted back into the microsyringe and transferred to the chromatographic system for analyses.38,55 It is essential to select a proper
organic solvent, which must have good affinity for the target compounds.
The disadvantages of SDME include drop instability and low sensitivity.33 Thus, the ease of dislodgment of the
microdrop hanging from the tip of the microsyringe needle during the extraction process limits the use of extended extraction times, high stirring rates, sample temperature and the type of sample matrix to relatively clean (no solid particles present).29,31
Some works in the literature have demonstrated the efficiency of SDME for the analyses of some pesticides in water,21,23,24,56-58 providing low limits of detection,
good linearity and high accuracy.57 The presented results
demonstrate that this technique may be a good alternative to the sample preparation in multiresidue analyses of pesticides by gas chromatography and also for analyses of persistent organic pollutants (POPs) in drinking water. This work presents a method for the preconcentration of fourteen pesticides (some of which have not been considered previously) from water samples coupling SDME and gas chromatography-electron capture detector (GC-ECD) and to provide a sensitive and easy-to-use tool for the environmental monitoring of these contaminants. For the purpose of the present studies, different parameters affecting the extraction process were studied and optimized. The procedure was then applied to the simultaneous determination of organochlorine and pyrethroid pesticides in drinking water.
Experimental
Reagents and solutions
Supelco, Inc. (Bellefort, PA, USA) and standards of deltamethrin (purity = 98%), dieldrin (purity = 97.9%), endosulfan (purity = 73.2% for endosulfan I and 26,6% for endosulfan II), endrin (purity = 99.3%), lindane (purity = 99.8%), methoxychlor (purity = 98.7%) and hexachlorobenzene (purity = 99.8%) were obtained from Sigma-Aldrich (Seelze, Germany). Stock solutions were prepared in acetonitrile (Tedia/HPLC-Spectro grade; Fairfield, OH, USA) and stored at –18 oC. Working solutions
were prepared by the dilution of stock solutions in distilled water, free of the analytes, and these were stored at 4 oC.
The solvents n-hexane (Vetec; Duque de Caxias, RJ, BRA) and toluene (Vetec; Duque de Caxias, RJ, BRA) were of pesticide grade. Water used for optimization and validation was distilled and passed through an ion exchange resin.
Single drop microextraction (SDME)
The water sample (10.0 mL) was placed in a 15 mL glass flask, equipped with a magnetic stir bar and silicone septum. A 10 µL microsyringe was used to measure and introduce the microdrop of solvent. The microsyringe with a steel needle (701 RN, Hamilton, USA) containing n-hexane was introduced into the flask and the needle tip was submerged in the aqueous sample to half the height of the liquid column and the plunger was slowly pushed down exposing the microdrop in the solution. A microdrop of 1.6 µL was maintained in contact with the sample agitated at 380 rpm (PC-420, Corning) for 15 min at 20 oC. After extraction, 1.0 µL was collected
in the microsyringe and directly injected into GC-ECD. Before each extraction, the microsyringe was washed with organic solvent to ensure thorough cleaning and removal of air bubbles.
Chromatographic analyses
Analyses were performed using a Shimadzu gas chromatograph, model 2014, equipped with an electron capture detector. The chromatographic separations were performed in an Rtx-5MS capillary column, Restek (30 m × 0.25 mm i.d. and 0.25 µm film thickness). The oven temperature programming was as follows: initial temperature of 150 ºC (1 min), heating at 30 °C min-1
to 200 oC, followed by heating at a rate of 3 °C min-1 to
240 oC, and finally heating at 20 °C min-1 to 290 oC, and
this temperature was maintained for 6 min. Nitrogen was used as carrier gas at a flow rate of 1.0 mL min-1; and
temperatures of the injector and detector were maintained at 280 and 300 °C, respectively. All injections were done in the split mode with a flow split of 1:5.
Results and Discussion
Chromatographic analyses
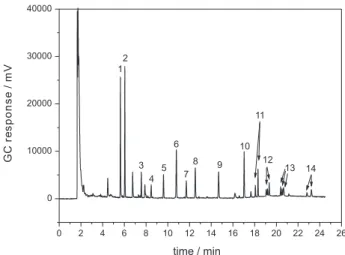
The optimized chromatographic conditions for the simultaneous analyses of the 14 pesticides after SDME allowed the complete separation of all the analytes with an analysis time of 25 min. Figure 1 represents a chromatogram obtained after the analyses of the drinking water spiked with the organochlorine pesticides: aldrin, dieldrin, endosulfan, endrin, heptachlor and heptachlor epoxide at 0.4 µg L-1;
hexachlorobenzene, lindane, DDT and methoxychlor at 0.8 µg L-1; and the pyrethroids: λ-cyhalothrin, cypermethrin,
deltamethrin and permethrin at 8 µg L-1, by SDME.
Optimization of the single drop microextraction
In the optimization process of the method for the simultaneous analyses of the organochlorine and pyrethroid pesticides in water, some variables of the SDME technique were evaluated in a univariated approach. The peak area of the analyte was used as the GC response to evaluate the extraction efficiency under different conditions. For this study, distilled water samples spiked with seven organochlorine pesticides (aldrin, DDT, dieldrin, endrin, endosulfan, heptachlor and methoxychlor) and four pyrethroids (λ-cyhalothrin, cypermethrin, deltamethrin and
Figure 1. Chromatogram obtained from the analyses of drinking water spiked with organochlorines and pyrethroids, where: (1) tR = 5.6 min: hexachlorobenzene; (2) tR = 6.0 min: lindane; (3) tR = 7.5 min: heptachlor; (4) tR = 8.4 min: aldrin; (5) tR = 9.6 min: heptachlor epoxide; (6) tR = 10.7 min: endosulfan; (7) tR = 11.7 min: dieldrin; (8) tR = 12.5 min: endrin; (9) tR = 14.6 min: DDT; (10) tR = 17.0 min: methoxychlor (11) tR = 18.1 and 18.3 min: λ-cyhalothrin; (12) tR = 19.1 and 19.3 min: permethrin; (13) tR = 20.4; 20.5 and 20.7 min: cypermethrin; (14) tR = 22.8 and 23.2 min: deltamethrin. The drinking water was spiked with the organochlorine pesticides: aldrin, dieldrin, endosulfan, endrin, heptachlor and heptachlor epoxide at 0.4 µg L-1, hexachlorobenzene, lindane, DDT and methoxychlor at 0.8 µg L-1; and the pyrethroids:
permethrin) were used. The samples were spiked at 1 and 40 µg L-1 for organochlorines and pyrethroids,
respectively. The variables of the optimized technique were: organic solvent, volume of the microdrop, extraction time, volume and stirring speed of the sample and ionic strength (addition of NaCl). Table 1 reports the order in which the experiments were performed, the variables and their combinations in the optimization of SDME. For each combination, tests were performed in triplicate. The best performances of each variable were considered by the obtained chromatographic responses and their influence on the stability of the microdrop.
Extraction solvent
The selection of the organic solvent is a critical step in ensuring good performance of SDME. The selected solvent must, at the same time, ensure efficiency of the analyte mass transfer to the organic phase and preserve the integrity of the microdrop during the extraction. For extraction by immersion of the microdrop in an aqueous solution, the main requirement is the immiscibility of the solvent in the aqueous phase. Another property that should be taken into consideration for the organic solvent selection is viscosity, which should be adequate for the formation and retention of the microdrop on the tip of the microsyringe needle during the extraction. Considering these characteristics, toluene and n-hexane were the solvents used in this study. These solvents were also used in other works that combine SDME with gas chromatography.24,26,59,60
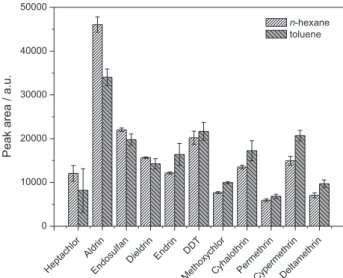
The assays were performed using the extraction conditions shown in Table 1. For each employed solvent, the results were expressed by the mean areas of the peaks (n = 3) of each analyte. The efficiencies of the n-hexane and toluene for the extraction of the analytes are shown in Figure 2.
The obtained chromatographic responses for most analytes of interest using n-hexane or toluene as the extraction solvent were statistically similar. Only aldrin, methoxychlor and cypermethrin showed significantly
Table 1. Unifactorial planning for optimization of the extraction conditions of the pesticides in water samples
Execution order Evaluated factor Extraction condition
ES ET / min SR / rpm VOp / µL SA / %, m/v VAp / mL
1 ES EF 10 155 2.0 0 10
toluene
n-hexane
2 ET / min hexane EF 155 2.0 0 10
5 to 35
3 SR / rpm hexane 15 EF 2.0 0 10
100 to 870
4 VOP / µL hexane 15 380 EF 0 10
1.6 to 2.2
5 SA / %, m/v hexane 15 380 1.6 EF 10
0 to 6
6 VAp / mL hexane 15 380 1.6 0 EF
10 to 35
ES: extraction solvent; ET: extraction time. SR: stirring rate; VOp: microdrop volume; SA: salt addition; VAp: sample volume; EF: evaluated factor.
Figure 2. Effect of the organic solvent (n-hexane and toluene) on the extraction of the analytes by SDME. Experimental conditions, extraction time: 10 min; agitation speed: 155 rpm; microdrop volume: 2.0 µL; addition of salt: no; sample volume: 10 mL. The drinking water was spiked with the organochlorine pesticides: aldrin, dieldrin, endosulfan, endrin, heptachlor and heptachlor epoxide at 0.4 µg L-1, hexachlorobenzene, lindane, DDT and methoxychlor at 0.8 µg L-1; and the pyrethroids:
different responses depending on the employed organic solvent. The observed relative increase in the response for aldrin was 35% when n-hexane was employed. For methoxychlor and cypermethrin, these increases were 29 and 38%, respectively, when the organic solvent was toluene. However, n-hexane showed the best response for aldrin and dieldrin, presenting the most restrictive MCL level in drinking water, 0.032,15 µg L-1 for both
summed together. The MCL level for methoxychlor and cypermethrin is much higher, 20 µg L-1.15 Considering the
need for a method with sufficient sensitivity to meet the requirements for aldrin, n-hexane is more appropriate than toluene. In addition, n-hexane presented lower standard deviations between the measurements, as can be seen in Figure 2, and therefore, this solvent was used in later assays.
Extraction time
SDME is an equilibrium technique, and it is, therefore, expected that the increase in the extraction time results in an increase in the mass of the analyte transferred from the aqueous phase to the organic phase, reaching its maximum at the moment in which the system attains the equilibrium. However, the drop depletion must be considered in choosing the extraction time since only a very small volume of organic solvent is used in this technique, and the drop depletion would lead to concentration variations of the analyte in the microdrop.1,35,57 In this study, the extraction
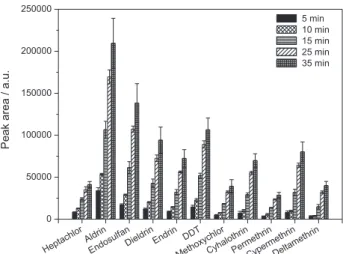
time profiles were investigated by monitoring the analytical signal as a function of exposure time. Figure 3 shows
the variations of the chromatographic responses for each analyte in function of the exposure time of the microdrop with the sample from 5 to 35 min. It was observed that the amount of extracted pesticide by SDME increased with increasing exposure time. At this time (35 min), the system had not yet reached the equilibrium.
It was also observed that incidents of microdrop dissolution happen after exposure times greater than 15 min. A decrease of 45% in the initial volume of the microdrop was registered for an extraction time of 35 min. In order to avoid variations in the volume of the microdrop during extraction, an extraction time of 15 min was selected for all subsequent analyses. It is possible to work in non-equilibrium conditions since the time measurement has been accurate.61 Other researchers have also opted to
work outside of equilibrium conditions, reporting good results with respect to the performance of the method.1,22,57
Stirring rate
The elevation of the stirring speed increases the extraction of the analytes and reduces the time required for the system to reach equilibrium.1,36,62 However, just as
extraction time, the stirring speed is a factor that must be evaluated considering not only the efficiency of the analyte mass transfer from the aqueous phase to the organic phase, but also the integrity of the microdrop. Elevated agitation speeds increase the occurrence of separation or displacement of the microdrop and decrease the volume due to the dissolution of the solvent droplet in the aqueous phase, as well as the formation of air bubbles.16 With the purpose of
avoiding these incidents and of ensuring greater precision, agitation speeds below 900 rpm are generally selected in works reported in the literature.1,22,27,58,62 The effect of
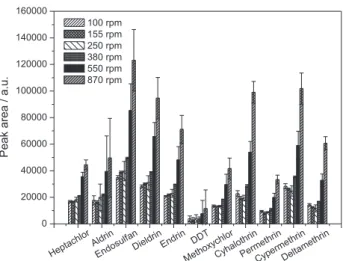
stirring speed on the analyte extraction was evaluated using speeds between 100 and 870 rpm. Greater speeds were not considered in this work due to the formation of air bubbles, and the high frequency of microdrop detachment in preliminary tests when applying the extraction conditions shown in Table 1. The relationship between the analytical signal and stirring speed is shown in Figure 4.
Increases in the peak areas with the increased stirring speed were observed for all the analytes. It was also observed that the maximum mass transfer of analytes was not achieved using an agitation speed of 870 rpm. However, higher speeds may compromise the integrity of the microdrop.23 It has been found that stirring speeds higher
than 380 rpm decreased the volume of the microdrop, compromising its stability and the precision of the results. Based on these observations, a stirring rate of 380 rpm was adopted.
Figure 3. Effect of the extraction time (5 to 35 min) of the microdrop
Microdrop volume
The effect of microdrop volume on the extraction of analytes was evaluated by maintaining the volume of the organic phase that was collected at the end of extraction constant equal to 1.0 µL, independent of the initial volume (1.6 to 2.2 µL). This procedure was adopted to control the volume injected since this volume must vary in accordance with the employed microdrop volume. In previous studies, microdrop volumes greater than 1.0 µL were tested and a minimum volume of 1.6 µL was determined since smaller volumes presented the risk of collecting the matrix along with the organic phase, and a maximum volume of 2.2 µL since larger volumes of microdrop caused drop instability and handling difficulties.1,16,22 Another
disadvantage of employing a larger microdrop volume is the time increase required for the system to reach equilibrium since mass transfer inside the droplet is only by diffusion.63
Figure 5 presents the peak areas of the analytes for each employed microdrop volume: 1.6, 1.8, 2.0 and 2.2 µL.
It was observed that minor standard deviations between the measurements (n = 3) were obtained when employing a microdrop volume equal to 1.6 µL. Increasing trend in the responses when employing volumes equal to 1.8 µL was also observed. However, the Tukey test showed that the responses for most analytes are not significantly different at a 95% confidence interval. Thus, the volume of microdrop of 1.6 µL was selected for further experiments due to its stability and lower standard deviations that were presented by the most of the compounds.
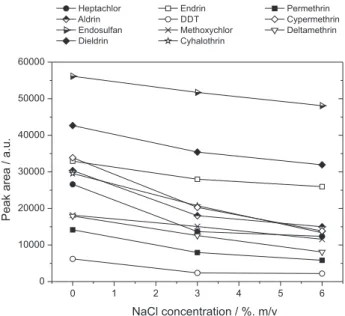
Effect of the salt addition
The effect of increasing the ionic strength of the water sample was evaluated by adding NaCl (ranging from 0 to 6%, m/v) into the water sample under the conditions shown in Table 1. The variations in the chromatographic responses as a function of the NaCl concentration in the solution are presented in Figure 6.
The decrease in the peak areas of the analytes due to the increase of the NaCl concentration in the solution indicates the negative effect of the salt addition on the mass transfer of the analytes from the aqueous phase to the organic phase. The addition of salt to the sample generally increases the extraction of slightly polar compounds due to the increased ionic strength of the solution.36 However,
adverse effects have also been observed for SDME.1,22,23,64
It is assumed that besides the effect of “salting-out”, the presence of salt causes changes in physical properties of the extraction surface, reducing the rates of analyte diffusion to the organic phase.53,54,57
Sample volume
The effect of the sample volume on the rate of the analyte mass transfer from the aqueous phase to the organic phase under non-equilibrium conditions was examined from 10 to 35 mL of sample volume. Different factors were fixed in each experimental stage (Table 1). In the first step, the analyte concentrations were maintained
Figure 4. Effect of the agitation speed of the sample (100 to 870 rpm) on the extraction of the analytes by SDME. Experimental conditions, extraction solvent: n-hexane; extraction time: 15 min; microdrop volume: 2.0 µL; addition of salt: no; sample volume: 10 mL. The drinking water was spiked with the organochlorine pesticides: aldrin, dieldrin, endosulfan, endrin, heptachlor and heptachlor epoxide at 0.4 µg L-1, hexachlorobenzene, lindane, DDT and methoxychlor at 0.8 µg L-1; and the pyrethroids: λ-cyhalothrin, cypermethrin, deltamethrin and permethrin at 8 µg L-1.
Figure 5. Effect of the microdrop volume (1.6 to 2.2 µL) on the extraction of the analytes by SDME. Experimental conditions, extraction solvent: n-hexane; extraction time: 15 min; agitation speed: 380 rpm; addition of salt: no; sample volume: 10 mL. The drinking water was spiked with the organochlorine pesticides: aldrin, dieldrin, endosulfan, endrin, heptachlor and heptachlor epoxide at 0.4 µg L-1, hexachlorobenzene, lindane, DDT and methoxychlor at 0.8 µg L-1; and the pyrethroids:
constant; in the second step, the concentrations were modified to maintain constant the total mass of each analyte. For this second condition, the tests using 35 mL of sample were performed with samples diluted by a factor of 3.5 times. The obtained analytical responses are shown in Figure 7.
The tests were performed under non-equilibrium conditions and the variables were strictly controlled and maintained constant in all the experiments. The extraction of the analytes from the aqueous phase to the organic phase (microdrop) is controlled by kinetic factors. Then, varying the sample volume and keeping constant the concentration of the analytes in the aqueous phase, the chromatographic responses were statistically similar. In the second step, the results revealed that the reduction in the analyte concentration decreased the chromatographic responses. These results indicated that for the studied volumes, SDME depends on the concentration of the analytes in the sample and not the sample volume, consequently permitting the use of small sample volumes. Lower volumes than 10 mL should be tested in another study to evaluate if these kinetic conditions continue valid.
The sample volume was fixed at 10 mL in the assay for the validation of the method.
Performance of the analytical method
The performance of the optimized method was evaluated for simultaneous analyses of ten organochlorines and four pyrethroids in water samples.
Evaluating the analytical performance of the developed method, the parameters of selectivity, linearity, repeatability, intermediate precision, relative recovery and limits of detection (LOD) and quantification (LOQ) were used. The parameters were determined according to the recommendations of the International Conference on Harmonization (ICH).65 The obtained results are presented
in Tables 2 and 3.
The selectivity of the method was evaluated by submitting the drinking water samples to the developed analytical procedure. For this matrix, no chromatographic peak was recorded at the same retention time of the analytes, indicating the absence of compounds that could affect the analytical signal of the organochlorines and pyrethroids of interest (Figure 8).
The LOD and LOQ values of the method were determined by the signal/noise ratio. Distilled water samples spiked with organochlorines and pyrethroids were used in the concentration ranges from 1.0 to 0.001 µg L-1 and
10 to 0.1 µg L-1, respectively. The concentrations that
produced signals above the noise baseline by 3 and 10 times were defined as LOD and LOQ, respectively. The LOD values of all the analytes are below their respective maximum allowed limits (MCL) in drinking water that were established by Brazilian legislation15 and by WHO
(World Health Organization).2
Figure 6. Effect of the addition of salt (NaCl, 0 to 6%) on the extraction of the analytes by SDME. Experimental conditions, extraction solvent: n-hexane; extraction time: 15 min; agitation speed: 380 rpm; microdrop volume: 1,6 µL; sample volume: 10 mL. The drinking water was spiked with the organochlorine pesticides: aldrin, dieldrin, endosulfan, endrin, heptachlor and heptachlor epoxide at 0.4 µg L-1, hexachlorobenzene, lindane, DDT and methoxychlor at 0.8 µg L-1; and the pyrethroids:
λ-cyhalothrin, cypermethrin, deltamethrin and permethrin at 8 µg L-1.
Figure 7. Effects of the volume (10 and 35 mL) and the sample dilution
The compounds with the most restrictive MCL (0.03 µg L-1) are aldrin + dieldrin, heptachlor and heptachlor
epoxide. For these compounds, the LOQ values were three times smaller than the obtained MCL values, except for aldrin + dieldrin whose LOQ is a little bigger than MCL. For the other analytes of interest, the obtained LOQ values are at least ten times smaller than MCL. These results
indicate that the method presents adequate sensitivity for monitoring of drinking water quality with regards to the evaluated pesticides in this study.
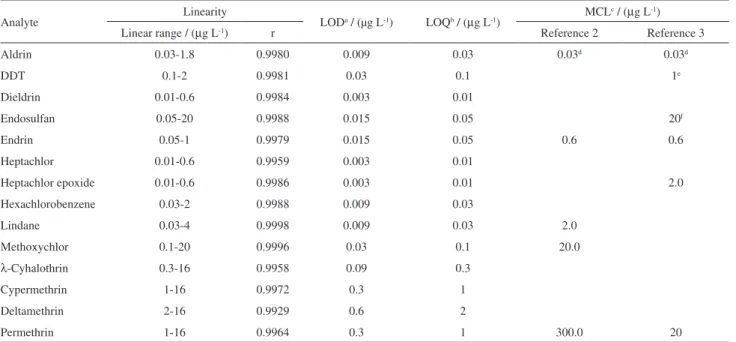
The linearity of the method was determined by the analyses of distilled water samples that were spiked with the analytes of interest in six different concentration levels, including the respective LOQ. The curves were constructed
Table 2. Linearity, limits of detection and of quantification and maximum contaminant levels
Analyte Linearity LODa / (µg L-1) LOQb / (µg L-1) MCL
c / (µg L-1)
Linear range / (µg L-1) r Reference 2 Reference 3
Aldrin 0.03-1.8 0.9980 0.009 0.03 0.03d 0.03d
DDT 0.1-2 0.9981 0.03 0.1 1e
Dieldrin 0.01-0.6 0.9984 0.003 0.01
Endosulfan 0.05-20 0.9988 0.015 0.05 20f
Endrin 0.05-1 0.9979 0.015 0.05 0.6 0.6
Heptachlor 0.01-0.6 0.9959 0.003 0.01
Heptachlor epoxide 0.01-0.6 0.9986 0.003 0.01 2.0
Hexachlorobenzene 0.03-2 0.9988 0.009 0.03
Lindane 0.03-4 0.9998 0.009 0.03 2.0
Methoxychlor 0.1-20 0.9996 0.03 0.1 20.0
λ-Cyhalothrin 0.3-16 0.9958 0.09 0.3
Cypermethrin 1-16 0.9972 0.3 1
Deltamethrin 2-16 0.9929 0.6 2
Permethrin 1-16 0.9964 0.3 1 300.0 20
aLOD: limit of detection; bLOQ: limit of quantification; cMCL: maximum contaminant level; daldrin + dieldrin; eDDT + DDD + DDE; fendosulfan I + endosulfan II; r: correlation coefficient.
Table 3. Repeatability, intermediate precision and relative recovery
Pesticide
CVa / %
Relative recovery /
% Repeatability (n = 3) Intermediate precision (n = 9)
LOQb 2 LOQb 5 LOQb 10 LOQb LOQb 2 LOQb 5 LOQb 10 LOQb
Aldrin 12.26 2.26 3.05 5.96 8.17 13.22 17.27 11.70 71
DDT 10.48 1.80 1.99 6.66 4.97 13.91 3.09 21.13 91
Dieldrin 1.97 3.61 5.95 8.38 3.68 6.24 7.58 5.84 91
Endosulfan 3.20 3.62 4.56 11.39 1.90 2.56 4.05 7.59 90
Endrin 7.94 4.51 1.00 9.18 4.81 3.97 2.39 8.54 88
Heptachlor 13.72 1.74 1.92 8.93 5.05 4.30 3.12 9.97 97
Heptachlor epoxide 3.22 7.56 2.64 3.66 8.36 3.67 6.66 3.77 102
Hexachlorobenzene 5.90 0.69 3.43 8.83 7.89 1.70 3.43 9.22 86
Lindane 1.16 2.63 3.89 6.33 1.90 2.76 3.99 4.97 105
Methoxychlor 5.87 0.30 3.02 5.44 7.54 1.30 3.42 7.64 77
λ-Cyhalothrin 18.05 19.03 8.86 9.50 12.92 8.61 13.43 10.93 102
Cypermethrin 14.47 3.11 15.26 9.62 17.91 4.88 17.08 13.30 107
Deltamethrin 15.45 10.73 2.00 5.94 14.63 12.02 6.46 11.78 91
Permethrin 1.55 7.66 0.46 3.00 8.11 6.38 9.79 9.86 91
in the concentration ranges presented in Table 2. The correlation coefficients of the linear regression for the relationship between peak areas and spiking concentrations are above 0.99 for all the analytes.
The repeatability of the method, expressed as relative standard deviation, coefficient of variation (CV) was calculated for three replicates at four different concentrations. For each level (LOQ, 2 LOQ, 5 LOQ and 10 LOQ), intra-day tests were performed. The values varied from 0.46 (permethrin at 5.0 µg L-1) to 19.03% (λ-cyhalothrin at
0.6 µg L-1). The intermediate precisions were evaluated at
four different concentration levels, and were equal to one, two, five and ten times the LOQ value of each analyte. For each level, tests were performed in triplicate on three nonconsecutive days. The CV values for intermediate precision are lower than 17.91%. All the CV values for precision (repeatability and intermediate precision) are lower than 20%, the acceptable limit according to the US EPA.66
To evaluate the performance of the method using the matrix of interest, recovery tests were performed. These
tests were performed using drinking water samples spiked (previously analyzed to assure the absence of the target pesticides) with pyrethroids at concentrations equal to 8.0 µg L-1 and organochlorine concentrations between
0.2 and 0.8 µg L-1. The samples were submitted to the
developed method and the concentrations of each analyte were calculated by obtained equations by linear regression of the respective calibration curves. The recoveries were determined by comparing the relative concentrations found with spiking concentrations. The obtained values ranged between 71 and 107%, and therefore, are within the acceptable range of 70 to 130%.66
The evaluated parameters indicate the good performance of the analytical method proposed for the analyses of pyrethroids and organochlorines in water.
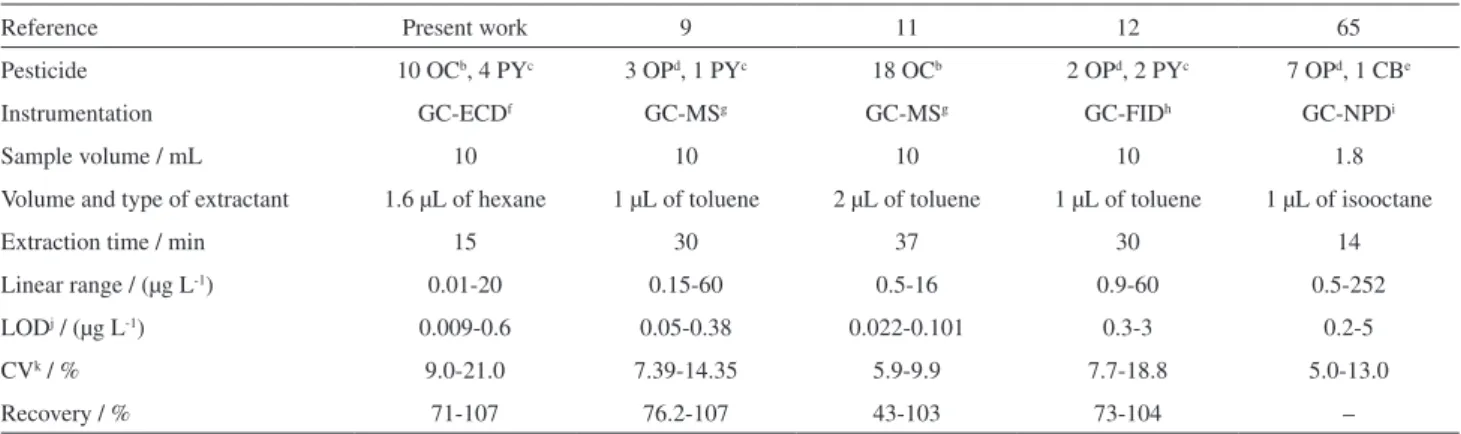
The proposed method can be compared with other alternatives based on microextraction techniques. Table 4 summarizes the main analytical information of the reported SDME methods for the determination of pesticides in water samples. The limits of detection are either comparable to or better than those reported elsewhere, being the proposed one a little bit more sensitive for some pesticides. Similar results of CV and recovery levels were obtained in other studies using SDME GC-MS, SDME GC-FID and SDME GC-NPD. Additionally, the total time analysis of 40.0 min is shorter than those obtained in other studies that used SDME GC-NPD (46.5 min),67 SDME GC-FID (53.33 min),24 SDME GC-MS
(> 50 min),21,23 and SDME GC-FPD (75 min).57
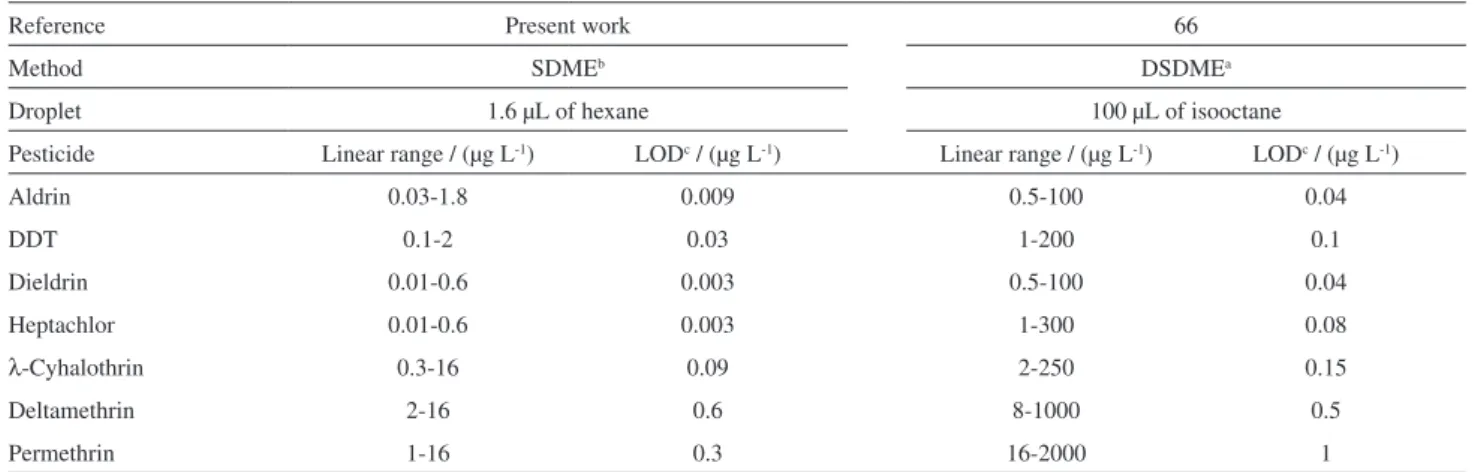
Table 5 compares the same pesticides analyzed by the proposed method and by another similar based on directly suspended droplet microextraction (DSDME) recently published.68 Our proposed method is more sensitive than
the other one. Besides this, our proposed method presents the best limits of detection for the same analyzed pesticides in both methods.
Figure 8. Chromatogram obtained from the analyses of drinking water.
Table 4. Comparison of the proposed method with other SDMEa developed methods for the determination of pesticides in water
Reference Present work 9 11 12 65
Pesticide 10 OCb, 4 PYc 3 OPd, 1 PYc 18 OCb 2 OPd, 2 PYc 7 OPd, 1 CBe
Instrumentation GC-ECDf GC-MSg GC-MSg GC-FIDh GC-NPDi
Sample volume / mL 10 10 10 10 1.8
Volume and type of extractant 1.6 µL of hexane 1 µL of toluene 2 µL of toluene 1 µL of toluene 1 µL of isooctane
Extraction time / min 15 30 37 30 14
Linear range / (µg L-1) 0.01-20 0.15-60 0.5-16 0.9-60 0.5-252
LODj / (µg L-1) 0.009-0.6 0.05-0.38 0.022-0.101 0.3-3 0.2-5
CVk / % 9.0-21.0 7.39-14.35 5.9-9.9 7.7-18.8 5.0-13.0
Recovery / % 71-107 76.2-107 43-103 73-104 –
Table 5. Comparison of the proposed method with another DSDMEa developed method for the determination of pesticides
Reference Present work 66
Method SDMEb DSDMEa
Droplet 1.6 µL of hexane 100 µL of isooctane
Pesticide Linear range / (µg L-1) LODc / (µg L-1) Linear range / (µg L-1) LODc / (µg L-1)
Aldrin 0.03-1.8 0.009 0.5-100 0.04
DDT 0.1-2 0.03 1-200 0.1
Dieldrin 0.01-0.6 0.003 0.5-100 0.04
Heptachlor 0.01-0.6 0.003 1-300 0.08
λ-Cyhalothrin 0.3-16 0.09 2-250 0.15
Deltamethrin 2-16 0.6 8-1000 0.5
Permethrin 1-16 0.3 16-2000 1
aDSDME: directly suspended droplet microextraction; bSDME: single drop microextraction; cLOD: limit of detection of the method.
Analyses of water samples
The proposed technique was applied to the determination of four pyrethroids and ten organochlorines in drinking water collected from three points of the distribution network of the Water Treatment Station of the Universidade Federal de Viçosa (Viçosa city, Minas Gerais State, Brazil). The results for drinking water showed that they were free of pyrethroids and organochlorine pesticide contaminations.
Conclusions
The SDME technique associated with gas chromatography is suitable to determine organochlorine and pyretroid pesticides in drinking water. Considering the drastic reduction in the volume of the solvent used and the integration between the extraction/concentration and injection, this protocol may be a useful tool for routine checking of the levels of pesticides present in water destined for human consumption. The present SDME-GC-ECD method has demonstrated to be accurate, precise and linear over a wide range with the advantage of being rapid, simple and to require smaller volumes of organic solvent. The proposed method may be successfully applied to the drinking water monitoring.
Acknowledgments
The authors would like to acknowledge Prof. Cláudio Ferreira Lima for his technical support, and the Fundação de Amparo à Pesquisa do Estado de Minas Gerais (FAPEMIG; PPM 440-09) and the Conselho Nacional de Desenvolvimento Científico e Tecnológico (CNPq; 578201/2008-9) for their financial support.
References
1. Zhang, M.; Huang, J.; Wei, C.; Yu, B.; Yang, X.; Chen, X.; Talanta2008, 74, 599.
2. World Health Organization (WHO); Guidelines for Drinking-Water Quality; WHO Press: Geneva, Switzerland, 2008, available at http://www.who.int/water_sanitation_health/dwq/ fulltext.pdf accessed in May 2013.
3. Lazar, B.; Maslov, L.; Romanic, S. H.; Gracan, R.; Krauthacker, B.; Holcer, D.; Tvrtkovic, N.; Chemosphere2011, 82, 121.
4. Ip, H.; Arch. Environ. Contam. Toxicol.1990, 19, 291. 5. Dogheim, S. M.; Gad Alla, S. A.; Almaz, M. M.; Salama, E. Y.;
J. AOAC Int.1996, 79, 949.
6. Zhou, P.; Wu, Y.; Yin, S.; Li, J.; Zhao, Y.; Zhang, L.; Chen, H.; Liu, Y.; Yang, X.; Li, X.; Environ. Pollut.2011, 159, 524. 7. Wong, S. K.; Lee, W.; J. AOAC Int.1997, 80, 1332.
8. Zhong, W.; Xu, D.; Chaj, Z.; Mao, X.; Food Addit. Contam., Part A2003, 20, 254.
9. Mueller, J. F.; Harden, F.; Toms, L.-M.; Symons, R.; Fürst, P.; Chemosphere2008, 70, 712.
10. Rojas-Squella, X.; Santos, L.; Baumann, W.; Landaeta, D.; Jaimes, A.; Correa, J. C.; Sarmiento, O. L.; Ramos-Bonilla, J. P.; Chemosphere2013, 91, 733.
11. Cruz, S.; Lino, C.; Silveira, M. I.; Sci. Total Environ.2003, 317, 23.
12. Ministério da Saúde (MS); Proíbe a Comercialização, o Uso e a Distribuição dos Produtos Agrotóxicos Organoclorados, Portaria No. 329, 2 setembro 1985, DOU, Brasil, 1985, available at http://www.vieiracastro.com.br/legislacao/Portaria%20 MA%20n%C2%BA%20329-85.pdf accessed in March 2013. 13. Delgado, I. F.; Barretto, H. H. C.; Kussumi, T. A.; Alleluia, I. B.;
Baggio, C. D. A.; Paumgartten, F. J. R.; Cadernos de Saúde Pública2002, 18, 519.
14. Chagas, C. M.; Queiroz, M. E. L. R.; Neves, A. A.; de Queiroz, J. H.; Oliveira, T. T. D.; Nagem, T. J.; Quim. Nova1999, 22,
15. Ministério da Saúde (MS); Procedimentos de Controle e de Vigilância da Qualidade da Água para Consumo Humano e seu Padrão de Potabilidade, Portaria No. 2914, 12 Dezembro 2011, DOU, Brasil, 2011, available at http://www.comitepcj. sp.gov.br/download/Portaria_MS_2914-11.pdf accessed in March 2012.
16. Wardencki, W.; Curylo, J.; Namiesnik, J.; J. Biochem. Bioph. Methods2007, 70, 275.
17. Carlos, E. A.; Neves, A. A.; Reis, C.; Queiroz, M. E. L. R.; Quim. Nova2011, 34, 272.
18. Beceiro-González, E.; Concha-Graña, E.; Guimaraes, A.; Gonçalves, C.; Muniategui-Lorenzo, S.; Alpendurada, M. F.; J. Chromatogr., A2007, 1141, 165.
19. Dong, C.; Zeng, Z.; Yang, M.; Water Res.2005, 39, 4204.
20. Komatsu, E.; Vaz, J. M.; Quim. Nova2004, 27, 720.
21. Pinheiro, A. S.; da Rocha, G. O.; de Andrade, J. B.; Microchem. J.2011, 99, 303.
22. Amvrazi, E. G.; Tsiropoulos, N. G.; J. Chromatogr., A2009,
1216, 2789.
23. Cortada, C.; Vidal, L.; Tejada, S.; Romo, A.; Canals, A.; Anal. Chim. Acta 2009, 638, 29.
24. Pinheiro, A. S.; de Andrade, J. B.; Talanta2009, 79, 1354.
25. Romero, J.; López, P.; Rubio, C.; Batlle, R.; Nerín, C.; J. Chromatogr., A2007, 1166, 24.
25. Xiao, Q.; Hu, B.; Yu, C.; Xia, L.; Jiang, Z.; Talanta2006, 69, 848.
26. Lambropoulou, D. A.; Psillakis, E.; Albanis, T. A.; Kalogerakis, N.; Anal. Chim. Acta 2004, 516, 205.
28. Miller, K. E.; Synovec, R. E.; Talanta2000, 51, 921. 29. Jeannot, M. A.; Przyjazny, A.; Kokosa, J. M.; J. Chromatogr., A
2010, 1217, 2326.
30. Andruch, V.; Kocúrová, L.; Balogh, I. S.; Škrlíková, J.; Microchem. J.2012, 102, 1.
31. Jain, A.; Verma, K. K.; Anal. Chim. Acta 2011, 706, 37.
32. Pakade, Y. B.; Tewary, D. K.; J. Sep. Sci.2010, 33, 3683. 33. Pavón, J. L. P.; Martín, S. H.; Pinto, C. G.; Cordero, B. M.;
Anal. Chim. Acta 2008, 629, 6.
34. Xu, L.; Basheer, C.; Lee, H. K.; J. Chromatogr., A2007, 1152,
184.
35. Psillakis, E.; Kalogerakis, N.; TrAC, Trends Anal. Chem. 2003,
22, 565.
36. Psillakis, E.; Kalogerakis, N.; TrAC, Trends Anal. Chem. 2002,
21, 54.
37. Lord, H.; Pawliszyn, J.; J. Chromatogr., A2000, 902, 17.
38. Jeannot, M. A.; Cantwell, F. F.; Anal. Chem.1996, 68, 2236. 39. Xiao, Q.; Hu, B.; He, M.; J. Chromatogr., A2008, 1211, 135.
40. Rincón, A. A.; Pino, V.; Ayala, J. H.; Afonso, A. M.; Talanta
2011, 85, 1265.
41. Gioti, E. M.; Skalkos, D. C.; Fiamegos, Y. C.; Stalikas, C. D.; J. Chromatogr., A2005, 1093, 1.
42. López-Jiménez, F. J.; Rubio, S.; Pérez-Bendito, D.; J. Chromatogr., A2008, 1195, 25.
43. Liang, P.; Liu, R.; Cao, J.; Microchim. Acta2008, 160, 135. 44. Nazari, S.; Microchem. J.2008, 90, 107.
45. Xia, L.; Hu, B.; Jiang, Z.; Wu, Y.; Liang, Y.; Anal. Chem.2004, 76, 2910.
46. Amjadi, M.; Manzoori, J. L.; Abulhassani, J.; J. AOAC Int.2010, 93, 985.
47. Pena, F.; Lavilla, I.; Bendicho, C.; Spectrochim. Acta, Part B
2008, 63, 498.
48. Goudarzi, N.; J. Agric. Food Chem.2009, 57, 1099.
49. Sharma, N.; Pillai, A. K. K. V.; Pathak, N.; Jain, A.; Verma, K. K.; Anal. Chim. Acta 2009, 648, 183.
50. Pranaityté, B.; Jermak, S.; Naujalis, E.; Padarauskas, A.; Microchem. J.2007, 86, 48.
51. Sun, X.; Miao, Z.; Yuan, Z.; Harrington, P. B.; Colla, J.; Chen, H.; Int. J. Mass Spectrom.2011, 301, 102.
52. Pedersen-Bjergaard, S.; Rasmussen, K. E.; J. Chromatogr., B
2005, 817, 3.
53. Bagheri, H.; Khalilian, F.; Anal. Chim. Acta 2005, 537, 81.
54. Psillakis, E.; Kalogerakis, N.; J. Chromatogr., A2001, 907, 211. 55. Jeannot, M. A.; Cantwell, F. F.; Anal. Chem.1997, 69, 235.
56. Aguilera-Herrador, E.; Lucena, R.; Cárdenas, S.; Valcárcel, M.; J. Chromatogr., A2008, 1209, 76.
57. Ahmadi, F.; Assadi, Y.; Hosseini, S. M. R. M.; Rezaee, M.; J. Chromatogr., A2006, 1101, 307.
58. Tor, A.; Aydin, M. E.; Anal. Chim. Acta 2006, 575, 138. 59. Zhao, L.; Lee, H. K.; J. Chromatogr., A2001, 919, 381.
60. de Jager, L. S.; Andrews, A. R. J.; Analyst2000, 125, 1943. 61. He, Y.; Lee, H. K.; Anal. Chem.1997, 69, 4634.
62. López-Blanco, M. C.; Blanco-Cid, S.; Cancho-Grande, B.; Simal-Gándara, J.; J. Chromatogr., A2003, 984, 245.
63. Theis, A. L.; Waldack, A. J.; Hansen, S. M.; Jeannot, M. A.; Anal. Chem.2001, 73, 5651.
64. Amvrazi, E. G.; Tsiropoulos, N. G.; J. Chromatogr., A2009, 1216, 7630.
65. International Conference on Harmonisation (ICH); Validation of Analytical Procedures: Text and Methodology, Q2(R1); ICH: Geneva, Switzerland, 2005, available at http://www.ich. org/products/guidelines/quality/article/quality-guidelines.html accessed in May 2012.
66. Tolosa, I.; Readman, J. W.; Mee, L. D.; J. Chromatogr., A1996,
725, 93.
67. López-Blanco, C.; Gómez-Álvarez, S.; Rey-Garrote, M.; Cancho-Grande, B.; Simal-Gándara, J.; Anal. Bioanal. Chem.
2005, 383, 557.
68. Liu, D.; Min, S.; J. Chromatogr., A2012, 1235, 166.