Short Report
S
J. Braz. Chem. Soc., Vol. 22, No. 1, 179-186, 2011.Printed in Brazil - ©2011 Sociedade Brasileira de Química 0103 - 5053 $6.00+0.00
*e-mail: [email protected]
Inluence of Wavelet Transform Settings on NIR and MIR Spectrometric Analyses
of Diesel, Gasoline, Corn and Wheat
Luiz Alberto Pinto,a Roberto K. H. Galvãoa and Mário César U. Araújo*,b
aInstituto Tecnológico de Aeronáutica, Divisão de Engenharia Eletrônica,
12228-900 São José dos Campos-SP, Brazil
bUniversidade Federal da Paraíba, CCEN, Departamento de Química, CP 5093,
58051-970 João Pessoa-PB, Brazil
Este artigo investiga a inluência da família e comprimento da wavelet, bem como do número de níveis de resolução, sobre o desempenho de modelos obtidos por calibração multivariada no domínio wavelet. Vinte e uma propriedades físicas e químicas de amostras de diesel, gasolina, milho e trigo foram determinadas por espectrometria no infravermelho médio e próximo empregando mínimos-quadrados parciais (PLS) e regressão por passos (SR) nos domínios original e wavelet. Mediante seleção adequada dos parâmetros da transformada wavelet, reduções médias de 8,2% (PLS) e 27,0% (SR) foram obtidas para o RMSEP em relação ao domínio original. Contudo, os modelos SR apresentaram expressiva sensibilidade à escolha dos parâmetros da transformada. Neste caso, uma análise de variância indicou que o número de níveis de resolução é o fator mais importante a ser considerado.
This paper investigates the inluence of wavelet family, length and number of resolution levels on the performance of multivariate calibration models obtained in the wavelet domain. Twenty-one physical and chemical properties of diesel, gasoline, corn and wheat were determined by near/ mid infrared spectrometry employing partial least-squares (PLS) and stepwise regression (SR) in the original and wavelet domains. Through proper selection of the wavelet transform settings, average RMSEP reductions of 8.2% (PLS) and 27.0% (SR) were obtained with respect to the original domain. However, the SR models presented considerable sensitivity with respect to the choice of transform settings. In this case, an analysis of variance indicated that the number of resolution levels is the most important factor to be considered.
Keywords: multivariate calibration, wavelet transform, analysis of variance, mid and near
infrared spectrometry, food and fuel analysis
Introduction
Over the past two decades, the wavelet transform (WT)1,2 has been employed in a variety of chemometrics
applications such as denoising,3,4 signal compression,5
baseline correction,6 classification7 and multivariate
calibration.8-10 In the context of multivariate calibration,
WT can be used to compress the data set prior to the use of regression techniques such as principal component regression (PCR)11 or partial least squares (PLS).12 Variable
selection algorithms may also be employed to choose an appropriate subset of wavelet coeficients for use with multiple linear regression (MLR).8,13,14
Although several papers have been published on the use of WT for multivariate calibration, the choice of a suitable wavelet for a particular application is still an open problem. In fact, unlike the Fourier transform, which is restricted to the use of sine and cosine basis functions, WT can be implemented with a wide variety of wavelets.2,4 In signal
compression and denoising applications, the choice of wavelet could be guided by the minimum description length (MDL) criterion, as described elsewhere.4 However, such
a criterion does not take into account the x-y relationship between the instrumental responses and the property of interest for multivariate calibration.
Inluence of Wavelet Transform Settings on NIR and MIR Spectrometric Analyses J. Braz. Chem. Soc.
180
within that family.2,4,15 Some authors opted to test several
wavelets and choose the most appropriate one on the basis of the performance of the resulting model.10,16,17 Chalus et
al.,16 for instance, tested the db2, db6 and sym6 wavelets.
Eriksson et al.17 employed db4, sym8 and coif2. Nicolai
et al.10 tested 16 wavelets from the Daubechies (db2, db4,
db6, db8, db10, db18), Symlet (sym2, sym4, sym6, sym8, sym10) and Coiflet (coif1, coif2, coif3, coif4, coif5) families. Other authors only reported the use of a single wavelet in their work, such as sym8,18,19 or db4.9,12
In addition to the choice of wavelet, another issue that may affect the results of multivariate calibration is the number of resolution levels employed in WT.9,16,18,19
However, this aspect has received comparatively little attention from the researchers and has even been omitted in some papers.12,17,20 Therefore, more detailed investigations
concerning this issue would be of value.
The present paper investigates the inluence of wavelet family, length and number of resolution levels on the predictive performance of a multivariate calibration model. More speciically, the investigation is aimed at determining whether such WT settings have a signiicant effect on the result and which setting should deserve more attention from the analyst. For this purpose, four datasets are employed, namely: near-infrared (NIR) absorbance spectra of 170 diesel samples, mid-infrared (MIR) absorbance spectra of 104 gasoline samples, NIR relectance spectra of 80 corn samples and NIR relectance spectra of 100 wheat lour samples. A total of 21 physical and chemical properties are considered. Multivariate calibration is carried out by using PLS, as well as MLR with variable selection by stepwise regression.21
Background
The wavelet transform can be implemented in a computationally efficient manner by using a digital ilter bank algorithm.22 The basic structure of the ilter
bank consists of a pair of low-pass and high-pass ilters, followed by a dyadic downsampling operation.14,15,22 The
downsampled outputs of the low-pass and high-pass ilters are termed approximation and detail coeficients, respectively. The iltering/downsampling operations can be reapplied to the approximation coeficients up to the number
M of decomposition levels speciied by the analyst. The transform result consists of the approximation coeficients at the last level in addition to all detail coeficients. The low-pass and high-pass ilters are typically of inite length, and, therefore, each approximation or detail coeficient corresponds to a section of the original signal. This spatial localization feature is one of the main advantages of WT over the Fourier transform.1,2,15
The most commons wavelet filters employed in multivariate calibration belong to the Daubechies, Symlet and Coilet families.9,10,12,16-19 These families differ by features
such as symmetry and smoothness.15,23 Each family comprises
ilters of different length L. The dbN, symN and coifN ilters have length L = 2N, 2N and 6N, respectively. Parameter N is termed the ilter order. For illustration, Figure 1 presents the Daubechies, Symlet and Coilet low-pass ilters of length 12, 18, 24 and 30. The high-pass ilters are obtained by reversing the corresponding low-pass ilters and changing the sign of every other element of the sequence.14,15
Experimental
Data sets
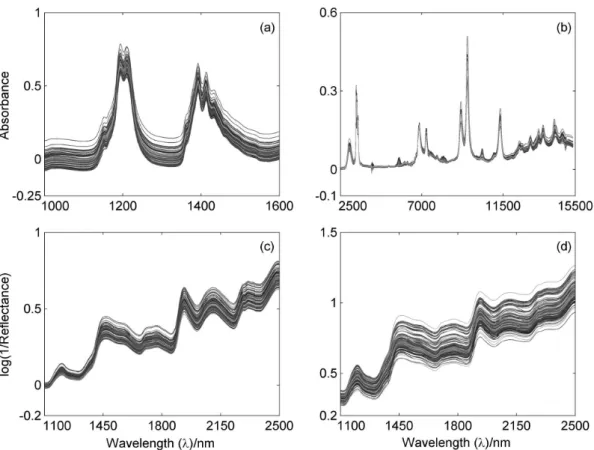
Four data sets were employed in the present investigation. The irst data set consists of NIR absorbance spectra of 170 diesel samples, recorded in the range 1000-1600 nm with resolution of 0.5 nm.24 The second data set comprises MIR
absorbance spectra of 104 gasoline samples in the range 2500-15400 nm with resolution of 2 nm.25 The third data
set is publicly available and consists of NIR relectance spectra of 80 corn samples in the range 1100-2500 nm with resolution of 2 nm.26 Data from instrument “mp5” were
employed. The fourth data set, also publicly available,27
consists of NIR relectance spectra of 100 wheat lour samples in the range 1000-2500 nm with resolution of 2 nm. The spectra of the four data sets are presented in Figure 2.
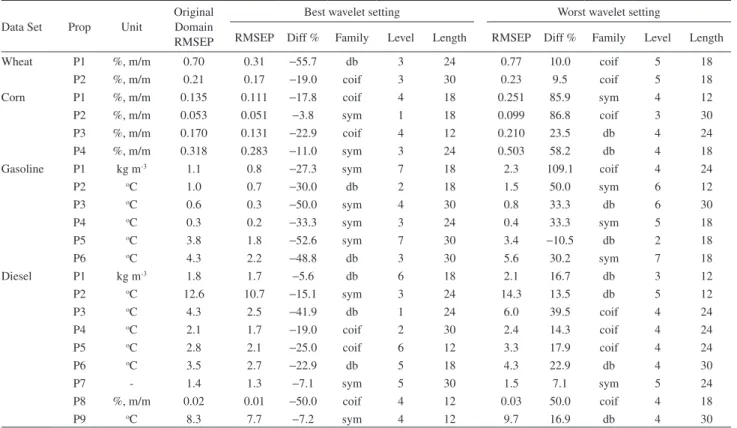
The physical and chemical properties under consideration in each data set are presented in Table 1. Henceforth these properties will be denoted by codes P1-P9.
As can be seen in Figure 2, the spectra display undesirable baseline features. For this reason, irst derivative spectra were calculated by using a Savitzky-Golay ilter,28 with a
2nd order polynomial and an 11 point window. The
resulting spectra, which were used throughout the work, are presented in Figure 3.
Within each data set, 70% of the samples were used for construction of the models. These samples were selected by applying the Kennard-Stone algorithm29 to the derivative
spectra. For PLS calibration, the modelling samples were further divided into a calibration set (50% of the overall dataset) and a validation set (20% of the overall dataset). The remaining 30% of the samples formed a prediction set, which was used to evaluate the performance of the resulting models.
Wavelet transform
ilters, which are the most commonly used in multivariate calibration.9,10,12,16-19 Four ilter lengths were employed,
namely 12, 18, 24 and 30, as shown in Figure 1. Constant extension (“smooth padding of order zero”)23,30 was used
to reduce border effects at the endpoints of the spectra. The number of decomposition levels was varied from one up to the maximum number L for which the spatial localization features of WT are not lost. This limit situation occurs when the wavelet ilters span the entire length of the downsampled approximation coefficients.31 In the Matlab software,
such a maximum number of decomposition levels can be obtained by using function “wmaxlev” from the Wavelet Toolbox. It is worth noting that the maximum number of decomposition levels depends on the ilter length and the number of spectral variables. Table 2 summarizes the WT settings employed in the investigation.
In order to reduce computational workload in the model-building process, a preliminary compression procedure was applied to the wavelet coeficients. Compression was carried out by discarding the smallest wavelet coeficients
(in absolute value) while retaining 99% of explained variance.32
Multivariate calibration
PLS and stepwise regression (SR) were employed to build regression models in the wavelet, as well as in the original domains. For each property, the number of latent variables in PLS was chosen to minimize the root-mean-square error in the validation set. In stepwise regression, the α-entry and α-exit values21 were set to 0.01. The results for each parameter under consideration were evaluated in terms of the root-mean-square error of prediction (RMSEP) deined as
(1)
where and are the reference and predicted parameter values for the ith sample of the prediction set, which
comprises Np samples.
Inluence of Wavelet Transform Settings on NIR and MIR Spectrometric Analyses J. Braz. Chem. Soc.
182
Software
All calculations were performed in Matlab® 6.5 R13 by
using functions from the Wavelet and Statistics Toolboxes, as well as lab-made routines.
Results
Tables 3 and 4 show the PLS and SR results for the original spectral domain, as well as the best and worst results obtained in the wavelet domain. As can be seen,
Table 1. Physical and chemical properties under consideration and their respective range in each data set
Property Data Set
Diesel Gasoline Corn Wheat
P1 Density (kg m
-3) 830-864
Density (kg m-3) 738.3-765.4
Moisture (%, m/m) 9.377-10.993
Moisture (%, m/m) 7.75-14.28
P2 ibp (
oC) 144.2-240.7
ibp (oC) 38.2-43.0
Protein (%, m/m) 3.088-3.832
Protein (%, m/m) 12.45-17.36
P3 T10 (
oC) 186.6-269.9
T10 (oC) 51.3-56.3
Oil (%, m/m) 7.654-9.711
P4 T50 (
oC) 268.9-299.4
T50 (oC) 69.7-73.6
Starch (%, m/m) 62.826-66.472
P5 T85 (
oC) 310.4-366.1
T90 (oC) 150.2-178.4
P6 T90 (
oC) 317.2-385.5
fbp (oC) 179.7-221.0
P7 Cetane index
42.1-57.6
P8 Sulphur (%, m/m)
0.03-0.31
P9 lame point (
oC) 26-100
it is not possible to point out a single wavelet family, level or ilter length that systematically leads to the best or worst outcomes. The Diff columns indicate the percentual difference between the RMSEP values obtained in the original and wavelet domains. In the PLS case, the average difference with respect to the original domain was –8.2% and +9.9% for the best and worst wavelet settings, respectively. For SR, the average differences were –27.0% and +34.2%.
These results indicate that the wavelet transform may indeed be useful to improve the predictive ability of PLS and SR models. However, the SR outcome is more sensitive to the choice of wavelet settings as compared to PLS. Such a inding can be interpreted in two ways. On the one hand, it may be argued that the use of SR in the wavelet domain is risky in that poor results may be obtained given an inadequate choice of WT settings. On the other hand,
the potential gains for SR may be signiicant. In fact, a comparison between Tables 3 and 4 reveals that the best wavelet settings for stepwise regression provide results that are superior, in most cases, to those obtained by PLS (either in the original or wavelet domains).
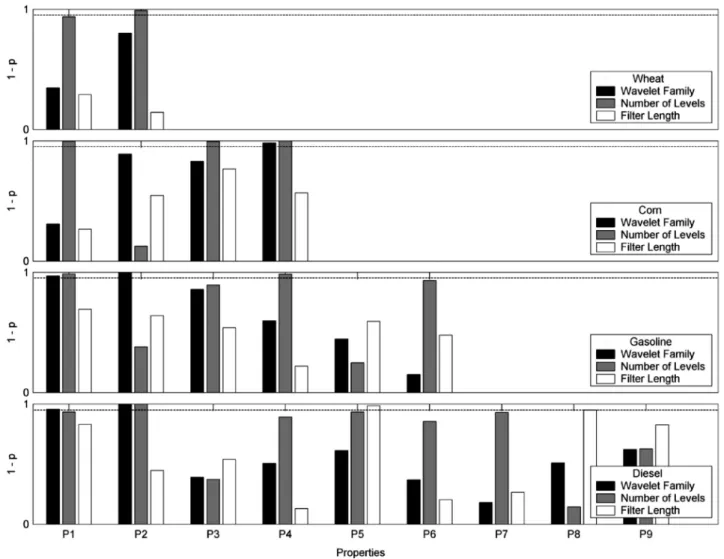
In light of these indings, it can be concluded that the choice of WT settings plays a more important role for SR than it does for PLS. In order to further investigate the inluence of WT settings in the SR outcome, an analysis of variance (ANOVA)33 was carried out for each parameter
under consideration. For this purpose, the RMSEP value was adopted as response variable. The wavelet family (Daubechies, Symlet, Coilet), ilter length (12, 18, 24, 30) and number of resolution levels (one up to the maximum number L) were the factors under analysis.
Figure 4 presents the ANOVA results obtained for each property and factor (WT setting) under consideration.
Figure 3. Derivative spectra of the (a) diesel, (b) gasoline, (c) corn and (d) wheat samples.
Table 2. Wavelet transform settings
Filter length Wavelet family Maximum number of decomposition levels (L)
Daubechies Symlet Coilet Corn spectra Wheat spectra Gasoline spectra Diesel spectra
12 db6 sym6 coif2 5 5 9 6
18 db9 sym9 coif3 5 5 8 6
24 db12 sym12 coif4 4 4 8 5
Inluence of Wavelet Transform Settings on NIR and MIR Spectrometric Analyses J. Braz. Chem. Soc.
184
Table 3. PLS results in the original and wavelet domains
Data Set Prop Unit
Original Domain RMSEP
Best wavelet setting Worst wavelet setting
RMSEP Diff % Family Level Length RMSEP Diff % Family Level Length
Wheat P1 %, m/m 0.36 0.36 0.0 coif 3 18 0.52 44.4 coif 4 18
P2 %, m/m 0.19 0.19 0.0 coif 5 18 0.20 5.3 sym 4 18
Corn P1 %, m/m 0.093 0.087 −6.5 db 4 18 0.151 62.4 db 2 24
P2 %, m/m 0.065 0.064 −1.5 coif 4 12 0.068 4.6 db 5 18
P3 %, m/m 0.154 0.142 −7.8 sym 4 18 0.170 10.4 db 5 18
P4 %, m/m 0.340 0.333 −2.1 sym 3 24 0.413 21.5 sym 4 24
Gasoline P1 kg m-3 1.2 1.1 −8.3 sym 7 24 1.3 8.3 db 4 12
P2 oC 0.8 0.8 0.0 sym 2 30 0.9 12.5 db 4 24
P3 oC 0.6 0.4 −33.3 coif 3 12 0.6 0.0 sym 8 18
P4 oC 0.3 0.3 0.0 db 1 30 0.3 0.0 sym 8 24
P5 oC 2.5 2.2 −12.0 sym 4 24 2.5 0.0 db 2 18
P6 oC 3.1 1.9 −38.7 coif 8 24 3.3 6.5 coif 7 30
Diesel P1 kg m-3 1.8 1.8 0.0 db 5 18 1.9 5.6 coif 6 18
P2 oC 10.3 10.5 1.9 sym 5 24 11.1 7.8 sym 3 30
P3 oC 2.9 2.6 −10.3 db 3 30 2.9 0.0 sym 5 24
P4 oC 1.9 1.9 0.0 db 3 24 2.1 10.5 db 2 12
P5 oC 2.9 2.0 −31.0 db 3 24 2.8 −3.4 coif 4 12
P6 oC 3.2 2.8 −12.5 sym 1 24 3.3 3.1 sym 2 24
P7 - 1.4 1.4 0.0 db 3 18 1.4 0.0 db 5 12
P8 %, m/m 0.02 0.02 0.0 db 5 24 0.02 0.0 coif 2 18
P9 oC 7.5 6.8 −9.3 db 5 18 8.2 9.3 sym 3 18
The percentual difference between the RMSEP values obtained in the original and wavelet domains is indicated in the Diff % columns.
Table 4. Stepwise regression results in the original and wavelet domains
Data Set Prop Unit
Original Domain RMSEP
Best wavelet setting Worst wavelet setting
RMSEP Diff % Family Level Length RMSEP Diff % Family Level Length
Wheat P1 %, m/m 0.70 0.31 −55.7 db 3 24 0.77 10.0 coif 5 18
P2 %, m/m 0.21 0.17 −19.0 coif 3 30 0.23 9.5 coif 5 18
Corn P1 %, m/m 0.135 0.111 −17.8 coif 4 18 0.251 85.9 sym 4 12
P2 %, m/m 0.053 0.051 −3.8 sym 1 18 0.099 86.8 coif 3 30
P3 %, m/m 0.170 0.131 −22.9 coif 4 12 0.210 23.5 db 4 24
P4 %, m/m 0.318 0.283 −11.0 sym 3 24 0.503 58.2 db 4 18
Gasoline P1 kg m-3 1.1 0.8 −27.3 sym 7 18 2.3 109.1 coif 4 24
P2 oC 1.0 0.7 −30.0 db 2 18 1.5 50.0 sym 6 12
P3 oC 0.6 0.3 −50.0 sym 4 30 0.8 33.3 db 6 30
P4 oC 0.3 0.2 −33.3 sym 3 24 0.4 33.3 sym 5 18
P5 oC 3.8 1.8 −52.6 sym 7 30 3.4 −10.5 db 2 18
P6 oC 4.3 2.2 −48.8 db 3 30 5.6 30.2 sym 7 18
Diesel P1 kg m-3 1.8 1.7 −5.6 db 6 18 2.1 16.7 db 3 12
P2 oC 12.6 10.7 −15.1 sym 3 24 14.3 13.5 db 5 12
P3 oC 4.3 2.5 −41.9 db 1 24 6.0 39.5 coif 4 24
P4 oC 2.1 1.7 −19.0 coif 2 30 2.4 14.3 coif 4 24
P5 oC 2.8 2.1 −25.0 coif 6 12 3.3 17.9 coif 4 24
P6 oC 3.5 2.7 −22.9 db 5 18 4.3 22.9 db 4 30
P7 - 1.4 1.3 −7.1 sym 5 30 1.5 7.1 sym 5 24
P8 %, m/m 0.02 0.01 −50.0 coif 4 12 0.03 50.0 coif 4 18
P9 oC 8.3 7.7 −7.2 sym 4 12 9.7 16.9 db 4 30
The effect of a given factor on RMSEP is signiicant if the resulting p-value is small.33 It is worth noting that the
vertical axis in Figure 4 corresponds to (1 – p). Therefore, signiicant effects are indicated by large bars.
As can be seen, in 11 out of the 21 properties, at least one factor displayed a signiicant effect at a conidence level of 95% (horizontal dashed line in Figure 4). This result again indicates that the choice of appropriate WT settings is indeed important in the SR framework. It is interesting to notice that most signiicant effects are associated to the number of resolution levels, rather than wavelet family or ilter length. In fact, the number of decomposition levels had a signiicant effect in seven properties, as compared to ive properties for wavelet family and only two properties for filter length. In addition, it is worth noting that the number of levels was the most inluential factor in 12 out of the 21 properties. Therefore, one may recommend that the analyst should pay special attention to the choice of resolution levels when building the SR model in the wavelet domain.
Figure 4. ANOVA results (1 – p) for stepwise regression. The dashed line represents the 95% signiicance level.
Conclusions
This paper investigated the inluence of three WT settings (wavelet family, ilter length and resolution levels) on the predictive performance of PLS and SR models for NIR/MIR spectrometric analyses of diesel, gasoline, corn and wheat. A total of 21 physical and chemical properties were considered in this study.
Inluence of Wavelet Transform Settings on NIR and MIR Spectrometric Analyses J. Braz. Chem. Soc.
186
Acknowledgments
This work was partially supported by CAPES (PROCAD Grant 0081/05-1) and CNPq (research fellowships). The authors are also indebted to Dr. Fernanda Araújo Honorato and Mr. Gledson Emídio José for providing the gasoline and diesel data sets, respectively.
References
1. Alsberg, B. K.; Woodward, A. M.; Kell, D. B.; Chemom. Intell. Lab. Syst. 1997, 37, 215.
2. Walczak, B.; Wavelets in Chemistry, Elsevier Science: New York, 2000.
3. Galvão, R. K. H.; Filho, H. A. D.; Martins, M. N.; Araújo, M. C. U.; Pasquini, C.; Anal. Chim. Acta 2007, 581, 159. 4. Cai, C. S.; Harrington, P. D.; J. Chem. Inf. Comput. Sci. 1998,
38, 1161.
5. Walczak, B.; Massart, D. L.; Chemom. Intell. Lab. Syst. 1997,
36, 81.
6. Shao, X.; Cai, W.; Pan, Z.; Chemom. Intell. Lab. Syst. 1999, 45,
249.
7. Donald, D.; Coomans, D.; Yvetty, E.; Cozzolino, D.; Gishen, M.; Hancock, T.; Chemom. Intell. Lab. Syst. 2006, 82, 122. 8. Galvão, R. K. H.; José, G. E.; Dantas Filho, H. A.; Araújo, M.
C. U.; Silva, E. C.; Paiva, H. M.; Saldanha, T. C. B.; Souza, E. S. O. N.; Chemom. Intell. Lab. Syst. 2004, 70, 1.
9. Díez, I. E.; Sáiz, J. M. G.; Pizarro, C.; Anal. Chim. Acta 2004,
515, 31.
10. Nicolai, B. M.; Theron, K. I.; Lammertyn, J.; Chemom. Intell. Lab. Syst. 2007, 85, 243.
11. Vogt, F.; Tacke, M.; Chemom. Intell. Lab. Syst. 2001, 59, 1. 12. Trygg, J.; Wold, S.; Chemom. Intell. Lab. Syst. 1998, 42, 209. 13. Brown, P. J.; Fearn, T.; Vannucci, M.; J. Am. Stat. Assoc. 2001,
96, 398.
14. Coelho, C. J.; Galvão, R. K. H.; Araújo, M. C. U.; Pimentel, M. F.; Silva, E. C.; Chemom. Intell. Lab. Syst. 2003, 66, 205. 15. Strang, G.; Nguyen, T.; Wavelet and Filter Banks, Cambridge
Press: Wellesley, 1996.
16. Chalus, P.; Walter, S.; Ulmschneider, M.; Anal. Chim. Acta
2007, 591, 219.
17. Eriksson, L.; Trygg, J.; Johansson, E.; Bro, R.; Wold, S.; Anal. Chim. Acta 2000, 420, 181.
18. Alsberg, B. K.; Woodward, A. M.; Winson, M. K.; Rowland, J. J.; Kell, D. B.; Anal. Chim. Acta 1998, 368, 29.
19. Tan, H.; Brown, S. D.; Anal. Chim. Acta 2003, 490, 291. 20. Jetter, K.; Depczynski, U.; Molt, K.; Niemöller, A.; Anal. Chim.
Acta 2000, 420, 169.
21. Draper, N. R.; Smith, H.; Applied Regression Analysis, 3rd ed., Wiley: New York, 1998.
22. Mallat, S. G.; IEEE Transaction on Pattern Analysis and Machine Intelligence 1989, 11, 674.
23. The Mathworks; Matlab 6.5 User’s Guide, Natick, MA, USA. 24. Galvão, R. K. H.; Araújo, M. C. U. In Comprehensive
Chemometrics; Brown, S.; Tauler, R.; Walzack, R., eds., Elsevier: Oxford, 2009, vol. 3, pp. 233-283.
25. Honorato, F. A.; Galvão, R. K. H.; Pimentel, M. F.; Barros Neto, B.; Araújo, M. C. U.; Carvalho, F. R.; Chemom. Intell. Lab. Syst. 2005, 76, 65.
26. http://software.eigenvector.com/Data/Corn/index.html, accessed in December 2007.
27. ftp://ftp.clarkson.edu/pub/hopkepk/Chemdata/Kalivas, accessed in December 2007.
28. Beebe, K. R.; Pell, R. J.; Seasholtz, B.; Chemometrics - A Practical Guide, Wiley: New York, 1998.
29. Kennard, R. W.; Stone, L. A.; Technometrics 1969, 11, 137. 30. Santos, R. N. F.; MSc Dissertation, Instituto Tecnológico de
Aeronáutica, São José dos Campos, Brasil, 2006.
31. Santos, R. N. F.; Galvão, R. K. H.; Araújo, M. C. U.; Silva, E. C.; Talanta 2007, 71, 1136.
32. Pontes, M. J. C.; Cortez, J.; Galvão, R. K. H.; Pasquini, C.; Araújo, M. C. U.; Coelho, R. M.; Chiba, M. K.; Abreu, M. F.; Madari, B. E.; Anal. Chim. Acta 2009, 642, 12.
33. Massart, D. L.; Vandeginste, B. G. M.; Buydens, L. C. C., Lewi, D. J.; Verbeke, J. E.; Handbook of Chemometrics and Qualimetrics - Part A, Elsevier: Amsterdam, 1997.
Submitted: April 30, 2009 Published online: August 17, 2010