Brazilian Journal of Physics, vol. 34, no. 4B, December, 2004 1583
Plasma Characterization of Pulsed-Laser Ablation Process
Used for Fullerene-like CNx Thin Film Deposition
H. Riascos
1,2, G. Zambrano
2, and P. Prieto
21
Departamento de F´ısica, Universidad Tecnol´ogica de Pereira, Pereira, Colombia
2
Departamento de F´ısica, Universidad del Valle, Cali, Colombia
Received on 14 January, 2004; revised version received on 21 April, 2004
Anin situOptical Emission Spectroscopy (OES) characterization was performed on Pulsed-Laser Ablation (PLA) process used for fullerene-like CNx thin film deposition at nitrogen pressures within the 5 – 100 mTorr range. Plumes were generated by ablation of pyrolytic graphite (99.99%) target using a (500 mJ, 7 ns, 1064 nm) Nd: YAG-pulsed laser. The spectra from the plume show, essentially, the presence of the band heads of CN Violet vibrational/rotational B2Σ+
- X2Σ+
system and the characteristic C2emission lines, belonging to
the Swan A3Π g- X’
3Π
usystem. These excited CN and C2molecules were generated by laser ablation and by
collisions of the plume with the substrate surface. Their vibrational temperatures were strongly dependent on nitrogen pressure during the deposition process and presented a decrease between 2.64 and 1.23 eV, as pressure increased from 5 to 100 mTorr. Synthesis of fullerene-like structures required high molecular temperatures at the condensation surface. High concentrations of CN radicals in the plasma promoted nitrogen incorporation into the films. The OES plasma characterization allowed for a correlation of the concentration and vibrational temperatures of CN and C2 species present in the plasma with the fullerene-like CNx film composition and
bonding, determined by XPS, IR, and Raman spectroscopy.
1
Introduction
Pulsed Laser Deposition (PLD) technique has attracted much attention in recent years for the synthesis of thin films of different materials, such as: high temperature supercon-ductors, ferroelectrics, nitride and metal compounds, and fullerene carbon molecules. On the other hand, because the average energy of laser-ablated species is much higher than kT and a certain fraction of these species is ionized, it is possible to form metastable phases such as diamond-like carbon (DLC) and fullerene-diamond-like amorphous carbon ni-tride, CNx, materials from a graphite target in nitrogen at-mospheres [1,3]. For this reason, laser-ablated carbon plu-mes have been widely characterized. Since the dynamic behaviour of species in the laser-ablated plasma plume af-fects the characteristic of deposited thin films, many publi-cations aim to understand the PLD process and the correla-tion between composicorrela-tion, structure, and properties of de-posited films, plasma parameters, and chemical state of spe-cies present in the plasma [1-3]. Different techniques such as Optical Emission Spectroscopy (OES) [1,3,4], time-of-flight mass spectroscopy [1,3,5], laser-induced fluorescence spectroscopy [6], interferometry [7], and Langmuir probe method [8] have been used in order to understand and con-trol the deposition process. Among the various diagnostic techniques, which are convenient tools in the detection of different chemical species, the OES has remarkable advanta-ges appertaining to high spatial and temporal resolution for
in situcharacterization without perturbation of the plasma. From the intensities and contour forms of the observed
emis-sion spectra in the OES, useful plasma parameters such as: electron temperature and density [9], kinetic energy of abla-ted species, and vibrational temperature of molecules can be estimated [1-4]. This work analyzes plasma chemistry, physics, and vibrational temperature of CN and C2 species present in the plume close to the target surface. Results per-mit a possible optimization of plasma ionization and mole-cular excitation for fullerene-like CNxthin film deposition
at different nitrogen pressures.
2
Experimental details
The experimental set up is shown in Fig. 1. CNx films were deposited by pulsed-laser ablation of high purity (99.99%) pyrolytic graphite target in a nitrogen atmosphere using an INDI-30 Spectra-Physic Q-switched Nd YAG-pulsed laser (energy 500 mJ, wavelength 1064 nm, and pulsed width 7 ns) operated at 10 Hz. Laser-ablated carbon fragments were deposited onto silicon substrates and combined with active nitrogen species present in the plasma. Films were deposi-ted at a substrate temperature near 3000
C. The target was placed 25 mm from the substrate and oriented 450
with res-pect to the substrate. The vacuum chamber was evacuated down to an approximate pressure of 2x10⁻⁴
mTorr, before each deposition. Nitrogen gas pressure was varied in the 5-100 mTorr range. The angle of laser incidence on the target was 450
and focused onto such by means of a glass lens to give fluency around 10 - 12 J/cm2
1584 H. Riascoset al.
Figure 1. Experimental Setup: M-monochromator, OF-optical fiber, L-focusing lens T-target, S-substrate, TB-turbomolecular pump.
Plasma chemistry was determined by spectroscopy analysis of the emitted light. Optical emission from the abla-tion plasma plume, generated by the Nd YAG laser irradia-tion of the carbon target in nitrogen, was collected by a bun-dled optical fiber (diameter 2 mm) placed outside the quartz window, approximately 20 cm from the target surface, and fixed in such manner as to permit detection of the maximum light emission. The 4:1 ratio corresponding to the observed area of the plasma plume and images, gives a spatial reso-lution of 4 mm in diameter. The other end of the fiber is coupled to the entrance slit of a 0.55 m spectrograph (Triax 550, Jobin Yvon-Spex, f/6.4) equipped with a CCD camera for multi-channel detection and a 1200 l/mm grid with spec-tral resolution of 0.025 nm. The grid was moved in 20 nm sequences and the collected spectra were “assembled” to ob-tain a spectra in the 300-700 nm range.
3
Results and discussion
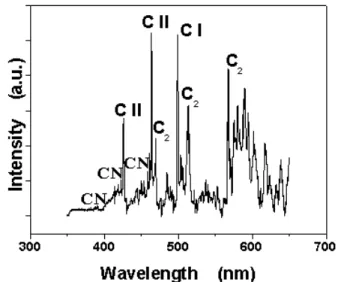
Characteristic emission spectra collected over 350-650 nm during the laser ablation of graphite at 12 J/cm2 and 30 mTorr of nitrogen background pressure is illustrated in Fig. 2. The emission sampling point was nearly 1 cm away from the target and spectra collection time was 1 s, providing integration over several complete laser ablation events at the laser repetition rate of 10 Hz. In Fig. 2 we observe that emis-sion spectra at 30 mTorr is dominated by very strong pe-aks of excited neutral, C(I), and single ionized, C(II), atoms. Additionally, we evidence much weaker CN emission lines of band heads from the Violet vibration/rotational B2Σ+
-X2
Σ+
system, characteristic for carbon plasma in the pre-sence of reactive nitrogen [1-4,10]. The most dominant CN sequences had head positions at 385-391 and 415-422 nm. Another result was the detection of C2 molecular species in the nitrogen atmosphere, evidenced from characteristic emission lines belonging to the Swan A3Πg- X’3Πusystem.
Detection of C2molecules is related to plume thermalization caused by collisions with background nitrogen molecules, promoting recombination of C to form C2[11]. Fullerene-like CNx films have predominantly graphite-Fullerene-like structures and require sp2
electron hybridization. Plume thermaliza-tion and a greater availability of C2species provide a large
fraction of sp2 hybridization as opposed to sp3 hybridiza-tion, also observed in high-quality DLC films produced from laser plumes in PLD processes.[2].
Figure 2. Typical optical emission spectrum of the plume of graphite ablation in nitrogen atmosphere at 30 mTorr and 3.03 x 10⁹Watts/cm2.
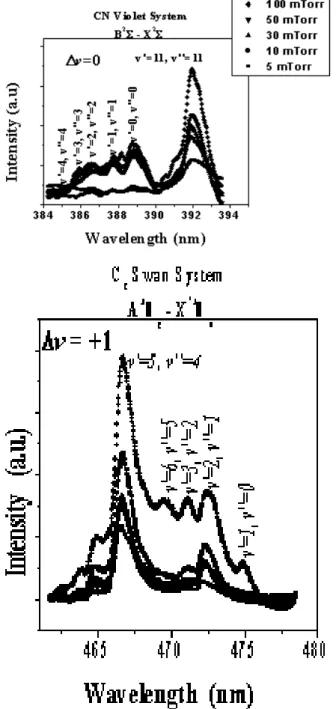
The expanded spectra near the violet band emission of the CN molecule (B2Σ+
- X2Σ+)
and the C2 Swam band emission (A3Π
g- X’3Πu), are shown in Figs. 3a and 3b. As
illustrated in these figures, the CN∆ν = 0 sequence is de-graded to the UV with its (0,0), (1,1), (2,2), (3,3), and (4,4) vibrational transitions; while the 382-390 nm range and the bands of the C2Swan system∆ν= +1 is degraded to the red with its (1,0), (2,1), (3,2), (5,4), and (6,5), dominating the spectral region from 460 to 480 nm. The observed emission lines are identified using the information consigned in Ref. 3. The variation of the emission intensities of 391.1 (11,11), 388.34 (0,0), and 387.14 (1,1) nm lines associated to the CN Violet system, and 467.8 (5,4), 471.5 (2,1) nm lines from the Swan system, and C++∗
464.7 nm line, are observed, in Figs. 4a and 4b, for nitrogen pressure up to 5 mTorr at∼10
J/cm2. The emission intensities of all CN, C2, and C++∗ increase with increased nitrogen pressure. Furthermore, the intensities of C2 lines are stronger than CN molecules, in-dicating that plume thermalization, caused by collisions of C species with background nitrogen molecules promote a larger recombination of C to form C2. This result can be correlated to the N/C ratio of deposited CNx films, calcula-ted using the ratio between the N 1s and C 1s peaks obtai-ned through X-ray Photoemission Spectroscopy (XPS). We found that nitrogen content decreased from 23% to 18%, as pressure was increased from 5 to 30 mTorr [12].
In order to determine formation mechanisms, we have estimated the vibrational temperature of CN molecules using a relative emission intensity method. Assuming a Boltzmann distribution in the density of excited molecular levels, the emission intensity of vibrational transition (Iν′ν′′) is related to the vibrational temperature (Tvib)by expression
Brazilian Journal of Physics, vol. 34, no. 4B, December, 2004 1585
Figure 3. Spectra at different pressures of Nitrogen background: a) CN Violet systemB2Σ+
−X 2Σ+
with∆ν= 0; b)C2 Swan
systemA3Π g−X
′3Π
uwith∆ν= +1.
lnX
ν′′
(λ4Iν′ν′′) =C1−G(ν′)
· hc
κTvib ¸
(1)
whereν′andν′′are the vibrational quantum number of up-per and lower levels, respectively;λis the wavelength cor-responding to the transition (ν′,ν′′); G (ν′)is the upper vi-brational level; C1 is a constant; h is Planck’s constant; κ is Boltzmann’s constant; and c is the speed of light. Vi-brational energy levels and the emission wavelength of the diatomic CN (B 2
Σ+ - X 2
Σ+
)molecule were calculated using molecular constants given in Ref. 14.
Figure 4. Emission intensities of: a) 391.1 (11,11), 388.34 (0,0) and 387.14 (1,1) nm lines associated to the CN Violet system; b) 467.8 (5,4), 471.5 (2,1) nm lines of Swan system and C++∗464.7 nm line from graphite plasma plume as a function of nitrogen pres-sure. Power density 12 J/cm2. Lines are guide to the axis.
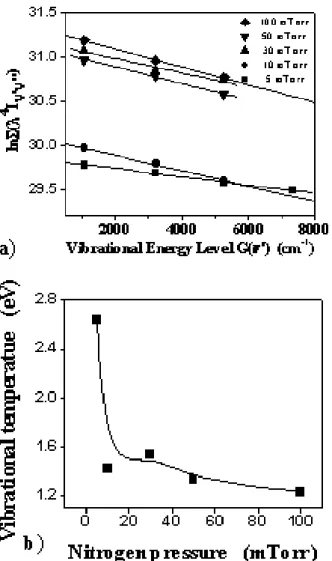
Figure 5a plots data for CN emission peaks at 388.3 nm (0,0), 387.1 nm(1,1), 386.2 nm (2,2), 385.1 nm (4,4) accor-ding to equation (1), for different nitrogen pressures. Slopes are inversely proportional to Tvib, demonstrating a
1586 H. Riascoset al.
lowest G-peak position (1548.1 cm−1
). These results indi-cate highest fullerene likeness under our experimental con-ditions [12].
Figure 5. a) Boltzmann plots emission intensities of CN vibrational spectra for different nitrogen pressures. b) Vibrational temperature as a function of Nitrogen pressure. Lines are guide to the axis.
4
Conclusions
Plasma produced by laser ablation of graphite at low ni-trogen pressures by using an Nd: YAG-pulsed laser, were analyzed for synthesis of fullerene-like CNx films. Plasma composition and vibrational temperature was correlated to film composition and bonding. We concluded that:
Close to the target, plasma is dominated by strong peaks of excited neutral, C(I), and single ionized, C(II), atoms, CN radicals, and C2molecules, characteristic of carbon plasma in the presence of reactive nitrogen.
Detection of C2 and CN molecules is related to plume thermalization caused by collisions with background nitro-gen molecules, promoting recombination of C to form C2 and provide a large fraction of sp2
hybridization, thus favo-ring fullerene-like CNx formations.
The intensities of C2lines are stronger than the intensi-ties of CN lines. This result was correlated with the nitro-gen content in the deposited CNx films. We have found that nitrogen content decreases from 23% to 18%, as pressure increases from 5 to 30 mTorr.
Vibrational temperature decreases from 2.64 to 1.23 eV, as pressure increases from 5 to 100 mTorr. Vibrational tem-perature at 5 mTorr (2.64 eV) is sufficiently close to the bon-ding energies of CN molecule (3.8 eV) to influence compo-sition and film structure. These results agree with the com-position and structure of deposited fullerene-like CNx films.
Acknowledgment
This work has been financed and supported by COLCI-ENCIAS, Colombia, under research project No. 1106-05-11457 (contract 252-2001) and by FUNDACION BANCO DE LA REPUBLICA, Colombia, under research project No. 1441.
References
[1] Y. Yamagata, A. Sharma, J. Narayan, R. M. Mayo, J. W. New-man, and K. Ebihara, J. Appl. Phys.86, 4154 (1999).
[2] Y. Yamagata, A. Sharma, J. Narayan, R. M. Mayo, J. W. New-man, and K. Ebihara, J. Appl. Phys.88, 6861 (2000).
[3] A. A. Voevodin, J. G. Jones, J. S. Zabinski, and L. Hultman, J. Appl. Phys.92, 9, 724 (2002).
[4] F. Acquaviva, M. L. De Giorgi, Appl. Surf. Science197-198, 21-26 (2002)
[5] F. Kokai, Y. Koga, and R. B. Heimann, Appl. Surf. Sci.96-98, 261 (1996).
[6] Y. Nakata, H. Kaibara, T. Okada, and M. Maeda, J. Appl. Phys.80, 2558 (1996).
[7] Y. Yamagata, K. Shingai, A. M. Alexander, T. Ikegami, and K. Ebihara, Thin Solid Films316, 56 (1998).
[8] A. A. Voevodin, S. J. P. Laube, S. D. Walck, J. S. Solomon, M. S. Donley, and J. S. Zabinsky, J. Appl. Phys.78, 4123 (1995).
[9] Abhilasha, P. S. R. Prasad, and R. K. Thareja, Phys. Rev. A
48, 2929 (1993).
[10] R. W. B. Pearse and A. G. Gaydon, The Identification of Mo-lecular Spectra (Chapman and Hall, New York, 1976).
[11] S. S. Harilal, R. C. Issac, C. V. Bindhu, V. P. N. Nampoori, and C. P. G. Vallabhan, J. Appl. Phys. 803561 (1996).
[12] H. Riascos, G. Zambrano, P. Prieto, A. Devia, H. Galindo, C. Power, and J. Gonz´alez (submitted to Physica Status Solidi).
[13] X. Chen, J. Mazumder, and A. Purohit, Appl. Phys. A: Solids Surf.52, 328 (1991).
[14] G. Herzberg, Molecular Spectra and Molecular Structure: Spectra of Diatomic Molecules(Krieger, Malabar, FL, 1989).