38 Brazilian Journal of Physics, vol. 34, no. 1, March, 2004
Dielectric Constant and Density of Water as a Function of
Pressure at Constant Temperature
Wely Brasil Floriano
Centro de Ciˆencias Exatas, Departamento de F´ısica,
Universidade Federal do Esp´ırito Santo, Vit´oria, ES, 29060-900, Brazil
and Marco Antonio Chaer Nascimento
Departamento de F´ısico-Qu´ımica, Instituto de Qu´ımica,
Universidade Federal do Rio de Janeiro, 21949-900, Rio de Janeiro, RJ, Brazil
Received on 18 August, 2003.
In order to simulate the effects of hydrostatic pressure on protein folding/unfolding it is necessary to accurately describe the behavior of the dielectric constant and the density of the solvent (water), in the range of pressures (between 0.1 MPa and 2.0 GPa) and temperatures (below 75 ˚ C) required for pressure-induced unfolding. A simple equation of the form X = X (T, Pi)+ a0 ln (ai+ P)/(ai + Pi)[were X is the property, Pi (in MPa)
is the reference pressure and aiare coefficients adjusted to fit experimental values] is proposed to describe both properties as function of pressure, at constant temperatures. The equation reproduces available data for dielectric constant and density of water to an accuracy of 0.1%. Because of its simplicity and accuracy, the proposed equation is useful for simulation studies and for any other problem where the knowledge of those properties as a function of pressure is needed.
1
Introduction
A relatively small number of studies on the measurement of the dielectric constant of water as a function of temperature (T) and pressure (P) have been reported in the literature[1]. Most of the experimental data available is for a relatively large range of temperatures (up to 670K) at relatively low pressures (under 200MPa). There are few measurements available for pressures between 200MPa and 500MPa. The accuracy of most of the high temperature data is better than 1%, while in the lower temperature limit (below 70o
C) the accuracy of most of the data is around 0.1%.
As a consequence of this lack of data, attempts to es-timate the properties of aqueous species at high tempera-ture and/or high pressure rely on estimated or extrapolated values of the dielectric constant of water. High tempera-ture and pressure conditions are important for engineering processes and geothermal studies. For this reason, several equations have been proposed for different ranges of tem-perature and pressure[1-5]. Almost all of them are entirely empirical. Although those equations may yield unphysical results if extrapolated too far outside the range of the exper-imental data, many of them were formulated to give some confidence about the extrapolated values.
Most of those equations are based on the Kirkwood equation, in which the parameter g (the Kirkwood correla-tion factor) can be expressed as a funccorrela-tion of experimental
variables, like density and temperature, and adjusted to fit experimental data[1,2,4]. An example of this approach has been recently reported[2] in the derivation of an equation for the dielectric constant of water at temperatures from 238 K to 873 K and at pressures up to 1200 MPa. Those au-thors used an empirical 12-parameter form for the g-factor as a function of the independent variables, temperature and density. Their formula correlates well a selected set of data from a collection of experimental data assembled by the au-thors. Another approach[3] uses a hard sphere model for the water molecule and a modified Ornstein-Zernike equa-tion, where the parameters are fit to the experimental data for water. One of the simplest but effective description of the dielectric constant dependence on the pressure and tem-perature, proposed by Bradley and Pitzer[5], uses an equa-tion suggested by Tait in 1880 for volumetric data. Bradley’s equation was expressed in terms of the static dielectric con-stant of water (EPS) and its parameters were adjusted to re-produce experimental data. The resulting equation is valid in the range 0-70o
C between 0.1-2000MPa, and 70-350o
C between 0.1-5000MPa.
Wely Brasil Floriano and Marco Antonio Chaer Nascimento 39
potential for water molecule[9] was used in two of those simulations[6,7].
The simulations carried by Wasserman et al.[7] cov-ered temperatures ranging from 324K to 1278K and den-sities from 0.257 g/cm3
to 1.1108g/cm3
. Their simula-tions are in good agreement within the pressure-temperature range of the experimental data used. They showed that the SPC/E model tends to underestimate the values of the di-electric constant for densities greater than 1.0g/cm3
. The SPC/E potential used by those authors was parameterized to yield correct values of pressure and energy for a density of 0.998g/cm3
at 300K and was not adjusted to experimental values of the dielectric constant.
In the last years a considerable number of papers ap-peared in the literature addressing the important problem of proteins’ folding/unfolding mechanism, using molecular dynamics simulations[10-19]. Different proteins have been studied under very distinct conditions of temperature and pressure[20-25]. Since even the simplest proteins already have a large number of atoms, most simulations are carried out using a continuum dielectric medium (implicit solvent representation) to take the solvent molecules into account. Among the several different conditions that have been em-ployed in computer simulations, the use of hydrostatic pres-sure at relatively low temperatures seems to be very promis-ing at revealpromis-ing the details of foldpromis-ing/unfoldpromis-ing mechanism. We have recently analyzed the effects of pressure on the con-formation of Myoglobin[26,27] and showed that most of the experimental behavior of this system is well reproduced by the simulations.
However, very high pressures are usually required in or-der to conduct this type of study. Therefore, in oror-der to simulate the effects of hydrostatic pressure on protein fold-ing/unfolding it is necessary to accurately describe the prop-erties of the solvent (water) under the simulation conditions. Two of these properties whose value depends on tempera-ture and pressure are the static dielectric constant of water (EPS) and the density (DENS).
The conditions for the study of pressure effects on un-folding are temperatures below 75o
C and pressures up to 20kbar (2000MPa). Under these conditions, the water re-mains in the liquid state, and most proteins are thermally stable at that temperature.
All the previous attempts at deriving equations describ-ing the behavior of EPS and DENS with T and P, tried to cover relatively large ranges of temperature and pressure, and in order to do so, a large number of parameters are used. Bradley’s[5] is the only one among the equations available in the literature to cover the range of T and P needed in the pressure simulation studies. Although much simpler than the others, this equation is not accurate enough in the spe-cific range of T and P (especially for low T) of interest for biological applications, as will be shown.
It would be ideal to have an equation analytically simple as Bradley’s and accurate enough for the biologically rele-vant ranges of T and P. However, Bradley’s equation does not reproduce accurately enough the more recent
experi-mental data for relatively low temperatures, most probably because of the fact that they attempted to cover a large range of T and P. Since the pressure simulation studies require the knowledge of EPS and DENS in a large range of P but at a limited set of temperatures, we adopted the following strat-egy: starting from an equation as simple as Bradley’s, we tried to adjust its parameters as to reproduce as accurate as possible the available data for EPS and DENS at selected values of T, appropriated for the simulation studies. While it may be argued that such a procedure generates equations of limited applicability, this is not really the case because the fitting procedure is very simple and can be performed for any other desired temperature. Besides, by selecting the temperature of interest we gain in accuracy. Therefore, al-though we exemplify its usage for the temperatures proper to our protein simulations, the equation is quite general and can be used in any simulation study where the knowledge of the water EPS and DENS as a function of P at different values of T is needed.
2
Dielectric Constant
The equation suggested by Bradley and Pitzer[5] for the region above saturation pressure and temperatures below 350o
C was
EP S=EP S1000+Cln((B+P)/(B+ 1000)), (1)
where P is the pressure in bars, EPS is the dielectric con-stant, and EPS1000 was chosen arbitrarily as a reference
value (EPS at 1000 bar). EPS1000, C and B are
tempera-ture dependent parameters described by the equations (T in Kelvin):
EP S1000 = U1exp[U2T +U3T 2
] C = U4+U5/(U6+T)
B = U7+U8/T +U9T,
with
U1 = 3.4279E(02) U6=−1.8289E(02)
U2 = −5.0866E(−03) U7=−8.0325E(03)
U3 = 9.4690E(−07) U8= 4.21452E(06)
U4 = −2.0525 U9= 2.1417
U5 = 3.1159E(03) (2)
The parameters showed in equation (2) were optimized using a wide range of experimental data, including high tem-perature data. Although the experimental data below 70o
40 Brazilian Journal of Physics, vol. 34, no. 1, March, 2004
equation does not reproduce adequately the data available from theInternational Association for the Properties of Wa-ter and Steam[28] used in Figure 1 for P above 400MPa, particularly at and above 323K.
60 70 80 90 100 110 120 130 140
0 400 800 1200 1600 2000
P (MPa)
Dielectric Constant
T= 273K adjusted values T= 298K adjusted values
T= 323K adjusted values T= 348K adjusted values
T= 273K adjusted values T= 298K original values
T= 323K original values T= 348K original values
T= 273K Handbook T= 298K Handbook
T= 323K Handbook T= 348K Handbook
T=348K T=323K T=298K T=273K
13
Figure 1. Dielectric constant of water as a function of pres-sure at constant temperatures (273K, 298K, 323K and 348K). (a) Bradley’s [5] equation (fine lines); (b) proposed equation (thick lines) adjusted to (c) values extracted from theInternational Asso-ciation for the Properties of Water and Steam[28] (symbols).
To circumvent this problem we optimized an equation with the same general form as the Bradley equation, for a restricted set of protein folding/unfolding suitable tempera-tures (273K, 298K, 323K, 348K). Therefore, an equation of the form
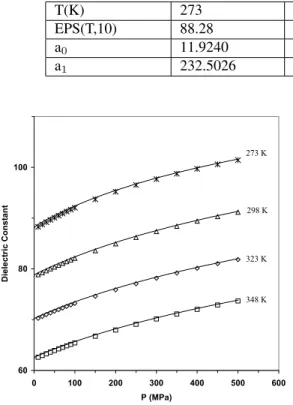
EP S=EP S(T,10) +a0ln((a1+P)/(a1+ 10)) (3)
was used to fit the data available from theInternational As-sociation for the Properties of Water and Steam[28]. The fitting was performed using the program Xmgr v2.10 [29]. In the above equation EPS(T,10) is the dielectric constant of water at temperature T and at 10 MPa,{ai}are parameters optimized for each chosen temperature, and P is the pres-sure in units of MPa. The dependence of aiwith temperature
was not estimated. The set of EPS values available for each temperature is in the range of 10 to 500MPa. The resulting equation fits the data to better than 0.1%. The extrapolated values for the dielectric constant at 1 atm are 87.78, at 273K, and 69.91, at 323K (experimental values are, respectively, 87.90 and 69.88). The optimized parameters are shown in the Table I. Fig. 2 shows the fitted results.
Table I. Dielectric constant of water as a function of pressure at constant temperature. Optimized parameters for equation 3.
T(K) 273 298 323 348
EPS(T,10) 88.28 78.85 70.27 62.59
a0 11.9240 14.1113 14.3899 13.9450
a1 232.5026 341.5902 386.4825 393.2031
Figure 2
273 K
298 K
323 K
348 K
60 80 100
0 100 200 300 400 500 600 P (MPa)
Dielectric Constant
14
Figure 2. Dielectric constant of water as a function of pressure at constant temperature. The figure shows the proposed equation (solid) adjusted to fit data from theInternational Association for the Properties of Water and Steam[28] (symbols).
3
Density
The water density as a function of pressure, at constant tem-perature, can be described by the same equation used be-fore, if we optimize its coefficients for the experimental data available for density [30,31]. The optimized equation, showed bellow, fits the experimental data to 0.1%. The opti-mized parameters are listed in the Table II. Fig. 3 compares the optimized equation to the experimental data[31].
DEN S =DEN S(T,0.1) +a0ln((a1+P)/(a1+ 0.1))
(4) Table II. Optimized parameters for reproducing the experi-mental data [31] for the density of water at 298K.
T(K) 298
DENS(T,0.1) 0.997
a0 0.214
Wely Brasil Floriano and Marco Antonio Chaer NascimentoFigure 3. 41
0.8 0.9 1 1.1 1.2 1.3 1.4 1.5 1.6
0 600 1200 1800 2400 3000 3600 4200 4800 5400
P (MPa)
Density (g/cm
3)
15
Figure 3. Density of water as a function of pressure at 298K. The figure shows equation 4 (solid line) adjusted to experimental values [31] (•).
4
Conclusions
The dielectric constant and the density of water as a function of pressure, at constant temperature, are well described by an equation of the form
X =X(T, Pi) +a0ln((a1+P)/(a1+Pi)) (5)
where X is the property, Pi (in MPa) is the reference
pres-sure and the coefficients ai are adjusted to fit experimental
values. The equation reproduces the experimental data for both dielectric constant and density to an accuracy of 0.1%, for a large range of pressure values at a given temperature. This feature makes equation (5) particularly useful for simu-lation studies or for any other problem where the knowledge of these properties as a function of pressure is needed.
Acknowledgments
The authors acknowledge CNPq and FAPERJ for finan-cial support.
References
[1] D.G. Archer and P. Wang, J. Phys. Chem. Ref. Data19, 371 (1990).
[2] D.P. Fernandez, A.R.H. Goodwin, E.W. Lem-mon, J.M.H.L.Sengers, and R.C. Williams, J. Phys. Chem. Ref. Data26, 1125 (1997).
[3] E.U. Franck, S. Rosenzweig, and M. Christoforakos, Ber. Bunsen. Phys. Chem.94, 199 (1990).
[4] K.S. Pitzer KS, Proc. Natl. Acad. Sci. USA80, 4575 (1983).
[5] D.J. Bradley and K.S. Pitzer, J. Phys. Chem.83, 1599 (1979).
[6] Y. Guissani and B. Guillot, J. Chem. Phys.98, 8221 (1993).
[7] E. Wasserman, B. Wood, and J. Brodholt, Ber. Bunsen. Phys. Chem.98, 906 (1994).
[8] A. Saul and W.Wagner, J. Phys. Chem. Ref Data 18, 1537 (1989).
[9] H.J.C. Berendsen, J.R. Grigera, and T.P.Straatsma, J. Chem. Phys.91, 6269 (1987).
[10] W.F. van Gunsteren, P.H. Hunenberger, H. Kovacs, A.E. Mark, and C.A. Schiffer.Phil. Trans. Royal Soc. London B
348, 49 (1995).
[11] A. Caflisch and M. Karplus, J. Mol. Biol.252, 672 (1995).
[12] K.E.Laidig and V.Daggett, Fold Des.1, 335 (1996).
[13] D.van der Spoel, B.L. deGroot , S. Hayward, H.J.C. Berend-sen, and H.J.Vogel, Protein Sci.5, 2044 (1996).
[14] T. Lazaridis and M. Karplus , Science278, 1928 (1997).
[15] M.A. Williams, J.M. Thornton, and J.M. Goodfellow, Protein Eng.10, 895 (1997).
[16] S.S. Sung and X.W. Wu, Biopolymers42, 633 (1997).
[17] F.B. Sheinerman and C.L. Brooks, Proc. Natl. Acad. Sci. USA95, 1562 (1998).
[18] M. Schaefer, C. Bartels, and M. Karplus, J. Mol. Biol.284, 835 (1998).
[19] D. Cregut D and L. Serrano, Protein Sci.8, 271 (1999).
[20] J. Tirado-Rives and W.L. Jorgensen, Biochemistry32, 4175 (1993).
[21] D.B. Kitchen, L.H. Reed, and R.M. Levy, Biochemistry31, 10083 (1992).
[22] E. Paci and M.J. Marchi, J. Phys. Chem.100, 4314 (1996).
[23] P.E. Hunenberger, A.E. Mark, and W.F. van Gunsteren, Pro-teins21, 196 (1995).
[24] J.D. Hirst and C.L. Brooks, Biochemistry3, 7614 (1995).
[25] M.T. Reymond, G. Merutka, H.J. Dyson, and P.E. Wright, Protein Sci.6, 706 (1997).
[26] W.B. Floriano, M.A.C. Nascimento, G.B. Domont, and W.A. Goddard, Protein Sci.7, 2301 (1998).
[27] W.B. Floriano, M.A.C. Nascimento, G.B. Domont, and W.A. Goddard (submitted).
[28] D.R. Lide (editor), CRC Handbook of Chemistry and Physics; CRC press, 68thed. (1987), 74th ed. (1994).
[29] P.J. Turner. Online manual
http://plasma-gate.weizmann.ac.il/Xmgr/
[30] P.W. Bridgman, J. Chem. Phys.10, 597 (1935).
![Figure 3. Density of water as a function of pressure at 298K. The figure shows equation 4 (solid line) adjusted to experimental values [31] ( • ).](https://thumb-eu.123doks.com/thumbv2/123dok_br/18980985.457012/4.892.98.433.91.314/figure-density-function-pressure-figure-equation-adjusted-experimental.webp)
