LUMBAR SPINE COMPUTED TOMOGRAPHY AFTER
ARTHRODESIS WITH METAL IMPLANT: A QUALITATIVE
EVALUATION OF IMAGES RECONSTRUCTED WITH DIFFERENT
MATHEMATICAL ALGORITHMS*
José Augusto Marconato1
,Flávio Franciosi Aesse2
, José Hamilton Pinheiro Ferreira2 , Cláudio Pitta Pinheiro2
, Alessandro André Mazzola3
OBJECTIVE: To select the best mathematical algorithms for lumbar spine imaging studies to assess arthrodesis with metal implant. MATERIALS E METHODS: The images acquisition was performed with a multidetector (16 rows) CT scanner, and 2 mm and 4 mm slice thickness. Images of ten patients were reconstructed with filters 20, 40, 60 and 80, employing multiplanar three-dimensional volume-rendering techniques. A total of 320 images were evaluated by three experienced radiologists who rated the images from 1 to 5 (1 = unacceptable; 2 = substandard; 3 = acceptable; 4 = above the average; 5 = excellent). Additionally, noise measurements were performed for correlation with the type of filter utilized. RESULTS: For 2 mm thickness and filters 20, 40, 60 e 80, mean noise measurements for images reconstruction were, respectively, 24.7 ± 4.3, 35.5 ± 4.2, 106.0 ± 18.5 and 145.9 ± 26.9, and for 4 mm and filters 20, 40, 60 and 80 were, respectively, 18.1 ± 2.4, 25.1 ± 4.6, 76.7 ± 17.2 and 106.6 ± 23.4. CONCLUSION: Three-dimensional color images could be better visualized with filter 20; however, in the case of gray-scale, filters 40 or 60 could be useful to demonstrate the arthrodesis pedicle screws in higher detail. For multiplanar reconstructions with 2 mm slice thickness, the filter 40 was the most appropriate, and for 4 mm, a filter 60 presented a better image quality.
Keywords: Computed tomography; Arthrodesis; Lumbar spine; Image quality.
Tomografia computadorizada da coluna lombar após artrodese com emprego de material metálico: avaliação da qualidade da imagem para diferentes algoritmos matemáticos.
OBJETIVO: Selecionar os melhores algoritmos para o exame de coluna lombar na avaliação de artrodese com material metálico. MATERIAIS E MÉTODOS: Utilizou-se um equipamento de tomografia computadori-zada de 16 fileiras de detectores. Imagens de dez pacientes foram reconstruídas com filtros 20, 40, 60 e 80 e realizadas reformatações em três dimensões e multiplanares com espessuras de 2 mm e 4 mm. Um total de 320 imagens foi avaliado por três experientes radiologistas, que deram notas de 1 a 5 (1 = não-aceitá-vel; 2 = abaixo dos padrões; 3 = aceitánão-aceitá-vel; 4 = acima da média; 5 = excelente). Além disso, foram rea-lizadas medidas de ruído para correlação com o tipo de filtro utilizado. RESULTADOS: As médias do valor de ruído para reconstrução com 2 mm e filtros 20, 40, 60 e 80 foram de 24,7 ± 4,3; 35,5 ± 4,2; 106,0 ± 18,5 e 145,9 ± 26,9, respectivamente, e para 4 mm foram de 18,1 ± 2,4; 25,1 ± 4,6; 76,7 ± 17,2 e 106,6 ± 23,4. CONCLUSÃO: As imagens coloridas em três dimensões são mais bem visualizadas com filtro 20, entretanto, nas imagens em tons de cinza um filtro intermediário de 40 ou 60 pode ser útil para demons-trar os parafusos com maior detalhe. Para reconstruções multiplanares com espessura de 2 mm o filtro 40 é mais bem aceito, e para uma espessura de 4 mm um filtro 60 apresentou melhor qualidade.
Unitermos: Tomografia computadorizada; Artrodese; Coluna lombar; Qualidade da imagem. Abstract
Resumo
* Study developed at Hospital Moinhos de Vento, Porto Ale-gre, RS, Brazil.
1. Master Degree in Science, Physicist at Hospital Moinhos de Vento, Professor at Fundação Saint Pastous.
2. MD, Radiologists at Hospital Moinhos de Vento. 3. Master Degree in Science, Physicist at Hospital Moinhos de Vento, Professor at Pontifícia Universidade Católica do Rio Grande do Sul and Centro de Educação Tecnológica do Instituto Pró-Universidade Canoense.
Mailing Address: José Augusto Marconato. Rua Marquês do Herval, 65/302, Bairro Marechal Rondon. Canoas, RS, 92020-400 – Brazil. E-mail: [email protected]
Received July 7, 2006. Accepted after revision August 10, 2006.
INTRODUCTION
Spinal fusion with metal implants has been utilized for some years, and postop-erative evaluation may be performed by means of imaging diagnosis methods such us conventional x-ray, computed tomogra-phy (CT) or magnetic resonance imaging (MRI). These three methods present advan-tages and disadvanadvan-tages, conventional x-ray being the lowest cost alternative al-though it does not allow a detailed
visual-ization of the rachidian canal and soft tis-sues. In some cases, several views may be necessary. MRI is a less utilized method because of its high cost; additionally, metal implants may cause artifacts, which many times make the method unfeasible. On the other hand, multidetector CT is the most complete method, despite the disadvantage of its high cost when compared with the conventional x-ray(1).
on the Effects of Atomic Radiation presents effective doses for conventional lumbar spine x-ray studies in several countries, ranging from low to high levels in relation to CT studies, depending on the param-eters utilized as well as on the number of views(2).
Currently, CT equipment can control the radiation dose according to the anatomical region and the size of the patient, resulting in a considerable reduction of the effective radiation dose. Additionally, such equip-ment present more advanced resources for the images reconstruction (multiplanar re-construction – MPR), maximum intensity projection (MIP), and even high quality 3D images with the volume rendering technol-ogy (VRT). Also, there is the possibility of utilizing different mathematical algo-rithms, which are calculations performed by the tomograph computer in the moment of the images reconstruction, sharpening or softening them. These algorithms or filters have a direct influence on the images qual-ity, changing both the spatial resolution and noise(3).
Usually, in spine studies, a filter is uti-lized for visualizing bone, and other for visualizing soft tissues, on axial, sagittal and coronal views. However, for evaluat-ing arthrodesis with metal implants, more detailed reconstructions, including 3D im-ages, are necessary to reduce artifacts, and, for this purpose, the utilization of different filters is involved. The recently produced Siemens CT equipment has several filters specific for each region of the body, with values ranging between 10 and 90. The lower the filter value, the lower the noise and the better the low-contrast resolution on the images, which are ideal for visual-izing soft tissues. When the filter value is increased, there is an increase in the noise and spatial resolution on the image, ideal for visualizing bone structures and high-contrast objects(3).
The objective of the present study is to determine the most appropriate filters for lumbar spine CT evaluation after arthrod-esis with metal implants.
MATERIALS AND METHODS
A multidetector (16 rows) CT equip-ment (Somatom Sensation Cardiac;
Si-emens AG) was utilized in the present study. Ten patients who had been submit-ted to CT of the lumbar-sacral spine for evaluation of arthrodesis with metal im-plant were selected. The examination was performed on a routine basis, under the following technical parameters: 120 kV,
200 mAs, reference and collimation 16 ×
1,5 mm. An automatic exposure control system (Care Dose; Siemens AG) was uti-lized. Post-processing with filters numbers 20, 40, 60 e 80 was requested. After that, 3D reformation was performed with VRT in gray-scale and color, MPR with 2 mm and 4 mm thickness, axial, sagittal and coronal, oblique views, with specific inclinators for better demonstrating pedicle screws, in a post-processing workstation (Wizard; Siemens AG). Three hundred and twenty images were presented without ac-quisition and reconstruction parameters for evaluation by three experienced Radiolo-gists who subjectively rated them from 1 to 5 (1 = unacceptable; 2 = substandard; 3 = acceptable; 4 = above the average; 5 = ex-cellent) as to spatial resolution, noise and artifacts. Reconstruction criteria were the same for the whole sample, the filter being the only variable factor. Therefore, each patient was his/her own control, and it was not necessary to select patents with simi-lar characteristics, with the same type of metal implant or biotype. Measurements of noise level were performed on axial images for each type of filter and slices thickness, positioning a region of interest on the psoas muscle (Figure 1).
Statistical analysis
Grades and noise level measurements were included in a table and means and standard deviations were calculated. For determining the best types of filters for each type of reconstruction, a comparison between the averages of grades employing Friedman and Wilcoxon tests with Bonfer-roni correction. Interobserver concordance was analyzed with the kappa test.
RESULTS
Patients’ data are shown on Table 1. The mean noise levels for reconstruction with 2 mm thick slices and filters 20, 40, 60 and 80 were respectively de 24.7 ± 4.3, 35.5 ±
4.2, 106.0 ± 18.5 and 145.9 ± 26.9; and with 4 mm thick slices were 18.1 ± 2.4, 25.1 ± 4.6, 76.7 ± 17.2 and 106.6 ± 23.4. The graphic on Figure 2 shows this varia-tion for each type of filter.
Table 2 shows means and standard de-viations of the grades given by the three observers.
The statistical analysis has proved the existence of a difference in the images for the several types of filters and slices thick-ness (p < 0.05). For the VRT reconstruction in grayscale (Figure 3), the filter 60 pre-sented the best mean, although being sta-tistically similar to that of the filter 60. On color VRT images (Figure 4), the best mean was that of filter 20. On the 2 mm thick sagittal reconstruction (Figure 5 – A,C, E,G), the highest mean was that of filter 20, although statistically similar to that for the Figure 1. Axial image with the region of interest positioned on the psoas muscle for evaluation of the noise level.
Table 1 Data of patients included in the study.
Patient 1 2 3 4 5 6 7 8 9 10 Weight (kg) 75 94 60 90 60 62 60 50 62 80 Screws 6 10 8 6 4 4 4 6 4 6 Rods 2 2 2 2 2 2 2 2 2 2 Number of metal
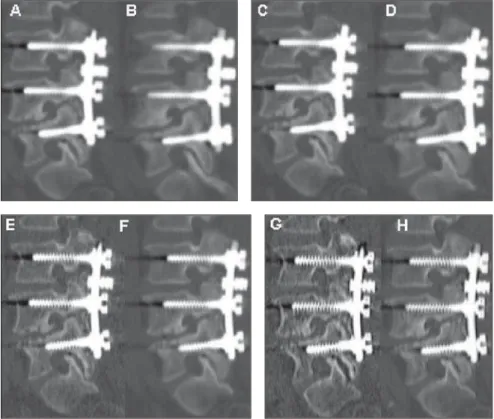
filter 40. For the 2 mm thick (Figure 6 A,C,E,G) and 4 mm thick (Figure 6 – B,D,F,H) axial reconstructions with filter 60, the highest means has been obtained. For 2 mm thick (Figure 7 – A,C,E,G) and 4 mm (Figure 7 – B,D,F,H) coronal images, the highest means were, respectively, those of filters 40 and 60.
With basis on the statistical analyses, interobserver concordance was observed in relation to the sagittal and coronal 2 mm VRT reconstructions in color (p < 0.05). For the other reconstructions, the concor-dance was low.
DISCUSSION
The postoperative evaluation is aimed at assuring the diagnosis of the dural sac and nervous roots integrity; observing alignment and bone fixation, the metal material mechanics and integration; verify-ing the previous disease correction degree; and identifying eventual complications like hematomas, inflammatory processes, etc. The utilization of an appropriate tech-nique in the images reconstruction is
ex-Figure 3. VRT reconstructions in grayscale. A: Filter 20; B: filter 40; C: filter 60; D: filter 80.
A B C D
Figure 4. VRT reconstructions in color. A: Filter 20; B: filter 40; C: filter 60; D: filter 80.
A B C D
Table 2 Means and standard-deviations (SD) of grades given by the three observers for each filter in
different types of reconstruction.
Type of reconstruction
VRT gray scale
VRT color
Sagittal 2 mm
Sagittal 4 mm
Axial 2 mm
Axial 4 mm
Coronal 2 mm
Coronal 4 mm
Filter 20 Filter 40 Filter 60 Filter 80
Mean
3.1
4.3
3.7
3.5
2.4
2.3
3.1
3.1 SD
0.5
0.5
0.7
0.4
0.5
0.5
0.4
0.3
Mean
3.9
3.8
3.6
3.8
3.3
3.2
3.3
3.5 SD
0.6
0.7
0.5
0.4
0.7
0.6
0.6
0.4
Mean
4.0
1.6
2.4
4.3
3.5
3.7
2.3
4.2 SD
0.6
0.4
0.8
0.5
0.5
0.4
0.5
0.5
Mean
2.9
1.4
2.1
3.4
2.7
2.5
1.8
3.2 SD
0.6
0.4
0.4
0.6
0.6
0.4
0.3
0.9
Noise level with 2 mm and 4 mm slice thicknesses
Figure 2. Graphic showing the noise level variations for each type of filter with different slice thicknesses.
N
o
ise
(
U
H
)
Filter
slice thickness: 2 mm
tremely important, mainly in studies sus-ceptible to artifacts. In such cases, a com-plete elimination of artifacts is practically impossible, however, they can be reduced to an acceptable level to not impairing the diagnosis. The CT in the evaluation of ar-throdesis has been always very problem-atic(4) because of beam hardening artifacts,
but the introduction of the multidetector or multislice CT has brought a new perspec-tive for these studies. The quality of the volume rendering and images reconstruc-tion resources has improved considerably in relation to the previous technologies(5).
In the images acquisition process, the noise level is directly related to the radia-tion dose, the collimaradia-tion of detectors, and the slice reconstruction thickness; on the other hand, the spatial resolution is influ-enced only by the collimation of detectors. In the reconstruction phase, filters or math-ematical algorithms should be considered in addition to slice thickness, since the equipments allow an array of combinations between filters and slice thicknesses.
Based on the results of the present study, we could observe that lower filter values Figure 5. Sagittal oblique reconstructions. A: Filter 20 with 2mm de slice thickness; B: filter 20 with
4mm de slice thickness; C: filter 40 with 2mm de slice thickness; D: filter 40 with 4mm de slice thickness; E: filter 60 with 2mm de slice thickness; F: filter 60 with 4mm de slice thickness; G: filter 80 with 2 mm de slice thickness; H: filter 80 with 4mm slice thickness.
and greater slice thicknesses result in a decrease in the spatial resolution and noise reduction of the reconstructed images. A low noise level is highly favorable to color 3D reconstructions with the VRT tech-nique, resulting in high quality images of the lumbar spine. In the analysis of grayscale images obtained with VRT which present a certain transparency allowing the demonstration of the pedicle screws, the Radiologists gave higher grades for recon-structions with intermediate filters like 40 and 60. These results are justified by the higher spatial resolution allowing a better visualization of grooves or alterations on pedicle screws. In the analysis of MPR images, filter 20 and 80 received the low-est grades. The use of filter 20 results in a very low definition of borders and bone trabeculations due the lower spatial reso-lution. The filter 80, on the contrary, accen-tuates borders and noises. On the other hand, filters 40 and 60 had a better
perfor-mance with slice thicknesses of 4 mm and 2 mm, respectively. As previously men-tioned, with lower slice thicknesses, there is an increase in spatial resolution and noise level, so the increase in noise level, as a result of a 2 mm slice thickness, is balanced by the filter 40, and the decrease in spatial resolution resulting from 4 mm slice thick-ness is balanced by the filter 60.
Images were subjectively analyzed by the radiologists who have given higher grades to images gathering the most com-prehensive set of positive factors like a balance among spatial resolution, noise level and artifacts. In the daily practice, the protocol for images acquisition and recon-struction must be adequately standardized to attain similar results in terms of images quality for every patient. The utilization of several combinations of filters and slice thicknesses is not recommended because of its impracticability, besides the high num-ber of images generated. Therefore, a type
of filter for color VRT images, and another for MPR are sufficient.
The noise level increased gradually as the filters were changed from 20 to 80. Also, the 2 mm slice thickness showed a higher noise level in relation to the 4 mm slice thickness. On the whole, color 3D-VRT images are better visualized with fil-ter 20 because of the lower noise level, however, on grayscale VRT images, an in-termediary filter 40 or 60 might be of help to demonstrate pedicle screws in higher detail. In spite of the disagreement of the physicians’ opinions on MPR images, the conclusion is that, for a 2mm slice thick-ness the filter 40 is the best for balancing the noise resulting from the slice thinness, and with a 4 mm slice thickness, a filter 60 results in a better quality of image.
Acknowledgements
radiologists who have contributed for the success of this study.
REFERENCES
1. Williams AL, Gornet MF, Burkus JK. CT evalu-ation of lumbar interbody fusion: current con-cepts. AJNR Am J Neurorradiol 2005;26:2057– 2066.
2. United Nations Scientific Committee on the Ef-fects of Atomic Radiation. UNSCEAR 2000 Re-port to the General Assembly, with scientific an-nexes. Annex D. New York: United Nations, 2000. 3. Seeram E. Computed tomography. Physical prin-ciples, clinical applications, and quality control. 2nd ed. Philadelphia: WB Saunders, 2001. 4. Cook SD, Patron LP, Christa Kis PM, et al.
Com-parison of methods for determining the presence
and extend of anterior lumbar interbody fusion. Spine 2004;29:1118–1123.