Rev Bras
Cineantropom
Hum
DOI: http://dx.doi.org/10.5007/1980-0037.2016v18n4p450
original article
1 Federal University of Paraíba. Postgraduate Associated Program in Physical Education - UPE/UFPB. João Pessoa, PB. Brazil.
2 Federal University of Paraíba. Research and Study Groups in Epi-demiology of Physical Activity. João Pessoa, PB. Brazil.
Received: 09 December 2015
Accepted: 01 May 2016
Prevalence of suficient levels of physical
activity in adolescents: comparison between
the measure obtained using simpliied and
detailed questionnaires
Prevalência de níveis suicientes de atividade física em
adolescentes: comparação entre a medida obtida de um
questionário simpliicado e a de um detalhado
José Cazuza de Farias Júnior1,2
Arthur Oliveira Barbosa1,2
Jonathan Karl Feitosa Mendes2
Gerfeson Mendonça1,2
Abstract – his study aimed was to compare the prevalence of suicient levels of physical activity produced by a measure of the simpliied questionnaire compared to a detailed questionnaire and analyze the concordances between these measures in adolescents. his is cross-sectional study with 2,859 adolescents high school students (57.8% female, 14-19 years old), from the city of João Pessoa (PB), Northeast, Brazil. Physical activity was measured by two questionnaires: a simpliied instrument, containing a single question and a detailed questionnaire. Adolescents engaging in physical activity ≥300 minutes/ week were classiied as suiciently physically active. Agreement between the two measures was evaluated by the Kappa statistic (k) and sensitivity and speciicity measures using the results of the detailed questionnaire as reference. he prevalence of adequate levels of physical activity was lower in the simpliied questionnaire (20.1%; 95%CI: 18.6-21.6) compared to the detailed questionnaire (50.2%; 95%CI: 48.4-52.7). Inter-questionnaire agreement was slight (almost all with k<0.30). Sensitivity of the simpliied questionnaire was low (from 26.4%, 95%CI: 22.9-30.0; to 40.9%, 95%CI: 37.0-45.0), and speciicity was high (from 92.3%, 95%CI: 86.9-96.0; to 94.3%, 95%CI: 92.0-96.1). Conclusions: the agreement between the prevalence of suicient levels of physical activity measured by a simpliied and detailed questionnaire was low. Simpliied questionnaires should be used with caution because they can underestimate the prevalence of levels of physical activity in adolescents.
Key words: Adolescent; Motor activity; Sensitivity; Speciicity.
In epidemiological studies with large samples, measuring levels of physical activity has been mainly achieved through the use of questionnaires due to their low cost, high applicability and the possibility of adaptation to the study objectives and characteristics of the target population1,2.
Several questionnaires to measure physical activity were developed and tested in adolescents2. he selection of a physical activity
question-naire, among those that are available, depends on several factors such as availability of human and inancial resources, measure temporality (for example, last day, week, month or last three months, year, typical week), domains to be measured, method of application, purposes and character-istics of the target population, instrument size, way to express the inal result (score, minutes / week MET / minutes per day or week, kcal / kg / day), reproducibility and validity levels1.
In population surveys on health, simpliied questionnaires have often been used due to the limited number of questions and easy implementation, requiring less human and inancial resources, and the possibility of being easily incorporated into the data collection instrument3-5. In general, these
instruments are composed of one or two questions related to physical ac-tivity practice recommendations for a given population group3-6. It allows
identifying people who meet or not a certain level of practice4,5,7-9.
In 2001, Prochaska et al.5 validated a simpliied questionnaire to assess
physical activity in adolescents (Patient-Centered Assessment and Coun-seling for Exercise Plus Nutrition - PACE +). his questionnaire consists of a question directed to identify how many days of the week adolescents practiced physical activities of moderate / vigorous intensity that together totaled at least 60 minutes / session per day, considering a typical week and the last seven days. his instrument showed high reproducibility levels and moderate validity5. In Brazil, it has been adapted and tested in young
people in the cities of Recife (PE) and Florianópolis (SC) and showed high levels of reproducibility and low of validity 4.
he PACE + questionnaire and its adaptations have been applied with young people in various countries1,8,9, including Brazil7,10-12. It is believed
that simpliied instruments underestimate the prevalence of suicient levels of physical activity in adolescents due to their physical activity pattern, characterized by the involvement in diferent activities, with signiicant variations in frequency, intensity and duration13,14. It is argued that these
instruments are less sensitive to short-duration and sporadic physical activ-ities, and also require that the intensity, frequency and duration measures are summarized in a single response13,14.
Marked discrepancies in the prevalence of levels of physical activity have been identiied between simpliied and detailed questionnaires in studies with adults3,15, but this analysis has not been conducted in
Levels of physical activity in adolescents Farias Júnior et al.
herefore, it remains unknown whether this instrument underestimates or overestimates the prevalence of suicient levels of physical activity com-pared to the detailed questionnaire. In this sense, the aim of this study was to compare the prevalence of suicient levels of physical activity produced by the measure of a simpliied questionnaire compared to a detailed question-naire and analyze the concordances between these measures in adolescents.
METHODOLOGICAL PROCEDURES
his study is part of a broader survey with adolescents aged 14-19 years from public and private high schools in the city of João Pessoa (PB) aimed at determining the level of physical activity and analyze associated factors (individual and environment) in adolescents16.
he following parameters were considered for the sample size calcu-lation: target population estimated at 32,112 high school students, esti-mated prevalence of 50% (suicient levels of physical activity); maximum acceptable error of three percentage points; conidence level of 95%; design efect equal to two points (def = 2); 30% increment for losses and refusals, resulting in a sample of 2,686 students.
he clustering sampling was obtained in two stages: systematic selec-tion of 30 schools, with probability proporselec-tional to size and proporselec-tionally distributed according to type of school (public and private) and municipal region (north, south, east, west); random selection of 135 classes propor-tionally distributed per shift (day and night) and grade (1st, 2nd and 3rd grades
of high school). Detailed information on the sample selection process has been previously described16.
Data collection was carried out between May and September 2009 by a previously trained team through a pre-tested unidentiied questionnaire illed by students in classroom, at the regular time, following previous instructions provided by the collection team.
To characterize the sample, the following information was measured: sex, age, economic class and paternal and maternal education. Economic class was established as proposed by the Brazilian Association of Research Companies17, gathering individuals into classes A1, A2, B1, B2, C1, C2,
D and E. Paternal and maternal education was categorized as follows: incomplete primary education, complete primary education, complete high school, complete higher education.
Physical activity measurement was performed by two questionnaires, a simpliied questionnaire and a detailed questionnaire, applied on the same day and by the same data collection team. he simpliied questionnaire (adapted version of PACE +) consisted of a single question: “In the last week, on how many days did you practice physical activities of moderate / vigorous intensity that together totaled at least 60 minutes per day?”, with scale response ranging from none to seven days per week4. Adolescents
Activity Questionnaire for Adolescents, validated in adolescents from Northeastern Brazil (Intraclass Correlation Coeicient - ICC = 0.88; CI 95%: 0.84-0.91) and validity (Spearman’s rho = 0.62, p <0.001 compared to the measure of four 24-hour physical activity recalls)18. Adolescents
reported the frequency (days / week) and duration (minutes / day) of activ-ities carried out for at least 10 minutes in the week before data collection (last week). he level of physical activity was estimated by the sum of the products of frequencies by the respective durations, resulting in a score in minutes per week of physical activity.
Adolescents who reported physical activities of moderate to vigorous intensities that together totaled at least 60 minutes a day, ive or more days per week (5 days or more per week x 60 minutes or more per day = 300 minutes or more per week of physical activity) for the simpliied question-naire, and those with physical activity score ³300 minutes / week for the detailed questionnaire were classiied as suiciently physically active. he others were classiied as insuiciently active19.
In analyzing the data, the descriptive statistics procedures, including distribution by absolute and relative frequency, mean, standard deviation and conidence intervals (CI 95%) were initially applied. he diferences in the prevalence of suicient levels of physical activity between questionnaires were evaluated by the intersection of CI 95%. To evaluate the agreement between measures obtained by the simpliied questionnaire and detailed questionnaire to correctly classify adolescents as the level of physical activity (suiciently physically active vs insuiciently physically active), the Kappa index was used (values up to 0.19 were classiied as poor; from 0.20 to 0.39, slight agreement; from 0.40 to 0.59, moderate agreement; from 0.60 to 0.79, substantial agreement and values above 0.80, almost perfect20) and
sensitivity and speciicity measures, adopting as reference the measured obtained with the detailed questionnaire21.
Statistical analyses were performed using Stata 13 software. he sample selection process (option “svyset” of this software) was considered in the descriptive analysis and Kappa index determination. he signiicance level adopted was less than 5%.
he project was approved by the Ethics Committee on Human Re-search of the Center for Health Sciences, Federal University of Paraíba (protocol no. 0062/2009). All adolescents under 18 years who participated in the survey were authorized by parents or guardians.
RESULTS
Levels of physical activity in adolescents Farias Júnior et al.
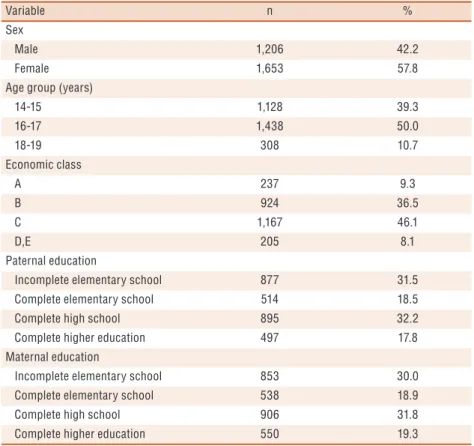
he inal sample consisted of 2,859 adolescents, average age of 16.5 years; (standard deviation of 1.2 years); 57.8% female, most aged 16-19 year (89.3%), intermediate (C) -low (D,E) economic class (54.2%) and children of parents with at least complete high school (father: 50.1%, mother: 51.1%) - Table 1.
Table 1. Sociodemographic characteristics of the sample, João Pessoa (PB), 2009
Variable n %
Sex
Male 1,206 42.2
Female 1,653 57.8
Age group (years)
14-15 1,128 39.3
16-17 1,438 50.0
18-19 308 10.7
Economic class
A 237 9.3
B 924 36.5
C 1,167 46.1
D,E 205 8.1
Paternal education
Incomplete elementary school 877 31.5
Complete elementary school 514 18.5
Complete high school 895 32.2
Complete higher education 497 17.8
Maternal education
Incomplete elementary school 853 30.0
Complete elementary school 538 18.9
Complete high school 906 31.8
Complete higher education 550 19.3
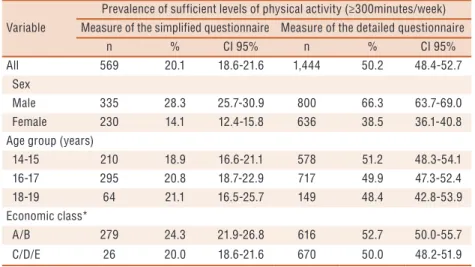
he prevalence of suicient levels of physical activity produced by measuring the simpliied questionnaire was statistically lower (20.1%, CI 95%: 18.6-21.6) compared to the detailed questionnaire (50.2%, CI 95%: 48.4-52.7). hese diferences were greater in male (28.3% vs. 66.3%) and younger adolescents (14-15 years: 18.9% vs. 51.2%) and belonging to eco-nomic classes C / D / E (20.0% vs. 50%), respectively compared to female, older adolescents (16-19 years) belonging to economic classes A / B (Table 2).
he agreement between measurements of physical activity using the simpliied and detailed questionnaire was slight, with most Kappa values below 0.30, except for adolescents of high economic class (classes A / B), whose value was 0.34 (CI 95%: 0.29-0.38), also classiied as slight.
Variable
Prevalence of sufficient levels of physical activity (≥300minutes/week) Measure of the simplified questionnaire Measure of the detailed questionnaire
n % CI 95% n % CI 95%
All 569 20.1 18.6-21.6 1,444 50.2 48.4-52.7
Sex
Male 335 28.3 25.7-30.9 800 66.3 63.7-69.0
Female 230 14.1 12.4-15.8 636 38.5 36.1-40.8
Age group (years)
14-15 210 18.9 16.6-21.1 578 51.2 48.3-54.1
16-17 295 20.8 18.7-22.9 717 49.9 47.3-52.4
18-19 64 21.1 16.5-25.7 149 48.4 42.8-53.9
Economic class*
A/B 279 24.3 21.9-26.8 616 52.7 50.0-55.7
C/D/E 26 20.0 18.6-21.6 670 50.0 48.2-51.9
* Grouped into two levels for this analysis.
Table 3. Kappa index, sensitivity and specificity for prevalence of sufficient levels of physical activity determined using simplified and detailed questionnaire* according to sex, age and economic class of adolescents, João Pessoa (PB) 2009
Variables n Kappa CI 95% Sensitivity CI 95% Specificity CI 95%
All 2,859 0.27 0.21-0.30 33.7 31.3-36.3 93.6 92.2-94.8
Sex
Male 1,206 0.26 0.20-0.32 39.6 36.1-43.1 93.7 90.9-95.9
Female 1,653 0.23 0.16-0.27 26.4 22.9-30.0 93.6 91.9-95.0
Age group (years)
14-15 1,128 0.24 0.18-0.28 31.0 27.2-35.0 93.8 91.4-95.6
16-17 1,438 0.29 0.21-0.37 35.6 32.1-39.3 93.7 91.7-95.4
18-19 308 0.28 0.21-0.38 35.4 27.7-43.7 92.3 86.9-96.0
Economic class**
A/B 1,161 0.34 0.29-0.38 40.9 37.0-45.0 94.3 92.0-96.1
C/D/E 1,372 0.21 0.17-0.25 27.2 23.8-30.8 93.2 91.1-95.0
* As detailed questionnaire measurement was used as reference. ** Grouped into two levels for this analysis.
DISCUSSION
he results showed that there are signiicant discrepancies in the prevalence of suicient levels of physical activity estimated from the simpliied and detailed questionnaires. he simpliied questionnaire showed low sensitivity to identify adolescents with suicient levels of physical activity.
he comparison of results with literature was relatively compromised because studies comparing estimates of physical activity prevalence pro-duced by simpliied and detailed questionnaires were conducted with adults15,22. Among the few studies that showed results with young people
(14-25 years), the prevalence of suicient levels of physical activity obtained from the measurement using the simpliied questionnaire was lower com-pared to measurement using the detailed questionnaire6,23. hese indings
Levels of physical activity in adolescents Farias Júnior et al.
he Health Behaviour in School-Aged Children (HBSC)8, held every
four years by the World Health Organization with adolescents aged 13-15 years from 41 countries, the Youth Risk Behavior Surveillance System (YRBSS), held every two years with a representative sample of young people in the United States9, and the National Survey of Student‘s Health
(PeNSE)7, held every two years with 9th grade students from public and
private elementary schools in 26 Brazilian state capitals and Federal district, are examples of investigations that have used the simpliied measure of physical activity analyzed in this study.
he HBSC8 results indicated that only 19%-28% of male adolescents
and 10%-19% of female adolescents reported the practice of physical ac-tivities for 60 minutes or more per day, ive or more days a week. In 2012, data from PeNSE showed that only 20.2% of students were classiied as physically active (physical activities for 60 minutes or more per day, ive or more days a week)7. However, in YRBSS9, the prevalence of suicient
levels of physical activity using the same cutof point as PeNSE7 was 49.5%.
In most studies using simpliied questionnaires, the prevalence of suicient levels of physical activity was below 25% in both national7,11, as
in international studies8,24. In studies with the same group of adolescents
that used detailed and simpliied questionnaire, the prevalence of ado-lescents who met the recommended levels of physical activity observed using the detailed questionnaire was almost twice as that identiied using the simpliied questionnaire7,11. hese indings show that the prevalence
of suicient levels of physical activity estimated from simpliied question-naires are underestimated and may vary from 10 to 30 percentage points. In addition to the diference in the prevalence of suicient levels of physical activity between simpliied and detailed questionnaire, low agreement between them was identiied, with all Kappa index values being classiied as slight. Another important fact was the low sensitivity of the simpliied questionnaire to estimate suicient levels of physical activity in adolescents of this study. his is worrying, given that only three in ten adolescents with suicient levels of physical activity identiied by the detailed questionnaire were classiied in a similar way by the simpliied questionnaire. However, most adolescents with insuicient levels of physical activity were correctly classiied by the simpliied questionnaire.
Ridgers et al.25 observed low levels of sensitivity (45.5%) and high levels
of speciicity (73.4%) for measurement obtained using the simpliied ques-tionnaire compared to the accelerometer (300 minutes / week). hese results indicate that the simpliied questionnaire proposed by Prochaska et al.5 has low
sensitivity for identifying adolescents with suicient levels of physical activity (practice 300 minutes of physical activity per week), but has high speciicity.
is another factor to be considered.
he way the physical activity score is produced in the detailed ques-tionnaire may be another explanation for these discrepancies. In these instruments, the physical activity score is produced by multiplying the frequencies by the practice duration in each physical activity, resulting in a score in minutes per day or week. hus, an adolescent who practiced phys-ical activities for two days per week, 150 minutes a day, will have physphys-ical activity score of 300 minutes per week. In this case, the adolescent would be classiied as suiciently physically active. But if the same adolescent responded the simpliied questionnaire analyzed in this study, he would have two days a week of practice less than 60 minutes per day, being then classiied as insuiciently active. Studies with adolescents have identiied low correlation between measurement obtained using accelerometers and simpliied questionnaires13,14,26, reinforcing the thesis that these
question-naires tend to underestimate the level of physical activity.
However, it is important to highlight that simpliied questionnaires to measure the levels of physical activity were constructed to produce an overall measure of physical activity and are used in health surveys of the population, monitoring systems on health risk behaviors and / or as a tool used to screen levels of physical activity. However, these instruments have been used beyond the purposes for which they were designed (for exam-ple, to analyze the association between the levels of physical activity with diferent health outcomes, correlated factors of physical activity).
his study has some limitations that need to be considered. One was the lack of an objective measure of physical activity (accelerometry, for example) to evaluate the correlation between simpliied and detailed ques-tionnaires. However, it has important limitations: epoch size, minimum number of hours per day to deine as valid day, cutofs to deine moderate and vigorous intensity activities, deinition of use and non-use of equipment and number of days to compose the inal measure of physical activity27. It
was not possible to evaluate the concordance between questionnaires for adolescents who did not practice physical activities (“the so-called zeros”), as the zero in the detailed questionnaire is not having practiced physical activities in any day of the week, but in the simpliied questionnaire, it is not having practiced moderate to vigorous physical activity for at least 60 minutes per day, any day of the week5. his study also has strengths: it used
a representative sample of adolescents, the questionnaires were previously validated and applied by trained personnel following a data collection protocol, and who did not know the study hypotheses.
Levels of physical activity in adolescents Farias Júnior et al.
REFERENCES
1. Sternfeld B, Goldman-Rosas L. A Systematic approach to selecting an appropriate measure of self-reported physical activity or sedentary behavior. J Phys Act Health 2012;9(Suppl 1):S19-S28.
2. Chinapaw MM, Mokkink LB, Van Poppel MNM, Van Mechelen W, Terwee CB. Physical activity questionnaires for youth: a systematic review of measurement properties. Sports Med 2010;40(7):539-63.
3. Iwai N, Hisamichi S, Hayakawa N, Inaba Y, Nagaoka T, Sugimori H, et al. Va-lidity and reliability of single-item questions about physical activity. J Epidemiol 2001;11(5):211-8.
4. Nahas MV, Barros MVG, Florindo AA, Farias Júnior JC, Hallal PC, Konrad L, et al. Reprodutibilidade e validade do questionário Saúde na Boa para avaliar atividade física e hábitos alimentares em escolares do ensino médio. Rev Bras Ativ Fis Saúde 2007;12(3):12-20.
5. Prochaska JJ, Sallis JF, Long B. A Physical activity screening measure for use with adolescents in primary care. Arch Pediatr Adolesc Med 2001;155(5):554-9.
6. Milton K, Bull FC, Bauman A. Reliability and validity testing of a single-item physical activity measure. Br J Sports Med 2011;45(3):203-8.
7. Brasil. Instituto Brasileiro de Geograia e Estatística. Pesquisa Nacional de Saúde Escolar (PeNSE) - 2012. Rio de Janeiro: IBGE; 2013.
8. Currie C, Zanotti C, Morgan A, Currie D, Looze M, Roberts C, et al. Social determinants of health and well-being among young people: Health Behaviour in School-aged Children (HBSC) study: international report from the 2009/2010 survey. Copenhagen: WHO Regional Oice for Europe; 2012. 129-32 p.
9. Kann L, Kinchen S, Shanklin SL, Flint KH, Kawkins J, Harris WA, et al. Youth risk behavior surveillance–United States, 2013. MMWR 2014;63(supplement 4):1-168.
10. Nahas MV, Barros MVG, Goldine BD, Lopes AS, Hallal PC, Farias Júnior JC, et al. Physical activity and eating habits in public high schools from diferent regions in Brazil: the Saude na Boa project. Rev Bras Epidemiol 2009;12(2):270-7.
11. Prado CV, Lima AV, Fermino RC, Añez CRR, Reis RS. Apoio social e prática de atividade física em adolescentes da rede pública de ensino: qual a importância da família e dos amigos? Social support and physical activity in adolescents from public schools: the importance of family. Cad Saúde Pública 2014;30(4):827-38.
12. Tenório MCM, Barros MVG, Tassitano RM, Bezerra J, Tenório JM, Hallal PC. Atividade física e comportamento sedentário em adolescentes estudantes do ensino médio. Rev Bras Epidemiol 2010;13(1):105-17.
13. Ridley K, Olds T, Hands B, Larkin D, Parker H. Intra-individual variation in children’s physical activity patterns: implications for measurement. J Sci Med Sport 2009;12(5):568-72.
14. De Vries SI, Hopman-Rock M, Bakker I, Van Mechelen W. Meeting the 60-Min physical activity guideline: efect of operationalization. Med Sci Sports Exer 2009;41(1):81-6.
15. Domínguez-Berjón F, Borrell C, Nebot M, Plasència A. Physical activity as-sessment in population surveys: can it really be simpliied? Int J Epidemiol 1999;28(1):53-7.
16. Farias Júnior JC, Reis RS, Hallal PC. Physical activity, psychosocial and perceived environmental factors in adolescents from Northeast Brazil. Cad Saúde Pública 2014;30(5):941-51.
17. ABEP (Associação Brasileira de Empresas de Pesquisa). Critério de classiicação econômica Brasil. Available from: http://www.abep.org/novo/Default.aspx [2013 May 20].
CORRESPONDING AUTHOR José Cazuza de Farias Júnior Universidade Federal da Paraíba, Departamento de Educação Física Campus I, Cidade Universitária CEP: 58051-900 – João Pessoa, PB. Brasil
E-mail: [email protected]
data. Biometrics 1977;33(1):159-74.
21. Feuerman M, Miller AL. Relationships between statistical measures of agreement: sensitivity, speciicity and kappa. J Eval Clin Pract 2008;14(5):930-3.
22. Wanner M, Probst-Hensch N, Kriemler S, Meier F, Bauman A, Martin BW. What physical activity surveillance needs: validity of a single-item questionnaire. Br J Sports Med 2014;48:1570-6.
23. Martínez-Gómez D, Martínez-De-Haro V, Del-Campo J, Zapatera B, Welk GJ, Villagra A, et al. Validez de cuatro cuestionarios para valorar la actividad física en adolescentes españoles. Gac Sanit 2009;23(6):512-7.
24. Jekauc D, Reimers AK, Wagner MO, Woll A. Prevalence and socio-demographic correlates of the compliance with the physical activity guidelines in children and adolescents in Germany. BMC public health 2012;12:714.
25. Ridgers ND, Timperio A, Crawford D, Salmon J. Validity of a brief self-report instrument for assessing compliance with physical activity guidelines amongst adolescents. J Sci Med Sport 2012;15(2):136–41.
26. Gilson ND, Cooke CB, Mahoney CA. A comparison of adolescent moderate-to-vigorous physical activity participation in relation to a sustanaid or accumalated criterion. Health Educ Res 2001;16(3):335-41.