ABSTRACT:Objective: To present the results of indicators of alcohol consumption and driving for Brazilian capitals based on two population surveys performed in Brazil in 2013. Methods: Cross sectional study with data from adults (≥ 18 years) participants of the Telephone Survey on Risk and Protective Factors for Chronic Diseases (Vigitel) and the National Health Survey (NHS). Prevalence for indicators of alcohol consumption and driving was then calculated. Results: The proportion of adult drivers who drove soon after drinking was signiicantly higher among males (29.3% – Vigitel and 24.4% – NHS), the young aging 18 to 29 years (31.6% – Vigitel and 24.1% – NHS) and among residents of the capitals of the Midwest (33.7% – Vigitel and 28.3% – NHS). The proportion of adults who reported drinking and driving was higher among males (9.4% – Vigitel and 7.4% – NHS) in the 18 to 29 age group (7.1% – Vigitel; 4.5% – NHS), and among residents of the capitals of the Midwest (7.9% – Vigitel and 6.1% – NHS). Conclusion: The study estimated the prevalence of the habit of driving after alcohol consumption among drivers and in the general population. There was consistency between the results from two nationwide surveys.
Keywords: Alcohol drinking. Automobile driving. Accidents, traic. Risk factors. Health surveys. Law enforcement.
Alcohol consumption and driving in
Brazilian capitals and Federal District
according to two national health surveys
Consumo de bebidas alcoólicas e direção de veículos nas capitais brasileiras
e no Distrito Federal, segundo dois inquéritos nacionais de saúde
Deborah Carvalho MaltaI,II, Regina Tomie Ivata BernalIII, Márcio Dênis Medeiros MascarenhasIV,
Marta Maria Alves da SilvaI, Celia Landman SzwarcwaldV, Otaliba Libânio de Morais NetoVI
IDepartment of Noncommunicable Diseases Surveillance, and Health Promotion, Secretariat of Health Surveillance, Ministry of
Health – Brasília (DF), Brazil.
IINursing school, Universidade Federal de Minas Gerais – Belo Horizonte (MG), Brazil. IIIPublic Health School, Universidade de São Paulo – São Paulo (SP), Brazil.
IVDepartament of Community Medicine, Universidade Federal do Piauí – Teresina (PI), Brazil.
VInstitute for Communication and Science Information and Health Technology, Fundação Oswaldo Cruz – Rio de Janeiro (RJ), Brazil. VIDepartment of Public Health, Institute of Tropical Pathology and Public Health, Universidade Federal de Goiás – Goiânia (GO), Brazil. Correspondence to: Deborah Carvalho Malta, Departamento de Vigilância de Doenças e Agravos não Transmissíveis e Promoção da Saúde, Secretaria de Vigilância em Saúde, Ministério da Saúde, SAF Sul, Trecho 02, Lotes 05 e 06, Bloco F, Torre I, Edifício Premium, Térreo, Sala 16, CEP: 70070-600, Brasília, DF, Brasil. E-mail: dcmalta@uol.com.br
Conlict of interests: nothing to declare – Financial support: none.
INTRODUCTION
The consumption of alcoholic beverages is among practices and cultural habits of various civilizations for millennia. Thus, their intake is encouraged and associated with festivities, religious ceremonies, celebrations and moments of joy1,2. However, alco-hol is also associated with deleterious effects. The World Health Organization (WHO) links alcohol to about 1.8 million deaths worldwide (3.2% of all deaths), and to 4% of diseases, which represents 58.3 million disability-adjusted life years (DALYs). Alcohol is the fifth leading risk factor when it comes to premature deaths and disabilities world-wide1. In the Americas, alcohol consumption has been considered the most important risk factor for diseases2,3.
The problems caused by alcohol intake can afect not only the consumer, but their fam-ily and social circle, as in cases of domestic violence, marital conlict, child abuse4. Alcohol consumption can result in social and health consequences, including reduced productivity at work, violent behavior, sports and leisure injuries, traic deaths and injuries4,5, unsafe sex and use of other psychoactive substances6.
Even in small amounts, alcohol increases the risk of involvement in traic accidents for both drivers and pedestrians, for it changes judgment capacity, vision, reaction time and motor coordination7. Studies conducted in Brazil show the high frequency of alcohol consumption among victims of car accidents and violence seen at emergency services8,9. Even being preventable conditions, the combination of alcohol and driving may account for approximately 20 to 50% of traic-related deaths1,2,10.
RESUMO:Objetivo: Apresentar os resultados dos indicadores sobre consumo de álcool e direção para as capitais brasileiras obtidos em dois inquéritos populacionais realizados em 2013 no Brasil. Métodos: Estudo transversal realizado com dados da população adulta (≥ 18 anos) participante da Vigilância de Doenças Crônicas por Inquérito Telefônico (Vigitel) e da Pesquisa Nacional de Saúde (PNS). Foram calculadas as prevalências para os indicadores de consumo de bebida alcoólica e direção veicular. Resultados: A proporção de motoristas adultos de carro ou moto que dirigiram logo depois de beber foi signiicativamente maior no sexo masculino (29,3% – Vigitel; 24,4% – PNS), entre jovens de 18 a 29 anos (31,6% – Vigitel; 24,1% – PNS) e entre os residentes das capitais da Região Centro-Oeste (33,7% – Vigitel; 28,3% – PNS). A proporção de adultos que referiram beber e dirigir foi maior no sexo masculino (9,4% – Vigitel; 7,4% – PNS), no grupo de 18 a 29 anos (7,1% – Vigitel; 4,5% – PNS) e entre os residentes das capitais da Região Centro-Oeste (7,9% – Vigitel; 6,1% – PNS). Conclusão: O estudo permitiu estimar a prevalência do hábito de dirigir após ingestão de bebida alcoólica entre motoristas e na população em geral e mostrou coerência entre os resultados dos dois inquéritos epidemiológicos de abrangência nacional.
Because of this evidence, the Brazilian Ministry of Health began to monitor alcohol consumption and driving among Brazilians through two major epidemiological surveys: the Telephone Survey on Risk and Protective Factors for Chronic Diseases (Vigitel)11, held since 2007 by the MoH, and the National Health Survey (NHS), conducted by the Brazilian Institute of Geography and Statistics (IBGE), in partnership with the MoH in 201312.
The aim of this study was to present the results of indicators on alcohol consumption and driving obtained from two population surveys (Vigitel and NHS), held in 2013.
METHODS
Cross-sectional study with data from an adult population (≥ 18 years) participating in Vigitel and NHS surveys in 2013.
Vigitel data from adults (≥ 18 years) living in the capitals of the 26 Brazilian states and the Federal District were analyzed, all of them having a phone number. Vigitel is based on two-stage probabilistic sample draw:
• systematic draw of 5,000 telephone lines in each city, followed by a second draw and organization of 25 replicates (subsamples) of 200 lines;
• draw of an adult resident (≥ 18 years) of the household to answer the interview. About 54,000 people were interviewed, with about 2,000 interviews per city/year.
The calculation of post-stratiication weight was made by the rake method, consider-ing gender, age and educational level, aimconsider-ing to match the composition of the sample of the city to the socio-demographic composition of the whole adult population of each city in the year of survey11.
NHS was held in 2013, being an epidemiological home-based survey representative of the major regions of Brazil, federal units and capitals. Sample calculation was initially performed randomly based on census data from 2010. The planned sample was 81,167 households, considering those with residents; 69,994 households were eligible, and interviews were con-ducted in 64,348 households, with an 8.1% rate of non-response12.
The sampling plan of the NHS was made in three stages. The primary sampling units (PSUs) were the census sectors or set of sectors; secondary units were households; tertiary units were adult residents (≥ 18 years). Weighting factors were calculated for each sampling unit, considering probabilities of selection. The weighting factor for the resident selected for interview was also calculated considering the weight of the household, non-response adjustment for sex and balanced with total population by sex and age groups, estimated with the weight of all residents. Details about the sampling and weighting processes are provided in the publication of NHS results12.
The study population consisted of adults aging 18-74 years, living in the capitals of Brazil and the Federal District. Prevalence and respective 95% conidence interval (95%CI) were calculated for each indicator, stratiied by sex, age group (18-29, 30-59, 60-64, 65-74 years), educational level (uneducated and incomplete primary school; complete primary school and incomplete high school; complete high school and incomplete higher education; higher education), race/skin color (white, black and brown) and set of capitals by geo-graphic regions (North, Northeast, Southeast, South and Midwest). Data were analyzed in Stata version 11.0 (StataCorp., CollegeStation, USA), using the command “survey” for complex samples.
The participation of adults in the survey was voluntary and conidentiality of information was guaranteed. Both surveys were approved by the National Research Ethics Committee, reports 13,081/2008 and 355,590/2013 (Vigitel) and 328,159/2013 (NHS).
Proportion (%) of adult drivers (≥ 18 years) who drove soon ater using alcohol
Indicator 1 ‑ Numerator: people who use alcohol and drive soon ater it. ‑ Denominator: total of drivers (cars or motorcycles) who reported using alcohol.
Source Vigitel NHS
Questions
1. Do you usually intake alcoholic beverage? (yes)
2. How oten do you use alcohol? (any level) 3. In that day (or any other day), did you drive ater drinking? (yes)
4. Regardless of quantity, do you usually drive ater drinking? (always and
sometimes)
1. How oten do you use alcohol? (once or more per month).
*(Note that NHS does not consider people who reported not using alcohol/never
drinking and drinking less than once a month in the numerator).
2. Whenever you used alcoholic beverages, did you drive soon ater it? (yes)
Proportion (%) of adult drivers (≥ 18 years) who drink and drive
Indicator 2 ‑ Numerator: people who use alcohol and drive soon ater it.‑ Denominator: total participants.
Source Vigitel NHS
Questions
1. Do you usually intake alcoholic beverage? (yes)
2. How often do you use alcohol? (any level)
3. In that day (or any other day), did you drive after drinking? (yes)
4. Regardless of quantity, do you usually drive after drinking? (always and
sometimes)
1. How oten do you use alcohol? (once or more per month).
*(Note that people who reported not using
alcohol/never drinking and drinking less
than once a month in the numerator were
not considered).
2. Whenever you used alcoholic beverages, did you drive soon ater it? (yes)
Vigitel: Telephone Survey on Risk and Protective Factors for Chronic Diseases; NHS: National Health Survey.
RESULTS
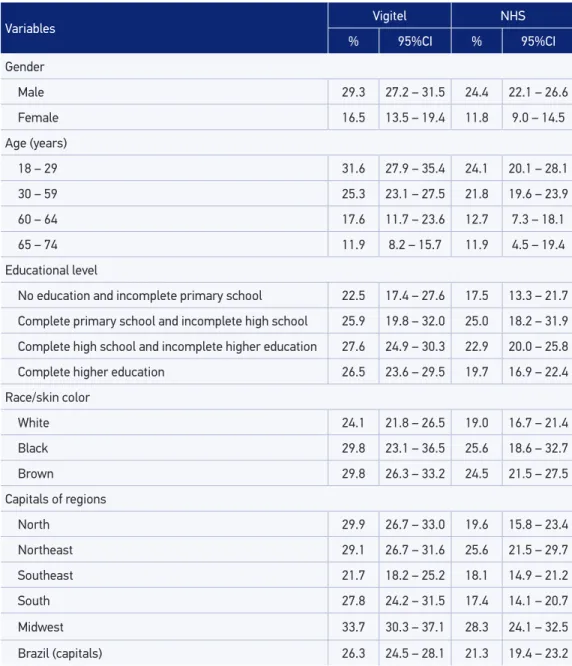
In 2013, Vigitel and NHS interviewed, respectively, 52,929 and 60,202 people aged ≥18 years. The proportion of adult that conducted cars or motorcycles soon after drinking was signiicantly higher among males both in Vigitel (29.3%) and NHS (24.4%). As for the age group, proportion was signiicantly higher among young people aging 18-29 years, with 31.6% in Vigitel and 24.1% in NHS. Regarding educational level, the reference to such behavior was more common among those with complete primary school and incomplete high school, with similar values in both surveys (25.9% in Vigitel and 25% in NHS) with-out signiicant diferences compared to other educational levels. The habit of driving after drinking was more common among black and brown-colored people, but with no signii-cant diference in both surveys, compared to whites (Table 1).
Table 1 also shows the habit of driving after consuming alcohol among residents of the state capitals and the Federal District reported by 26.3% of adults surveyed in Vigitel and 21.3% of the participants of NHS. Such behavior was mostly reported by residents of the capital of the Midwest Region (33.7% in Vigitel and 28.3% in NHS).
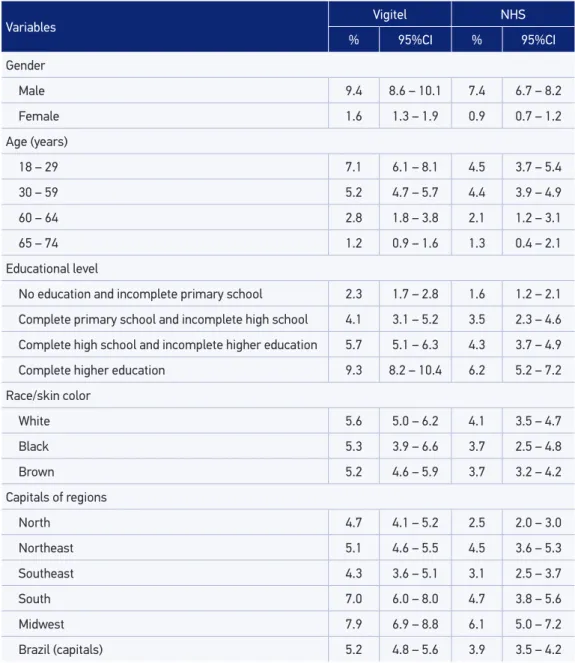
Table 2 presents the proportion of adults who reported drinking and driving in both surveys. The highest rates were obtained from male respondents (9.4% in Vigitel and 7.4% in NHS), with statistically signiicant diference compared to females. The age group 18-29 had the highest rate (7.1%), according to Vigitel, followed by the age group 30-59 (5.2%); in NHS, these groups reported 4.5% and 4.4%, respectively, with signiicant diference com-pared to other age groups. The habit of drinking and driving was more frequently reported among individuals who had completed higher education, with statistically signiicant dif-ference as compared to other levels of education. The highest proportion was seen among white people, but no diference was veriied in the distribution of this indicator according to race/skin color.
The habit of drinking and driving in the state capitals and the Federal District was reported by 5.2% of adults surveyed in Vigitel and 3.9% in NHS, reaching the highest frequency among residents of the Midwest region (7.9% in Vigitel and 6.1% in NHS), as shown in Table 2.
DISCUSSION
Variables Vigitel NHS
% 95%CI % 95%CI
Gender
Male 29.3 27.2 – 31.5 24.4 22.1 – 26.6
Female 16.5 13.5 – 19.4 11.8 9.0 – 14.5
Age (years)
18 – 29 31.6 27.9 – 35.4 24.1 20.1 – 28.1
30 – 59 25.3 23.1 – 27.5 21.8 19.6 – 23.9
60 – 64 17.6 11.7 – 23.6 12.7 7.3 – 18.1
65 – 74 11.9 8.2 – 15.7 11.9 4.5 – 19.4
Educational level
No education and incomplete primary school 22.5 17.4 – 27.6 17.5 13.3 – 21.7
Complete primary school and incomplete high school 25.9 19.8 – 32.0 25.0 18.2 – 31.9
Complete high school and incomplete higher education 27.6 24.9 – 30.3 22.9 20.0 – 25.8
Complete higher education 26.5 23.6 – 29.5 19.7 16.9 – 22.4
Race/skin color
White 24.1 21.8 – 26.5 19.0 16.7 – 21.4
Black 29.8 23.1 – 36.5 25.6 18.6 – 32.7
Brown 29.8 26.3 – 33.2 24.5 21.5 – 27.5
Capitals of regions
North 29.9 26.7 – 33.0 19.6 15.8 – 23.4
Northeast 29.1 26.7 – 31.6 25.6 21.5 – 29.7
Southeast 21.7 18.2 – 25.2 18.1 14.9 – 21.2
South 27.8 24.2 – 31.5 17.4 14.1 – 20.7
Midwest 33.7 30.3 – 37.1 28.3 24.1 – 32.5
Brazil (capitals) 26.3 24.5 – 28.1 21.3 19.4 – 23.2
Table 1. Proportion (%) of adult drivers* (≥ 18 years) who reported using alcohol and driving soon ater it according to sociodemographic variables and to region per survey (Vigitel and NHS). Brazil, 2013.
Source: Vigitel and NHS, 2013.
95%CI: 95% conidence interval; NHS: National Health Survey, 2013; *includes all interviewees in denominator.
United States13 and Japan14, which can be explained by cultural diferences and the imposi-tion of legal control over alcohol consumpimposi-tion15.
Variables Vigitel NHS
% 95%CI % 95%CI
Gender
Male 9.4 8.6 – 10.1 7.4 6.7 – 8.2
Female 1.6 1.3 – 1.9 0.9 0.7 – 1.2
Age (years)
18 – 29 7.1 6.1 – 8.1 4.5 3.7 – 5.4
30 – 59 5.2 4.7 – 5.7 4.4 3.9 – 4.9
60 – 64 2.8 1.8 – 3.8 2.1 1.2 – 3.1
65 – 74 1.2 0.9 – 1.6 1.3 0.4 – 2.1
Educational level
No education and incomplete primary school 2.3 1.7 – 2.8 1.6 1.2 – 2.1
Complete primary school and incomplete high school 4.1 3.1 – 5.2 3.5 2.3 – 4.6
Complete high school and incomplete higher education 5.7 5.1 – 6.3 4.3 3.7 – 4.9
Complete higher education 9.3 8.2 – 10.4 6.2 5.2 – 7.2
Race/skin color
White 5.6 5.0 – 6.2 4.1 3.5 – 4.7
Black 5.3 3.9 – 6.6 3.7 2.5 – 4.8
Brown 5.2 4.6 – 5.9 3.7 3.2 – 4.2
Capitals of regions
North 4.7 4.1 – 5.2 2.5 2.0 – 3.0
Northeast 5.1 4.6 – 5.5 4.5 3.6 – 5.3
Southeast 4.3 3.6 – 5.1 3.1 2.5 – 3.7
South 7.0 6.0 – 8.0 4.7 3.8 – 5.6
Midwest 7.9 6.9 – 8.8 6.1 5.0 – 7.2
Brazil (capitals) 5.2 4.8 – 5.6 3.9 3.5 – 4.2
Tabela 2. Proportion (%) of adult drivers* (≥ 18 years) who reported using alcohol and driving soon ater it according to sociodemographic variables and capitals of regions per survey (Vigitel and NHS). Brazil, 2013.
Source: Vigitel and NHS, 2013.
95%CI: 95% conidence interval; NHS: National Health Survey, 2013; *includes all interviewees in denominator.
Among many problems resulting from the harmful use of alcohol, driving under the effects of this drug increases the risk of traffic accidents1. In Brazil, studies have shown the relationship between the harmful effects of alcohol and driving. The review by Carlini Cotrim and Matta Chasin16 showed a study conducted in four Brazilian cities where alcohol was present in 92% (n = 865) of victims of traffic accidents’ blood in a typical week. Any amount of alcohol was found in 61% of the sample and 16.6% of the total sample had this value higher than 0.6 g/L. In Recife, during Carnival, 80.7% of victims of traffic accidents had positive blood alcohol testings17. In São Paulo, a study conducted in the emergency room of a public hospital found that 21.8% of victims of traffic accidents had any alcohol concentration in blood18. In Diadema, São Paulo, 30% of drivers were under the influence of alcohol and 22% had blood alcohol concentra-tions above 0.6 g/L19.
The concentration of alcohol in blood produces several neuromotor changes even at low doses, since there is a reduction of attention, false perception of speed, euphoria and diiculty in perceiving diferent luminosities10.
Policies and legal restriction actions on alcohol consumption and driving, as the control of alcohol ads, the ban on sales to minors and laws that regulate the operation of alcohol outlets are important to reduce risk and, especially, to save lives1,2,4,10.
The literature shows signiicant reductions in the number of deaths and injuries in coun-tries that have adopted strict laws for alcohol consumption and driving, including the United States20, Cali, Colombia, among others2. Overall, the most efective measures are strict leg-islation, systematic and continued supervision, and a strong law system to ensure that the ofenders are penalized10.
Studies on Vigitel data21,22 show improvements over the habit of drinking abusively and driving, which shows a change in the habits of the population, with decline in the trend of drinking and driving between 2007 and 2013 among men of all educational levels in most regions of the country. Thus, the importance of prohibition of alco-hol consumption before driving is confirmed, coinciding with the publication of laws 11,705/200823 and 12,760/201224, reinforcing the importance of the regulatory frame-work prohibiting drinking and driving. In 2012, the new law improved and contributed to the reduction of driving after alcohol abuse when other testimonial evidence and extensive sanctions to the offender were established24. More recently, other initiatives such as the Life in Traffic Program25 resulted in reduction of mortality in capitals where it was initially implemented.
values were very similar. Another possible diference between the results of surveys may result from interview approaches: while Vigitel takes telephone interviews, NHS does it face-to-face. A face-to-face interview can cause the interviewee to feel embarrassed when reporting something that is considered illegal.
Among the limitations of this study, we point the fact that data were restricted to capital cities, where more rigorous supervision is expected. The studies adopted diferent method-ologies and samples. While Vigitel was held with a population with telephone lines in the capitals, NHS was conducted in households. These methodological issues can afect com-parability of surveys, for they use diferent strategies for sampling, with face-to-face data collection in NHS and by phone in Vigitel, also with diferent questions and ilters. The use of weighting factors in Vigitel enables correction of estimates for factors studied in the adult population of all the cities11.
However, the results were similar and point out the importance of the problem of drinking and driving in Brazilian capitals, conirming the need to monitor and establish punishment measures.
CONCLUSION
The study allowed us to estimate the prevalence of the habit of driving after alcohol consumption among drivers and in the general population with two epidemiological sur-veys nationwide. Although distinct in methodology, both are useful to monitor this risky condition for morbidity and mortality resulting from the combination of alcohol intake and driving in Brazil.
1. World Health Organization. International guide for monitoring alcohol consumption and related harm. Geneva: WHO; 2002.
2. Monteiro MG. Alcohol y salud pública en las Américas: un caso para la acción. Washington, D.C: Organización Pan Americana de la Salud; 2007.
3. Rehm J, Monteiro M. Alcohol consumption and burden of disease in the Americas –implications for alcohol policy. Rev Panam Salud Publica 2005; 18(4-5): 241-8.
4. Borges G, Cherpitel C, Orozco R, Bond J, Ye Y, MacDonald S, et al. Multicenter study of acute alcohol use and non-fatal injuries: data from the WHO collaborative study on alcohol and injuries. Bull World Health Organ 2006; 84(6): 453-60. 5. MacDonald S, Cherpitel C, De Souza A, Stockwell
T, Borges G, Giesbrecht N. Variations of alcohol
impairment in diferent types, causes and contexts of injuries: results of emergency room studies from 16 countries. Accid Anal Prev 2006; 38(6): 1107-12. 6. Oliveira-Campos M, Nunes ML, Madeira FC, Santos
MG, Bregmann SR, Malta DC, et al. Comportamento sexual em adolescentes brasileiros, Pesquisa Nacional de Saúde do Escolar (PeNSE 2012). Rev Bras Epidemiol 2014; 17(Suppl. 1): 116-30.
7. Organización Mundial de la Salud. Drinking and driving: a road safety manual for decision-makers and practitioners. Genebra: OMS; 2007.
8. Mascarenhas MDM, Malta DC, Silva MMA, Gazal-Carvalho C, Monteiro RA, Morais Neto OL. Consumo de álcool entre vítimas de acidentes e violências atendidas em serviços de emergência no Brasil, 2006 e 2007. Ciênc Saúde Coletiva 2009; 14(5): 1789-96.
9. Legay LF, Santos AS, Lovisi GM, Aguiar JS, Borges JC, Mesquita RM, et al. Acidentes de transporte envolvendo motocicletas: peril epidemiológico das vítimas de três capitais de estados brasileiros, 2007. Epidemiol Serv Saúde 2012; 21(2): 283-92.
10. World Health Organization. Strategies to reduce the harmful use of alcohol. Geneva: WHO; 2008. Disponível em http://apps.who.int/gb/ebwha/pdf_iles/A61/ A61_13-en.pdf. (Acessado em 10 de abril de 2013). 11. Brasil. Ministério da Saúde. Vigitel 2013: Vigilância de
fatores de risco e proteção para doenças crônicas por inquérito telefônico. Brasília: Ministério da Saúde; 2014. 12. Instituto Brasileiro de Geograia e Estatística. Pesquisa Nacional de Saúde 2013: percepção do estado de saúde, estilos de vida e doenças crônicas. Rio de Janeiro: IBGE; 2014.
13. Jewett A, Shults RA, Baner jee T, Bergen G. Alcohol-impaired driving among adults-United States, 2012. MMWR Morb Mortal Wkly Rep 2015; 64(30): 814-7.
14. Nakahara S, Katanoda K, Ichikawa M. Onset of a declining trend in fatal motor vehicle crashes involving drunk-driving in Japan. J Epidemiol 2013; 23(3): 195-204. 15. Sloan FA, Chepke LM, Davis DV. Addiction, drinking behavior, and driving under the inluence. Subst Use Misuse 2014; 49(6): 661-76.
16. Carlini-Cotrim B, da Matta Chasin AA. Blood alcohol content and death from fatal injury: a study in the metropolitan area of São Paulo, Brazil. J Psychoactive Drugs 2000; 32(3): 269-75.
17. Oliveira E, Melcop AG. Uso de álcool nas vítimas de acidentes de transito no Carnaval. In: Álcool e trânsito. Recife: Instituto RAID; 1997. P. 72-86.
18. Gazal-Carvalho C, Carlini-Cotrim B, Silva OA, Sauaia N. Prevalência de alcolemia em vítimas de causas
externas admitidas em centro urbano de atenção ao trauma. Rev Saúde Pública 2002; 36(1): 47-54. 19. Duailibi S, Pinsky I, Laranjeira R. Prevalência de beber
e dirigir em Diadema. Rev Saúde Pública 2007; 41(6): 1058-61.
20. National Highway Traffic Safety Administration. A review of the literature on the efects of low doses of alcohol on driving-related skills. Disponível em: http://www.nhtsa.dot.gov (Acessado em 22 de janeiro de 2008).
21. Moura EC, Malta DC, Morais Neto OL, Penna GO, Temporão JG. Direção de veículos motorizados após consumo abusivo de bebidas alcoólicas, Brasil, 2006 a 2009. Rev Saúde Pública 2009; 43(5): 891-4. 22. Malta DC, Bernal RTI, Silva MMA, Claro RM, Silva
Júnior JB, Reis AAC. Consumo de bebidas alcoólicas e direção de veículos, balanço da lei seca, Brasil 2007 a 2013. Rev Saúde Pública 2014; 48(4): 692-6. 23. Brasil. Lei nº 11.705, de 19 de junho de 2008. Dispõe
sobre o consumo de bebida alcoólica por condutor de veículo automotor, e dá outras providências. Diário Oicial da União, Brasília, 20 jun. 2008.
24. Brasil. Lei nº 12.760, de 20 de dezembro de 2012. Altera a Lei nº 9.503, de 23 de setembro de 1997, que institui o Código de Trânsito Brasileiro. Diário Oicial da União, Brasília, 21 dez. 2012.
25. Morais Neto OL, Silva MMA, Lima CM, Malta DC, Silva Junior. JB. Grupo Técnico de Parceiros do Projeto Vida no Trânsito. Projeto Vida no Trânsito: avaliação das ações em cinco capitais brasileiras, 2011-2012. Epidemiol Serv Saúde 2013; 22(3): 373-82.
Received on: 04/17/2015