*e-mail: [email protected]
Current adress: Institute for Advanced Studies, Aerospace Technological Centre, Brazil.
Cracking Susceptibility of Aluminum Alloys During Laser Welding
Lara Abbaschiana, Milton Sergio Fernandes de Limab*
aDepartment of Materials Science and Engineering,
Massachusetts Institute of Technology, Massachusetts, USA bLaboratory of Physical Metallurgy,
Swiss Federal Institute of Technology, Lausanne, Switzerland
Received: November 19, 2002; Revised: February 23, 2003
The influence of laser parameters in welding aluminum alloys was studied in order to reduce hot cracking. The extension of cracks at the welding surface was used as a cracking susceptibility (CS) index. It has been shown that the CS changes with changing welding velocity for binary Al-Cu alloys. In general, the CS index increased until a maximum velocity and then dropped to zero, generating a typical λ-curve. This curve is due to two different mechanisms: 1) the refinement of porosities with increasing velocity and 2) the changes in the liquid fraction due to decreasing microsegregation with increasing velocities.
Keywords:weld cracking, cracking susceptibility, aluminum alloys
as Al-Si, to the weld. However, this leads to a shorter solidi-fication interval. The filler wire technique has two major disadvantages. Firstly, the macroscopic properties of the joint will change in an uncontrolled way. Secondly, the small size of the laser beam leads to occasional feeding of filler wire directly into the beam, causing inconsistent penetration and weld-pool instability. For example, adding a 4043 Al-Si al-loy wire to the 6061 alal-loy weld reduces hot cracking
sus-ceptibility4, but both the tensile and ultimate strengths are
reduced by 50%. Therefore an optimization of the process parameters in order to reduce cracking sensitivity would be highly desirable for the production of light weight high-strength components, especially for transport equipment industry.
Various studies about hot cracking phenomena in me-tallic alloys can be found in the literature. Clyne and Davies5,
states that the Hot Cracking Susceptibility (HCS) is directly linked to a critical ratio in the solidification period. Feurer6
proposed that cracks will appear in the mushy zone if the rate of interdendritic liquid feeding is smaller or equal to the rate of shrinkage. In the same way, Piwonka and
Flemings’ approach7 is based on the Poisseuille equation
which describes the pressure gradient required to cause a
1. Introduction
Laser welding aluminum alloys offers many advantages: precise heat input, narrow weld bead, narrow heat-affected zone, minimal thermal distortion, as well as elevated weld-ing speeds on thin sections and deep penetration on thick sections. It is because of these advantages that the applica-tion of laser welding of aluminum alloys is increasing, such
as in the automobile sector for body and exterior paneling1,2.
Although aluminum alloys are weldable by other more tra-ditional fusion welding methods, the laser offers unique qualities that make it an ideal technology for joining aluminum alloys. Most strain-hardenable alloys (for exam-ple, AA5182 and AA5754) can be laser welded autogenously, although filler metal can be introduced dur-ing laser welddur-ing to add reinforcement or to improve the strength and ductility of the joint, if desired. Many heat-treatable alloys (for example, AA6016) are susceptible to
hot cracking3 during welding, due both to their chemical
fluid to flow along interdendritic path. All these theories are linked to the alloy solidification path and the HCS can be determined by the cooling curves in thermal calorimetry.
For some binary alloys, it is verified the typical λ-shape
when the Cracking Susceptibility (CS) is plotted as a func-tion of the solute content. A more realistic approach of the
CS criterion had been published by Rappaz et al.8. This
cri-terion accounts for the tensile deformation of the solid skel-eton perpendicular to the dendrite growth direction and for the feeding of the interdendritic liquid. The authors suggest that hot cracks will nucleate if the cavitation pressure reaches a critical value which can be calculated from the physico-chemical properties of the alloy and the microstructural
di-mensions of the material. The typical λ-shape is maintained
after Rappaz analyses however the strain-stress conditions in the solidification region of the melt pool readily changes both its magnitude and position.
Hot cracking susceptibility during welding is usually evaluated when the strain or stress is changed during the process. Some examples are the Sigmajig, Varestrain and
Houldcroft tests9,10. These tests are performed in a specific
mechanical device where loading or bending is applied. The major limitations of these methods include poor reproduc-ibility due to complex mounting geometry and difficult in-terpretation of the results after testing.
A precise control of the solidification process reduces the cracking sensitivity. Using a pulsed Nd:YAG laser,
Katayama and collaborators11 developed a pulse shaping
method in which the laser power is continuously decreased with time to control the rate of solidification. These authors showed that pulse shaping could effectively reduce hot
cracking in Al-Cu alloys12. The major limitation of the
method is the small processing velocity, as the pulse length increases from 5 to 20 ms, the welding speed is reduced by a factor of four.
Continuous laser processing is a desirable welding tech-nique due to processing speed, weld quality and mechani-cal joining properties. The Al-Cu system is the base of com-mercial alloys which are particularly affected by hot crack-ing. The present work intends to determine the effects of the laser processing parameters such as power and scan-ning speed on the cracking susceptibility of Al-Cu alloys containing 0.5, 1, 2, 3, and 5 wt% Cu. Additionally, a major contribution is given to the study of a methodology for rapid Cracking Susceptibility evaluation of these alloys.
2. Experimental
Five different Al-Cu alloys with nominal compositions of 0.5, 1, 2, 3 and 5 wt% Cu were used to study the cracking susceptibility by laser remelting. Each alloy was prepared from high purity raw materials by vacuum melting and cast-ing in a copper mold. The alloys were cast in rectangular
shaped molds with 8 × 8 × 40 mm dimensions except for the 1 wt% Cu alloy which was cast in a 10 × 10 × 45 mm mold. The surface of the sample to be laser treated was pol-ished using SIC 1000 mechanical grinding to remove the oxide coating and to ensure reproducible surface roughness. The polished surface was then processed using a 1.7 kW
CW-CO2 laser consisting of the laser source, a beam
deliv-ery system, and a CNC worktable. The distance between the mirror and the sample was fixed at 152 mm and the incident laser beam was at an angle of 8 degrees. The diam-eter of the beam was 0.26 mm. Helium was blown over the
sample at a rate of 3 × 10⁻³ m3/min to prevent massive
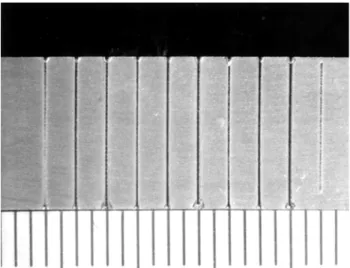
oxi-dation. Laser welding was conducted at ambient tempera-ture along the width of each sample, Fig. 1. The laser power and speed were varied for each pass, with power settings of 1200, 1300, and 1400 W and scanning speeds of 1, 2, 5, 10, and 50 mm/s.
The surfaces of the samples after laser processing were initially polished with 1000 SiC paper to eliminate the sur-face roughness. The polishing then proceeded to 6 mm dia-mond spray on a cloth wheel at 400 rpm until the traces from the 1000 SiC paper polishing were eliminated. Finally,
1 µm diamond polishing was used at 200 rpm to obtain a
mirror-like surface. Ethanol was used throughout the entire polishing process to keep the sample-wheel interface lubri-cated. In between each level of polishing, the sample was ultrasonically cleaned for 10 min in an ethanol bath to pre-vent contamination from the prior polishing step. Once the sample attained a mirror-like surface, deep etching was con-ducted using Keller’s Etch, consisting of 1% HF (48%),
1.5% HCl, 2.5% HNO3, and 95% H2O. The time for
suffi-cient deep etching varied with each alloy somewhat, but 15 s was found to be adequate for most samples. With a
proper deep etch, the laser traces, fissures, and the grain boundaries were well defined. Then the sample was
repolished using the 1 µm diamond polishing compound to
remove etched grain boundaries, leaving only the fissures and the faint appearance of the liquid trace. As discussed later, the repolishing process was found to be necessary to eliminate any doubt of whether a microstructural feature is a grain boundary or a fissure.
The as-polished surface of the samples was observed using an optical microscope at a magnification of 200×. The regions with the highest density of fissures were identified and photographed. To quantitatively define the cracking susceptibility (CS) of each trace, the photographs were en-larged and the total length of the fissures was determined. For curved fissures, the length of the fissure was broken into small linear segments in order to obtain more accurate length determination. The summation of all the fissures in the region was divided by the surface area of the remelting trace to obtain the cracking susceptibility for the given la-ser power and speed combination for each alloy.
3. Results and Discussion
The general surface feature of a laser remelted sample before being polished is shown in Fig. 1. The figure shows traces of 10 laser passes. The width of the remelted zone was found to depend on the power for any given laser speed. In general, the width of the remelting zone increased with increasing the laser power.
The laser-melted zones were found to contain different degrees of fissures and to depend on the alloy composition and laser processing parameters. An example of a fissure from the alloy with 1 wt% Cu can be seen in the SEM im-age given in Fig. 2. The fissure shown in the figure is rela-tively short and lies diagonal to the laser travel direction. Some samples showed more extensive fissures as exempli-fied with the optical micrograph of Fig. 3.
The total fissure length in the most heavily-fissured re-gion of each laser melting trace was measured visually from the photographs. As indicated earlier, the cracking suscep-tibility (CS) was then obtained by dividing this length by the surface area of the laser melted zone. It should be noted that because of the fineness of the fissures and the lack of sharp contrast between the fissures and the remelted liquid traces, the computer image analysis technique could not be used for quantifying the cracking susceptibility. Using a fluo-rescent dye penetrant was also found to be inadequate, as the dye did not penetrate the fissures.
Other restrictions presented by the present method for measuring CS include omission of fissures too fine to be visible with 200× magnification and the difficulty in differ-entiating between deeply-etched grain boundaries and fis-sures. Porosities before laser treatment due to casting were
observed with a diameter of 10 µm. For this study it was
assumed that fissures shorter than this diameter would not further deteriorate tensile property of the remelted zone over that of the base metal. Thus fissures shorter than this criti-cal length were not considered in the determination of CS. The only fissures then that might have been omitted would have to be extremely fine to escape observation. For the differentiation between a fissure and deeply etched grain boundary, the repolishing of the etched surface was found to be adequate in removing the latter features. Moreover, a criti-cal evaluation of a potential fissure was conducted using po-larized light approaching at an angle. By adjusting the angle of the incident light, it was then possible to view the depth of the fissure and differentiate it from grain boundaries. Figure 3. Al – 2 wt% Cu sample remelted with a laser scanning speed of 5 mm/s and power of 1300 W. The region shown has a high density of fissures.
The above mentioned fissure density measurement does not account for fissure width. Notwithstanding, the meas-urement is believed to yield a more applicable quantifica-tion as it is the presence of fissures longer than the critical length which determine the failure of the laser welded re-gion.
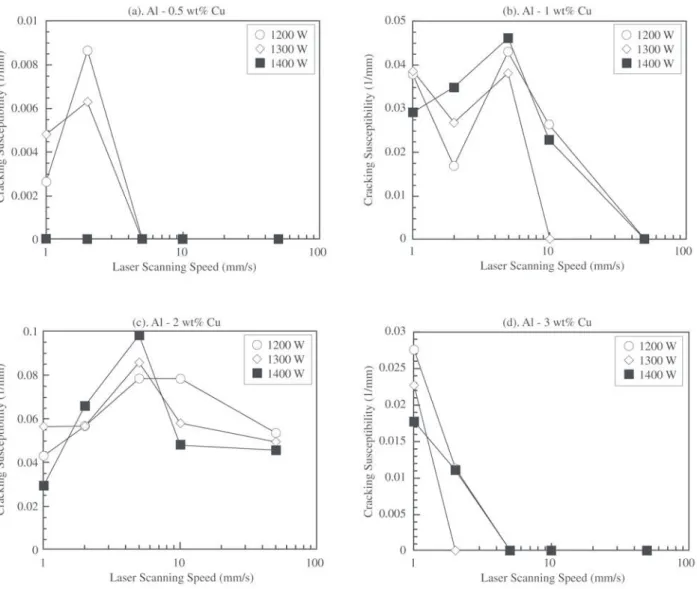
The cracking susceptibility for the alloys containing 0.5, 1, 2, and 3 wt% Cu is plotted against the laser scanning speed in Fig. 4a-d, respectively. No cracking was observed in the alloy containing 5 wt% Cu at any of the laser power and speeds utilized. The maximum error of the cracking suscep-tibility data points plotted in the figures was determined to be less than 4.6% for a 95% confidence level. This error was found to be dependent on the geometry of the fissures: being as low as 0.5% for small and straight fissures, and as large as 4.6% for heavily curved and extended cracks.
For the sample containing 0.5 wt% Cu, as shown in Fig. 4a, the cracking susceptibility at 1200 W followed the
so-called “λ” shape with increasing scanning speed. The
susceptibility increased with increasing the laser scanning speed from 1 to 2 mm/s. At higher speeds of 5, 10, and 50 mm/s, no cracks were observed in the laser melted traces. The cracking susceptibility decreased with increasing the laser power from 1200 to 1300 W, and totally diminished as the power was increased to 1400 W.
The “λ” trend was also observed for the cracking
suscep-tibility of the sample containing 1 wt% Cu, as shown in Fig. 4b. However, unlike the sample containing 0.5 wt% Cu, cracking was observed at all power settings when the veloc-ity was less than 10 mm/s. Further, the influence of the laser power on the susceptibility seemed to be less pronounced, as cracking was observed at all the power levels utilized.
For the sample containing 2 wt% Cu (Fig. 4c), the trend for the cracking susceptibility followed the same general trend as the samples containing 0.5 and 1 wt% Cu. How-ever, the cracking susceptibility did not diminish completely at any of the speeds utilized. On the other hand, for the sample containing 3 wt% Cu, the susceptibility decreased with increasing the scanning speed form 1 to 2 and 5 mm/s. No cracks were observed at speeds 10 and 50 mm/s. It is conceivable that the susceptibility data for this alloy
repre-sents the right side of the “λ” shape.
At the scanning speeds utilized, it was found that chang-ing the laser power between 1200, 1300, and 1400 W pro-duced no noticeable effects on the cracking susceptibility. The only noticeable effect of augmented power was the slightly increase in the diameter of the remelted trace.
As indicated earlier, no cracking was observed for 5 wt% Cu samples with the laser scanning speeds utilized. In fact, at low speeds, development of planar front growth was observed, indicating that constitutional undercooling was almost ob-tained. It is conceivable that had the scanning been performed
at higher speeds, the data would have covered the “λ” shape.
The curves obtained for changing the scanning speed at a given power (Fig. 4a-4d) can be seen to demonstrate the pres-ence of two different effects: (1) pore refining and (2) de-creasing solute rejection with inde-creasing processing velocity. As the scanning speed is augmented, the microstructure of the remelted volume becomes more refined. With this refinement, the radius of interdendritic pores left after so-lidification decreases. Decreasing pore radius decreases the probability that pores will link together through fissures, thus this effect would indicate that augmenting scanning speed decreases cracking susceptibility. This effect leads to a continuous decrease of CS with increasing velocity.
The second effect can be explained in terms of changes in microsegregation that occur with changes in laser scanning speed. Given an alloy composition, the micro-segregation will be large at low scanning speeds and then
go through a minimum as the velocity is increased13.
Fig-ure 5 presents the effect of growth velocity in the partition coefficient of the studied Al-Cu alloys using Aziz
formal-ism14. The residual liquid due to segregation decreases as
solidification velocity increases. In a first stage, the reduc-tion in the liquid fracreduc-tion between dendrite increases the cracking susceptibility (Fig. 4a-4c). This is because the rate of interdendritic liquid feeding is smaller than the rate of
shrinkage due to viscosity and surface tension6. In second
stage for higher velocity, the liquid volume is even smaller however the critical path for cracking networking is sur-passed. The mushy zone can accommodate the welding stresses which are distributed to the bulk material5. The “λ”
shape seen in the figures for each alloy seems to follow this trend. At low solute compositions, cracking susceptibility
is also low as the alloy behaves more like a pure metal. It must be pointed out that the solidification velocity can be different from the welding speed because the weld-ing speed represents the isotherms speed at the centerline of the fusion zone, whereas dendrites grow in some spe-cific crystallographic directions leading to an angle between growth and thermal gradient orientations. Consequently the velocities reported in Fig. 5 must be seen only in qualitative manner.
Finally, the present method of laser welding and obser-vation procedure is proposed as an alternative to the tradi-tional Cracking Susceptibility methods. The limitations of the method as pointed out above can guide for effective uti-lization of the procedure.
4. Conclusions
Laser welding of binary Al-Cu alloys was studied from the cracking susceptibility point of view. This study has yielded a methodology for quantifying cracking suscepti-bility of the remelted traces. Using this methodology, scan-ning speed versus cracking susceptibility was plotted for each alloy and each power. Two factors were determined to affect cracking susceptibility. First, increasing scanning speed decreases cracking susceptibility due to pore
refine-ment. Second, microsegregational effects yield a λ-shape
Acknowledgements
The authors would like to thank J.-D. Wagnière for the laser experiments as well as Professor W. Kurz for financial support and the use of laboratory facilities.
References
1. Bachhofer, A. Photonics Spectra, v. 32, p. 22, 1998.
2. Zhao, H., White; D.R.; Debroy, T. Intern. Mat. Reviews,
v. 44, p. 238, 1999.
3. Piwonka, T.S.; Flemings, M.C. Trans. Metall. Soc. AIME,
v. 236, p.1157, 1966.
4. Jensen, T.A.; Bruun, N.K. in Proc. 6th Int. Conf. Welding
and Melting by Electron and Laser Beams, Toulon, France, p. 163, June 1998.
5. Clyne, T.W.; Davies, G.J. J. British Foundry, v. 74, p. 65,
1981.
6. Feurer, U. Giessereiforschung, v. 28, p. 75, 1976.
7. Piwonka, T.S.; Flemings, M.C. Trans. Metall. Soc. AIME,
v. 236, p. 1157, 1966.
8. Rappaz, M.; Drezet, J.-M; Gremaud, M. Met. Trans., v.
30A, p. 449, 1999.
9. Kou, S. Solidification cracking of the fusion zone. In:
Welding Metallurgy, John Wiley & Sons, New York, USA, p 211, 1987.
10. Goodwin, G. Welding Journal, v. 66, p. 33-s, 1987.
11. Katayama, S.; Kohsaka, S.; Mizutani, M.; Nishizawa,
K.; Matsunawa, A. in Proc. ICALEO’93, Laser Institute
of America, USA, p. 487, Nov. 1993.
12. Michaud, E.J.; Kerr, H.W.; Weckman, D.C. in Proc. 4th
In. Conf. Trends in Welding Research, Tennessee, USA, p. 153, June 1995.
13. Sarreal, J.A.; Abbaschian, G.J. Met. Trans., v. 17A, p.
2067, 1986.