Recyclability of Pet from Virgin Resin
Sandro Donnini Mancini, Maria Zanin
Departamento de Engenharia de Materiais,
Universidade Federal de São Carlos,
Rodovia Washington Luís, km 235, 13565-905 São Carlos - SP, Brazil;
e-mail: [email protected]
Received May 5, 1998; Revised January 29, 1999
Bottle grade virgin PET (polyethylene terephthalate) resin was investigated through five consecutive injection molding steps to simulate recycling cycles. Tests were carried out after each recycling to evaluate degradation, crystallinity (by density and Differential Scanning Calorimetry-DSC measurements), hardness, and tensile and flexural properties. Consecutive recycling resulted in cumulative chain breaks caused by the material’s contact with degrading agents such as temperature, oxygen, mechanical stresses, light, and water. In the fifth recycling step, for example, the number of carboxylic end groups, an indicator of the extent of chain-break, tripled in comparison to the initial molecule. The smaller chains that were formed fit more easily among the larger ones, thus increasing the percentage of crystalline phase in the structure. These two changes in the polymer’s structure explained the recycled products’ final properties, i.e., the injected samples became progressively harder and more fragile in each recycling step.
Keywords: recycling, PET, crystallinity, degradation, mechanical properties
1. Introduction
The production of PET, which was first introduced as a synthetic fiber, grew rapidly after the development of solid state post-polymerization, a technique that increases the viscosity of PET, rendering it more suitable for blow mol-ding of disposable soft-drink bottles1-2.
The bottle manufacturing industry commonly uses three types of PET. The first, PET homopolymer, is poly-merized in a proportion of 1:1 terephthalic acid - TPA, or dimethyl terephthalate - DMT, and ethylene glycol - EG. The second type, known as PET copolymer, is polymerized with an excess of TPA (no more than 3% mol) or 1,4-cy-clo-hexanedimethanol (up to 5% mol) and appears to be the most adequate material in high-speed blow-molding. The third type, PETG (polyethylene terephthalate glycol), is a copolyester obtained from the polymerization of DMT with 15-34% mol of 1,4-cyclo-hexanedimethanol, mainly used for credit cards, blisters and displays3.
The PET homopolymer and its copolymer have similar characteristics, such as semi-crystallinity, their glass tran-sition temperature (Tg) is about 76 °C, their melting tem-perature (Tm) approximately 250 °C, density between 1.3
and 1.4 g/cm3, minimum viscosity is 0.7 dL/g, and they have similar infrared spectra. PETG, however, presents an infrared spectrum that differs from the other two types, with a density of approximately 1.27 g/cm3, minimum viscosity of 0.65 dL/g, and Tg around 86 °C. Moreover, because it is essentially amorphous, it does not have a melting peak3.
PET can be recycled by three different methods, using throwaways: 1) Energy recycling, which burns the plastic to use its calorific content. 2) Chemical recycling, as shown in Fig. 1, in which PET is subjected to reactions that are the opposite of those of polymerization (such as hydrolysis -Fig. 1) to obtain intermediary products such as polyglycols, or even monomers or initial materials (TPA or DMT and EG) from which plastic is made. 3) Mechanical recycling, the most commonly used method to recycle PET, consist-ing of a series of simple, well known and relatively cheap processes to grind, dry, wash and reprocess throwaways. This sequence of processes generally results in a degraded recycled structure when compared to the initial molecule, since the chains have been subjected to mechanical stresses, heat, light, oxygen and, in the case of PET, also water.
Thermodynamic estimates have shown that the weakest chemical connection in the PET chain is the ester link4, indicated in Fig. 1 by an arrow. Most of these degrading agents’ attack mechanisms concentrate here because less energy is required to break this link1,4-9. The lower molecu-lar weight of degraded chains facilitates their arrangement in the melted state, resulting in increased crystallinity after cooling and affecting the product’s final properties.
A recent study10 evaluated the properties of PET recy-cled from throwaways. However, the bottles were collected regardless of factors such as manufacturer, the time elapsed from production to collection, and exposure to degrading agents.
The purpose of this study was to evaluate the properties of PET recycled from virgin resin, such as the number of carboxylic end-groups, density, and thermal and mechani-cal properties as a function of consecutive recycling steps. An injection molding machine equipped with a water-cooled mold was used to simulate conditions to which virgin resin is first subjected when injected for later blow-molding of the bottle. The use of virgin resin permits one to control variables such as the resin’s origin, and the length of time it has been used and exposed to degrading agents, to improve the usability of materials recycled from PET.
2. Experimental
The resin that was studied was a bottle grade virgin PET, with 0.76 dL/g intrinsic viscosity, supplied by Fibra Nordeste S.A. The granules were vacuum oven dried at 110 °C for 3 h and injected into a PIC injection molding machine in the form of tensile11 and flexural12 specimens. Some specimens were subjected to mechanical testing and the remainder were ground. Flakes taken from the ground material were then subjected to differential scanning calo-rimetry (DSC), density and titration tests. The procedure was repeated until five injections had been completed. The virgin resin was labeled R0, while the injected samples were labeled R1, R2, R3, R4 and R5, according to their recycling step.
Carboxyl end-chains were counted by the Pohl method, based on the dissolution of the polymer in hot benzyl alcohol, followed by titration with a solution of sodium hydroxide in benzyl alcohol13.
Variations of Tg, Tm, and crystallization and fusion enthalpies were determined by DSC analyses (DuPont 9900), based on the ASTM D3417 and D341814-15 codes. The crystallinity was obtained in relation to a
hypotheti-cally 100% crystalline polymer, with a fusion enthalpy of 140.1 J/g16.
Sample density was determined by immersing the flakes in ethyl alcohol and carbon tetrachloride solutions, the former being less dense and the latter more dense than the polymer. Small amounts of one and/or the other solvent were added until the flakes became stabilized in the solu-tion. The density of the liquid was then measured with a pycnometer and the resulting value adopted as flake den-sity. Crystallinity was determined as relation to 100% amorphous and 100% crystalline polymer densities, 1.331 g/cm3 and 1.455 g/cm3, respectively17.
Test specimen hardness was measured with a Shore D type durometer18, while flexural and tensile tests were carried out with an Instron machine, model 112211-12.
3. Results and Discussion
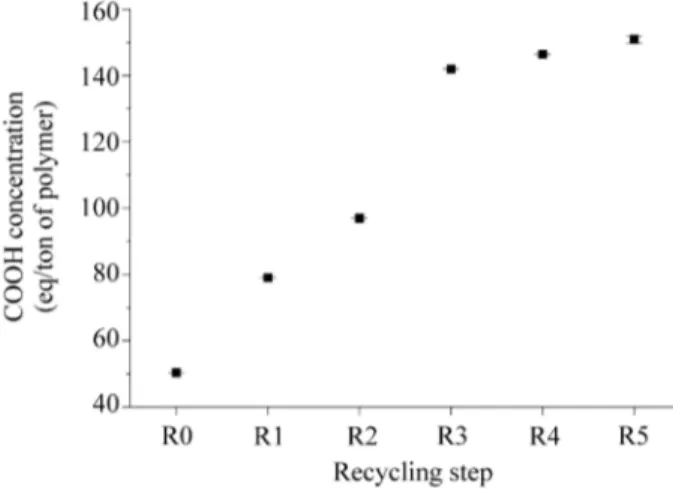
Figure 2 shows the number of carboxylic end-groups measured by titration after each injection step. As expected, increasing the number of recycling steps resulted in an higher number of carboxylic end-chains, with a final value almost triple that of virgin resin. In other words, successive grinding, drying and processing steps, associated or not with degrading agents such as oxygen, light and water, caused chain-breaks and a consequent drop in molecular weight with each new recycling step.
Figure 3 shows the R0 and R5 specimen thermograms obtained by DSC. Table 1 presents DSC and density data, as well as the crystallinity for each recycling step, accord-ing to each method.
Figure 2. Carboxylic end group concentrations of PET samples starting from virgin resin as a function of the recycling step.
HO-[C- -C-O-CH2-CH2-O]-H + H2O
O O
PET
HO-C- -C-OH + HO-CH2-CH2-OH O
O
TPA EG
The area of the melting peak grew with each successive recycling step, reaching a maximum in the R5 specimen, thus indicating a higher percentage of crystalline structure, which is only destroyed at temperatures in the range of 250 °C. This probably means that the cumulative chain breaks to which the polymer was subjected caused the smaller macromolecular units formed to fit more easily among the larger ones during cooling (quenching).
Significant differences were also observed in the other DSC results. At about 75 °C, there was a small deviation in the baseline of RO, which is characteristic of Tg. For R5, however, the difference was imperceptible on this scale since the amorphous chains, which begin to vibrate in this temperature range, were fewer and more immobilized by the growing number of crystalline units. The exothermic crystallization peak at around 160 °C only occurred with R0 and R1, indicating that, for the remaining samples, quenching was sufficient for the polymer to achieve maxi-mum crystallization.
Table 1 also presents the results of two R1 and two R2 samples, labeled R1t, R1o, R2t and R2o. The letters ‘‘t’’ (transparent) and ‘‘o’’ (opaque) indicate the presence of two
types of basic flakes of ground material. There was proba-bly a temperature gradient throughout the thickness of the injected test specimens due to uneven mold cooling. Abrupt cooling on the surface of the test specimen closest to the heat exchange source caused the amorphous phase to freeze, producing flakes that were transparent after grind-ing. The greater the distance from the heat exchange is, the lower the cooling rate is. This allows molecules to exist at high temperatures for longer periods of time, giving them mobility to become organized and, later, producing opaque flakes. A crystallinity gradient was formed throughout the samples’ thickness, which could, for example, affect the reproducibility of mechanical tests.
Visual differences between test specimens were only observed in tensile test specimens. The R1 specimens were highly transparent, while the R2 specimens were translu-cent and the remainder (R3, R4 and R5) were opaque.
Table 1 also shows the highly significant drop in crys-tallinity and density from the virgin sample (R0) to the first injection sample (R1). Virgin PET crystallinity is designed to be high to improve its processibility and future properties such as barrier to gases. However, this crystallinity is partially lost during cold mold injection, as was observed in the experiment. Similar and successive processing causes the melted resin to crystallize more and more easily owing to chain-breaks. Crystallinity has a tendency to increase, even under adverse conditions such as a cold mold, reaching the initial value.
Figure 4 shows the hardness test results, where one can see a clear tendency for increasing hardness at each succes-sive recycling step. This was expected since crystallinity, the percentage of rigid phase in the structure, also in-creased.
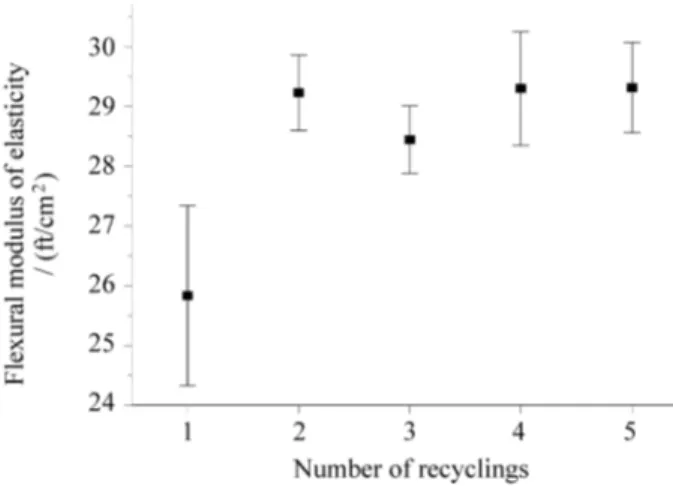
Figures 5 and 6, respectively, show the results of Flexural Modulus of Elasticity and the Maximum Strain. The results shown in Fig. 6 indicate high standard-devia-tion values, except in the last two recycling steps. One of the explanations for the low reproducibility of the test is the
Figure 3. DSC curves for the R0 (virgin PET) and R5 samples (virgin PET subjected to five injection steps).
Table 1. DSC and Density tests results and the respective crystallinity of PET samples starting from virgin resin as a function of recycling step
Sample Tg
(°C)
Tc (°C)
Tm
(°C) ∆
Hc (J/g)
∆Hf
(J/g)
%C (DSC)
Density (g/cm3)
%C (Density)
R0 76.4 164.5 249.4 32.0 35.5 25.3 1.378 38.0
R1t 83.1 132.6 253.1 5.5 29.4 21.0 1.334 4.3
R1o 84.8 - 253.2 - 37.6 26.8 1.339 6.3
R2t 76.7 - 252.4 - 37.9 27.1 1.337 4.9
R2o 82.9 - 253.0 - 44.8 32.0 1.364 18.8
R3 87.3 - 252.3 - 46.5 33.2 1.362 25.1
R4 85.7 - 253.1 - 48.9 34.9 1.373 34.2
shrinkage that occurred in almost all the flexural test speci-mens due to the decreased volume caused by the transfor-mation of the molten resin (essentially amorphous) into solid (semi-crystalline). Since shrinkage did not occur uni-formly throughout the specimens’ three dimensions, the specimens had to be put through a filing plane to obtain the flat surface required for the test, varying the thickness from one specimen to the other. This variation was added, for example, to the variation in the crystallinity in each sample, resulting in high standard-deviations.
The average results, however, particularly those rela-ting to Maximum Strain, were in agreement the results of crystallinity obtained by DSC and Density measurements, since the higher the specimens’ crystallinity, the lower the structure’s ductile phase. Moreover, the drop in molecular weight from one injection step to the next, indicated by the results in Fig. 2, also contributed to decreased deformation by reducing the average size of deformation resistant chains.
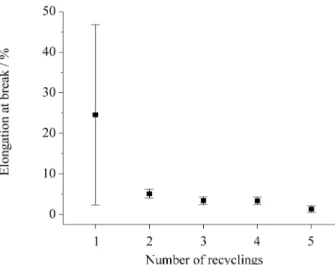
Figures 7 and 8 present the results of Modulus of Elasticity -also known as Young’s Modulus- and
Elonga-tion at Break obtained by tensile testing. Again, the stan-dard-deviation was high, particularly in the Modulus of Elasticity. The problems relating to the test specimens’ surface uniformity that occurred in the flexural test speci-mens were not present in the tensile ones, which were thinner and, therefore, less influenced by dissimilar con-tractions between the center and surface of the sample. Thus, we can state that these results are related to different mechanical behaviors, with variations in crystallinity in the same sample lot for each step, or even in a single specimen. This statement also applies to the flexural results, and therefore reduces the effects of the problems that occurred with these specimens on the final results. The upward trend of the average results depicted in Fig. 7, however, is obvi-ous and is in agreement with the increased crystalline phase. The explanation for the Elongation at Break is similar to the one pertaining to Fig. 6: there was a reduction in molecular weight and an increase in the crystalline phase.
Figure 4. Hardness of PET samples produced from virgin resin as a function of the number of recycling steps.
Figure 6. Results of maximum strain in flexure of PET samples starting from virgin resin as a function of the number of recycling steps.
Figure 5. Results of flexural modulus of elasticity of PET samples starting from virgin resin as a function of the number of recycling steps.
A comparison of the results presented here with a recent study10 on recycling of post-consumer resin shows only very slight differences in the properties’ behavior through five recycling steps. Therefore, it is not possible to establish any of the proposed correlation for most of the properties studied, except in regard to standard-deviations.
The standard-deviations of samples recycled from vir-gin resin were usually lower than those of samples recycled from throwaways. This was more evident in the results of Elongation at Break in the tensile tests, with injected ground throwaways showing standard-deviations approxi-mately three times higher than the deviation found in the R1 sample.
The uniformity of the virgin material, of a well-known single origin, unlike the possibly diffuse origin of collected bottles, was probably the factor that contributed the most to the improved reproducibility of the results for samples recycled from virgin material.
The above indicates that the procedures for recovery of resin from throwaways -collection, grinding, washing and air-drying-, do not adversely affect the technical quality of recycled throwaways. On the contrary, recycling of resin from throwaways produces materials whose mechanical properties are similar to those produced from recycling virgin resin, where several parameters can be controlled.
The results presented herein lead us to make some comments on the possible applications of recycled PET products. If R2 were a bottle, its volume would probably be smaller than that of the original (R1, assuming that the virgin resin is transformed into a bottle) and would not be applicable in the food industry. The recycled material could, however, be used as plastic wrapping material or sheets for later thermoforming. The R3 product probably does not have sufficient molecular weight for blow-mol-ding, but is probably suitable for the manufacture of weav-ing fibers (for carpets, clothes, etc.) or other applications
(brooms, geotextiles, etc). The R4 product presents a high degree of degradation and its molecular weight is probably suitable for use as fiber-fill material (pillows, shoulder-pads, sleeping-bags, etc.). The R5 product is the most suitable for chemical recycling for the recovery of initial materials, monomers or useful intermediary products such polyglycols.
4. Conclusions
The successive recycling steps caused cumulative de-gradation of the polymer’s macromolecular structure. The number of carboxylic end groups increased from 50 eq/ton to 148 eq/ton of polymer from the virgin resin to the material injected five times, indicating broken chains and a reduction of the structure’s molecular weight. The pre-sence of small chains mixed with large ones resulted in a better fit, which increased crystallinity, as shown by the density and DSC values. Cooling of the test specimens differed according to their distance from the cold mold, causing the appearance of transparent and opaque regions that became clearly visible when the material was ground into flakes.
The crystallinity of the test specimens’ strongly influ-enced the results of the material’s mechanical properties. Crystallinity increased at each successive recycling step, increasing the values of the Modulus of Elasticity in both the flexure and tensile tests and decreasing the values of Maximum Strain in the flexure test and of Elongation at Break in the tensile test.
Comparing these results with a recent study on similar experiments using throwaway resin10, one can conclude that the successive recycling steps beginning with virgin resin provided better reproducibility of the results, proba-bly due to the uniformity of the virgin resin. Other factors such as crystallinity of the initial samples, time elapsed between production and research, or procedures for the recovery of resin from throwaways, did not result in sig-nificant alterations in the behavior of the properties. This is a good argument in favor of disposable plastic bottle recycling, since the material thus obtained is similar to the material obtained from virgin resin.
Acknowledgments
The authors sincerely thank Gustavo Frattini and Max-well Nascimento Bezerra for their help during the various stages of the study. They also thank FAPESP, CAPES, CNPq and FINEP-PROSAB for their financial support, and the Federal University of São Carlos (UFSCar) for the infrastructure made available to them. They are also in-debted to the Department of Medicine and Drugs of the Faculty of Pharmaceutical Sciences of the São Paulo State University (UNESP-Araraquara Campus), where titration procedures were carried out, and to the Institute of Physics
and Chemistry of the University of São Paulo (USP-São Carlos campus), where the DSC tests were performed.
References
1. Ehrig, R.J. Plastics Recycling: Products and Proc-esses, Hanser Publishers, New York, USA, 289 p, 1992.
2. Chivacci, P. PET/PEN, n. 1. p. 22-26, 1994.
3. Polyethylene terephthalate bottles and polyethylene terephthalate g bottles. United States Pharmacopoeia, p. 1784-1787. 1995.
4. Day, M.; Willes, D.M. Photochemical degradation of poly(ethylene terephthalate) II effect of wavelength and environment on the decomposition process, Jour-nal of Applied Polymer Science, v. 16, p. 191-202, 1972.
5. Reich, Leo; Stivala, Salvatore S. Elements of Polymer Degradation, McGraw Hill, New York, 361 p., 1971. 6. Fann, D.M.; Huang, S.K.; Lee, J.Y. Kinetics and thermal crystallinity of recycled PET. II. Topographic study on thermal crystallinity of injection molded recycled PET. Journal of Applied Polymer Science, v. 61, p. 261-271, 1996.
7. Pearce, Eli M.; Bulkin, Bernard J.; NG, Mo Yeen. Fourier transform IR spectroscopy for the study of polymer degradation: thermal and thermooxidative degradation of polyethylene terephthalate. Polymer Characterization, Craver, Clara D., ed, based on the 181st Meeting of the American Chemical Society, held from March 29 to April 3, 1981 in Atlanta, Georgia, USA. American Chemical Society, Wash-ington, p. 571-594, 1983.
8. Klemchuk, P.P. Polymer Stabilization and Degrada-tion. ACS Symposium Seriates, American Chemical Society, Washington, 446 p., 1985.
9. Barnes, Karen et al. Qualitative liquid chroma-tographic-atmospheric-pressure-chemical-ionization
mass spectrometric analysis of polyethylene tere-phthalate oligomers. Journal of Chromatography A, v. 712, p. 191-199, 1995.
10. Mancini, S.D., Bezerra, M.N.; Zanin, M. Reciclagem de PET Advindo de Garrafas de Refrigerante Pós-Consumo. Polímeros: Ciência e Tecnologia, ano VIII, n. 2, ABR/JUN, p.68-75, 1998.
11.American Society of Testing Materials, Standard test method for tensile properties of plastics / D 638-90, Philadelphia, USA, v. 8 (01), p. 157-168, 1991. 12.American Society of Testing Materials, Standard test
methods for flexural properties of non-reinforced and reinforced plastics and electrical insulating materials / D 790-90, Philadelphia, USA, v. 08 (01), p. 272-281, 1991.
13. Pohl, H. A. Analytical Chemistry, v. 26, n. 10, p. 1614-1616, 1954.
14.American Society of Testing Materials, Standard test method for heats of fusion and crystallization of poly-mers by thermal analysis / D 3417-83, Philadelphia, USA, v. 8 (03), p. 88-91, 1991.
15.American Society of Testing Materials, Standard test method for transition temperatures of polymers by thermal analysis / D 3418-82, Philadelphia, USA, v. 08 (03), p. 92-96, 1991
16.Advanced Thermal Analysis Laboratory, Table of properties of lineal macromolecules and small mole-cules, University of Tennessee, Knoxville, USA, p. 15, 1996.
17. Brolly, I.B.; Bower, D.I.; Ward, I.M. Journal of Poly-mer Science, Part B: PolyPoly-mer Physics, v. 34, p. 769-780, 1996.