Experimental study of the inluence of friction
at the supports on longitudinal shear resistance
of composite slabs
Estudo experimental da inluência do atrito nos
apoios na resistência longitudinal ao cisalhamento
das lajes mistas
Abstract
Resumo
The aim of this work is to evaluate the behavior and strength of composite slabs considering the inluence of the friction at the sheeting-concrete interface in the region of the support. Results from tests conducted in the Structural Engineering Department of Federal University of Minas Gerais (UFMG) were used. A Steel Deck 60 system was considered, which consists of a trapezoidal proile with “V” shaped embossments. Delections, end slips and strains of the steel decks were measured, allowing for the analysis of the behavior of the composite slab system and for the deter-mination of its failure mode. The inluence of friction of the region of support in the longitudinal shear resistance was evaluated through the partial shear connection method, which also allowed for establishing criteria and determination of analytical expressions for calculating the ultimate load. Comparative analyses reveal that the inluence of the friction of the region of support in the shear-bond resistance is more signiicant in composite slabs with short shear spans. Design expressions which incorporate friction will also be presented. Their application have demonstrated the ef-iciency of the method for evaluating the longitudinal shear resistance.
Keywords: composite slabs, partial shear connection, friction at the support.
O objetivo deste trabalho é avaliar o comportamento e a resistência de um sistema de lajes mistas de aço e concreto, considerando a inluência do atrito na interface da fôrma de aço com o concreto na região dos apoios. Para isso foram utilizados os resultados de ensaios realizados no Departamento de Engenharia de Estruturas da Universidade Federal de Minas Gerais (UFMG). O sistema misto Steel Deck 60 foi considerado, o qual consiste em um peril trapezoidal com mossas em forma de "V". As lechas, os deslizamentos de extremidades e as deformações das fôrmas de aço foram medidos, permitindo a análise do comportamento do sistema de laje mista e a determinação do seu modo de falha. A inluência do atrito da região dos apoios na resistência longitudinal ao cisalhamento foi avaliada através do método da interação parcial, que também permitiu estabelecer critérios visando à determinação de expressões analíticas para o cálculo da carga última. As análises comparativas revelaram que a inluência do atrito da região dos apoios na resistência ao cisalhamento longitudinal é mais signiicativa em lajes mistas com pequenos vãos de cisalhamento. São apresentadas expressões de cálculo incorporando o atrito, cujas aplicações em um exemplo permitiram mostrar a eiciência do método no cálculo da resistência ao cisalhamento longitudinal.
Palavras-chave: laje mista de aço e concreto, método da interação parcial, atrito nos apoios.
a School of Engineering, Department of Structural Engineering, Federal University of Minas Gerais (UFMG), Belo Horizonte, MG, Brazil; b Federal Center for Technological Education of Minas Gerais (CEFET-MG), Belo Horizonte, MG, Brazil.
Received: 21 Dec 2016 • Accepted: 17 Apr 2017 • Available Online: 04 Oct 2017
R. S. COSTA a
A. C. C. LAVALL a [email protected]
R. G. L. SILVA b
1. Introduction
The use of a system of composite slabs of concrete and steel in metal construction began in the 1930s, according to Veljkovic’[1]. In these systems, the slabs have steel sheeting with very thin thickness, usually between 0.80 mm and 1.25 mm, embedded in the system that work as permanent steel sheeting, supporting the concrete before curing and construction loads. After curing, the concrete and the steel sheeting be-come bonded, forming a single structural composite element. The steel deck works as positive reinforcement for the composite slab.
Currently, composite slab systems have become a widely used method for the construction of slabs in buildings in steel structures. From the structural behavior standpoint, the proiled steel sheeting is capable of transmitting the longitudinal shear at the interface between the steel sheeting and the concrete. Composite behavior between proiled sheeting and concrete is ensured by the mechanical interlock provided by deformations in the proile (indentations or embossments), by the frictional interlock for proiles shaped in a re-entrant form, by the end anchorage provided by welded studs or another type of local
connec-tion between the concrete and the steel sheet, by the end anchorage from the deformation of the ribs at the end of the sheeting and by the friction in the region of the support. If there is no mechanical link or an attachment by friction between the sheeting and concrete, it will not be able to transmit longitudinal shear, and thus, the composite slab action will not be effective.
The main objective of this study is to analyze, after curing the concrete, the inluence of friction of the region of support in the longitudinal shear resistance of the composite slab system Deck-60, using the partial shear connection method.
2. Characteristics of the test specimens
To conduct the analysis using the partial shear connection method and considering the friction at the supports, a series of twelve specimens of simply supported composite slabs were tested in bending. Figure 1 shows a typical cross-section proile of the Deck-60 with the ‘‘V-shape’’ embossments that were pressed onto the webs and its nominal dimen-sions in millimeters.
Figure 1
Cross-section of the steel deck
Table 1
Geometrical characteristics of test specimens
Specimens t
(mm)
b (mm)
L (mm)
ht (mm)
Ls (mm)
01A 0.80 860 2500 110 800
01B 0.80 860 2500 110 800
01C 0.80 860 2500 110 800
02A 0.80 860 2500 140 450
02B 0.80 860 2500 140 450
02C 0.80 860 2500 140 450
03A 0.95 860 2500 110 800
03B 0.95 860 2500 110 800
03C 0.95 860 2500 110 800
04A 0.95 860 2500 140 450
04B 0.95 860 2500 140 450
Table 1 shows the geometrical properties of the specimens that were divided into two groups: six specimens with a nominal thick-ness of the steel proile t equal to 0.80 mm and six with thickthick-ness t of 0.95 mm, with a nominal width of the proile b equal to 860 mm and length L equal to 2500 mm. In each group, three specimens were built with depth ht of 110 mm and a span shear Ls of 800 mm, and the other three were built with depth ht of 140 mm and span shear Ls of 450 mm.
The steel decking with thickness t equal to 0.80 mm was made with ZAR 280 steel with yield strength (fy) equal to 340 MPa and ultimate tensile strength (fu) equal to 450 MPa. The steel decking with thickness equal to 0.95 mm was made with ZAR 345 steel with fy equal to 390 MPa and fuequal to 490 MPa. The modulus of elasticity of structural steel, Ea, was taken equal to 200 GPa, and the 28-day compressive strength of concrete, fck was 20 MPa.
3. Test procedure
Each specimen was subjected to four points bending test, as shown in Figure 2. This system of load application is similar to those in-dicated by Schuster [2], ANSI / ASCE 3 [3], EUROCODE 4 [4], CSSBI S2 [5] and Johnson and Shepherd [6].
Vertical delections at midspan were measured by two displace-ment transducers (DT) with a maximum range of 100 mm, sym-metrically arranged at approximately 20 cm from the edge of the slab. The end-slip between the steel decking and the concrete was recorded through two digital dial gauges (DG) attached at the ends of each specimen, two on each side.
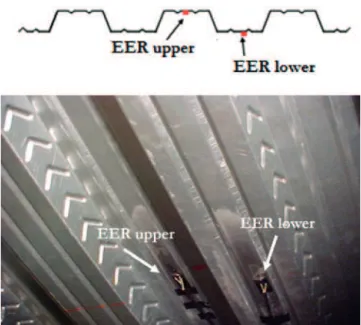
Two electrical resistance strain gauges (EER) were applied to all specimens to measure steel strain. These EER were installed in the midspan, using cyanoacrylate adhesive, one on the lower i-ber and another on the upper ii-ber of the steel decking, as shown in Figure 3.
Loads were monotonically applied in steps of 1.8 kN and strains,
delections and end-slips were measured at each load level. Crack -ing patterns, end-slip and the ultimate load of each specimen were recorded.
3.1 Test results and analysis
The analysis of the test results and a general description of behavior of the composite slabs are studied through load versus end-slip, load versus midspan delection and load versus steel strain relation-ships. The specimen 01A was chosen as representative of all tests, to illustrate the following comments.
Figure 4 shows the load versus end-slip curves of the specimen 01A. Initially the horizontal slip is almost absent, indicating a full shear connection between the sheeting and the concrete. After the irst cracks, the chemical bond between the sheeting and the con -crete is broken, causing end-slip, indicating partial connection.
Figure 2
Typical test set-up
Figure 3
Location of strain gauges (EER) on the steel deck
Figure 4
According to EUROCODE 4 [4], the initial end-slip load (Pdes) is deined as the load that causes an end-slip of 0.5 mm between the sheeting and the concrete. The longitudinal shear behavior is considered ductile if the failure load (Pu) exceeds the initial end-slip load (Pdes) by more than 10%. Table 2 shows end-slip and failure loads for all specimens.
Figure 5 shows the load versus midspan delection curve of the specimen 01A. Two stages in the load-delection behavior were identiied: uncracked and cracked stages.
In the irst stage, no visible cracking was observed anywhere on the specimen, hence, the entire section remained fully compos-ite up to the initial cracks. The cracked stage was identiied by the irst signiicant change in initial stiffness of each specimen that occurred with the appearance of the initial cracks (the load-delection curve ceases to be linearly proportional). Without the presence of shear transfer devices (embossments and friction),
the specimen would not be able to support any additional load beyond this load stage.
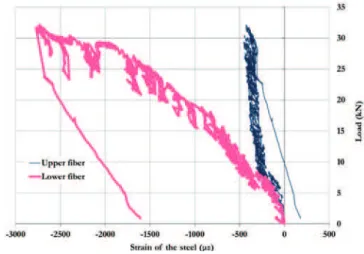
Figure 6 shows the load versus steel strains curve for specimen 01A, where negative values indicate tensile strains. During the uncracked stage, a linearly proportional increase of the tensile strains occurs in the sheeting in both the lower and higher ibers, indicating the exis-tence of a single neutral axis in the concrete. The tensile strains in the top iber of the sheeting decrease after the initial crackings, indicating the presence of two neutral axes in the composite section, indicating partial shear connection between the steel sheeting and the concrete. Based on the experimental results of this investigation, only one mode of failure was experienced by the composite slab system, namely, longitudinal shear. This ultimate limit state is characterized by the shear failure of the connection between the embossments of steel sheeting and the concrete, in the region of the shear span, Ls, where the concrete looses the composite action with the steel ing. This failure is indicated by an end-slip between the steel sheet-ing and the concrete, as shown in Figure 7. This behavior has been observed by Schuster [2], Wright et al. [7], Tenhovuori and Leskela [8], Melo [9], Marimuthu et al. [10], Cifuentes [11] and other authors.
Table 2
End-slip loads and maximum loads of tests
Specimens Pu (N)
Pdes
(N) Pu/Pdes
01A 32170 16200 1.99
01B 33710 16230 2.08
01C 32720 16750 1.95
02A 57170 43950 1.30
02B 56290 34480 1.63
02C 63450 28420 2.23
03A 39621 20490 1.93
03B 39837 21810 1.83
03C 36701 20830 1.76
04A 68443 32060 2.14
04B 71354 30250 2.36
04C 77508 28810 2.69
Figure 5
Load
versus
midspan delection of the specimen 01A
Figure 6
Load
versus
steel strain curves for specimen 01A
Figure 7
4. Partial shear connection method
According to EUROCODE 4 [4], two methods are used in the de-sign of composite slabs: the “m-k” method and the Partial Shear Connection (PSC) method. Both methods are based on experi-mental results with full-scale specimens. Depending on the test results, the behavior of a slab might be classiied as brittle or ductile. The “m-k” method can be used for all proiles, whereas the PSC method can be used only for ductile proiles. In addition, according to Johnson [12], the PSC method evaluates, theoreti-cally, the contribution of the end anchorage and of the friction of support in the longitudinal shear strength.
4.1 Analytical model
The PSC method is based on an analytical model with a physical background, and it basic concepts are illustrated in Figure 8. The model can be better understood by examining the typical module of the composite slab cross section, as shown in Figure 8(a). The normal stress distribution considering the partial interaction has two neutral-plastic axis: one in the concrete (PNAc) and other in the steel sheeting (PNAf), as shown in Figure 8(b). This distri-bution can be decomposed, by simpliication, from the diagrams shown in the Figures 8(c) and 8(d).
Figure 8(a) shows that ht is the overall depth of the slab; e is the distance from the centroidal axis of proiled steel sheeting to bot-tom of the steel deck; dF is the distance from the centroidal axis of the proiled steel sheeting to the top of the composite slab; ep
is the distance from the neutral-plastic axis of the proiled steel sheeting to the bottom of the steel deck; tc is the thickness of the concrete above the lat surface of the top of ribs of the steel sheeting.
As shown in Figure 8(b), fy is the nominal value of the yield strength of the structural steel, where for the nominal thicknesses of 0.80 mm and 0.95 mm, fy equal to 340 MPa and 390 MPa, respectively fcm is the mean value of the compressive strength of the concrete; a is the depth of the concrete block in compres-sion; Nat is the tensile normal force in the steel sheeting; Nc is the compressive normal force in the concrete lange; Nac is the compressive normal force in the steel sheeting. In Figure 8(c), y
is the lever arm in the typical module of the composite slab; Na is
the difference between Nat and Nac corresponding to a portion of the tensile normal force in the steel sheeting.
The bending resistance, MRp, is given by the following equation:
(1)
where Mpr is the reduced plastic resistance moment of the proiledsteel sheeting (see Figure 8(d)), as given by Eq. (2). This reduction is due to the presence of the tensile normal force in the steel sheet-ing, Na equal to Nc.
(2)
where Mpa is the design value of the plastic resistance moment of the effective cross-section of the proiled steel sheeting, and AF,efis the effective cross-sectional area of the proiled steel sheeting. The depth of the concrete block in compression, a, is given by:
(3)
The lever arm, y, may be determined with the following expression:
(4)
4.2 Determination of longitudinal shear resistance
considering the friction at the supports
Studies conducted by Veljcovic’ [13], Tenhovuori[14], Calixto and Lavall [15], Melo [9] and Souza Neto [16] have demonstrated that in models with shear span relatively short, the inluence of the friction at the supports is relevant in the determination of the longitudinal shear resistance, whereas for models with long shear span, that effect is reduced.
The friction force, Ff, is caused by the vertical reaction at the sup-port and appears concentrated at the interface of the steel sheeting with the concrete, as illustrated in Figure 9. This effect may be con-sidered, according to Bode and Minas [17] and other researchers, proportional to the reaction of support, Vut:
(5)
where μ is the friction coeficient.Figure 8
Normal stress distribution for sagging bending, considering the partial interaction
B
B
B
B
4.3 Degree of shear connection
To determine the longitudinal shear strength, the partial interac-tion diagram of each specimen, as illustrated in Figure 10, show-ing relationship between the resistance to bendshow-ing moment and the degree of shear connection of the composite slab, should be
determined using the measured dimensions and strengths of the concrete and the steel sheet.
From the maximum applied loads, the bending moment (Mtest), at the cross-section under the point load, due to the applied load, dead weight of the slab and spreader beams, should be determined and then divided by the bending moment resistance of the slab
consider-Figure 9
Friction force in the region of support at the interface of composite slab
Figure 10
ing the full connection, MR. The path A⇒B⇒C in Figure 10 gives the degree of shear connection, ηtest , given by the ratio between Nc
and Ncf for each specimen, where Ncf is the value of the compres-sive normal force in the concrete with full shear connection. After determining the value of ηtest, the compressive normal force in the concrete, Nc, is given by the following equation:
(6)
On the other hand, the degree of shear connection (η) can be de -termined analytically by equating the Mtest given by Eq. (7), with the nominal moment resistance (MRp) given by Eq. (1). Thus, we obtain the following equation:(7)
(8)
The parameters Nc , y and Mpr are given by the Eq. (6), (4) and (2), respectively. With the aid of Eq. (3) and replacements into Eq. (8), we obtain the following equation:(9)
Developing Eq. (9) in the context of the two equations derived from Eq. (2) and knowing that Ncfequal to Npa [Eq. (10)], we obtain Eq. (11):
(10)
For η ≥ 0.20,(11)
Eq. (11) is a quadratic equation, having the degree of shear con-nection (η) as unknown. This equation can be written as follows:
(12)
where(13)
(14)
(15)
For η < 0.20,(16)
Eq. (16) is also a quadratic equation in η. Thus, Eq. (12) is used again where the constants are:
(17)
(18)
The constant i is calculated by Eq. (13).The positive root of η, smaller than 1.0, which satisies Eq. (12), is the searched value of the degree of shear connection (ηtest). This value should be calculated for each specimen of composite slab. Figure 11 shows the partial interaction diagram and the degree of shear connection (ηtest) for the specimen 01A, using
the analytical expressions.
4.4 Longitudinal shear strength
The value of the longitudinal shear strength of a composite slab, τu, considering the friction of support for each specimen is assumed uniform along the length (Ls+L0), and its value is determined using the width of slab (b), using the following equation:
(19)
where Vut is the support reaction under the ultimate load test, and
L0 is the length of overhang (L0 = 50 mm).
The characteristic value of longitudinal shear strength, τu,Rk, should be calculated as the 5% fractile using an appropriate statistical mod-el, in accordance with EUROCODE 0 [18], Annex D. In this work
t-distribution was adopted:
(20)
where τu,m is the mean value of the longitudinal shear strength of a composite slab determined from testing; t is the reliability coefi -cient of t-distribution; s is the standard deviation of the longitudinal shear strength.In Table 3, the characteristic values of the longitudinal shear strength (τu,Rk) are determined according to Eq. (20).
In this table, the following are shown: the degree of shear connec-tion of each specimen tested (ηtest); the value of the compressive normal force in the concrete (Nc), given by Eq. (6), where the val-ues of Ncf were calculated by the Eq. (10); the friction coeficient μ
Figure 11
equal to 0.50, adopted in accordance with EUROCODE 4 [4]; the support reactions (Vut) obtained in the tests; the longitudi-nal shear strength (τu) for each specimen given by Eq. (19); τu,m for each thickness of the decking and the standard deviation (s). A reliability coeficient of t-distribution t0.95 equal to 2.015 was adopted.
The design value of the longitudinal shear strength of a compos-ite slab, τu,Rd, is given by the following equation:
(21)
where γsl is the partial factor for design shear resistance of a composite slab.
4.5 Partial factor design shear resistance
The EUROCODE 4 [4] recommends that the initial slip load (Vdes) in tests should be greater than 1.2 times the design service load (Vs), as shown in Eq. (22).
(22)
The design service load can be calculated by the following equation:
(23)
where Vl,R is the nominal value of the resistance to shear, and γc is the partial factor for concrete taken as equal to 1.4.Table 3
Determination of the characteristic value of longitudinal shear strength (
τ
u,R
k)
Specimens ηtest
Nc
(N) µ
Vut (N)
τu (MPa)
τu,m
(MPa) s
τu,Rk (MPa)
01A 0.592 183474
0.50
20109 0.2383
0.2407 0.0177 0.2050
01B 0.619 191904 20873 0.2503
01C 0.604 187237 20385 0.2430
02A 0.357 110716 33405 0.2179
02B 0.344 106713 32959 0.2100
02C 0.396 122687 36534 0.2434
03A 0.528 224689 23864 0.2910
0.2696 0.0214 0.2265
03B 0.488 207877 23975 0.2677
03C 0.456 194042 22399 0.2507
04A 0.298 126809 39066 0.2485
04B 0.322 137110 40511 0.2715
04C 0.355 151122 43586 0.3015
Figure 12
sidering inluence of friction at the supports, was equal to 1.60.
4.6 Veriication of the longitudinal shear resistance
The veriication of the longitudinal shear resistance is conducted through the partial interaction diagram, as shown in Figure 12. After the determination of the design value of longitudinal shear strength and the support reaction for each specimen, the force transferred to the concrete, Nc, in any section distant (Lx) from the end can be determined by Eq. (25).
(25)
Substituting the value of Nc in Eqs. (1) to (4) and using design val-ues, determine the design partial interaction diagram, MRd versusLx, where MRd is the design value of the resistance moment of a composite section.
The length Lsf is given by the following equation:
(26)
The veriication procedure is illustrated in Figure 13 for two slabs with different types of loading and spans.For Lx ≥ Lsf, the shear connection is full, so the bending resistance (lexural failure) is critical. If Lx < Lsf, the shear connection is partial, so the longitudinal shear resistance is critical. At any cross-section, the design bending moment MSd should not exceed the design re-sistance MRd.
4.7 Comparative analysis
Figures 14 and 15 show the results of the nominal shear resis-tance obtained in the tests and the characteristic shear resisresis-tance obtained by the PSC method with friction and without friction, as studied by Costa [19].
Analyzing Figures 14 and 15, it can be observed that the results obtained for the resistances by the PSC method, with and without friction, are below the test values. For the thickness of 0.8 mm, in both cases a maximum reduction of 9% occurred in relation to the test results. For the thickness of 0.95 mm, maximum reductions of 5% and 13% occurred, respectively, with and without friction. These results indicate safe values and consistent with the statistical model presented in section 4.4.
It can also be observed that, for short shear spans, the results of the PSC method, which explicitly consider the inluence of friction, pre-sented values of 5.7% and 10.5% higher than the results obtained without friction, for thicknesses of 0.80 mm and 0.95mm, respec-tively, indicating the importance of this inluence. For long shear spans, the results obtained with and without friction were practically the same for both thicknesses, indicating the small inluence of the friction. Therefore, it can be concluded that the inluence of the fric -tion is signiicant for determining the longitudinal shear strength of composite slabs.
5. Example
Using the steel sheeting Deck-60 for a composite slab with width (b) of one meter, it will be determine the characteristic value of the maximum superimposed load that can be applied on the
Figure 13
Veriication procedure
Figure 14
Characteristic shear resistance of specimens of
the groups 01 and 02 (t = 0.80 mm)
Figure 15
composite slab considering the longitudinal shear strength, both with friction and without friction, from Eq. (1). Three distinct cases of loading as shown in Figures 16, 17 and 18, will be analysed:
a) two concentrated loads (Psp) applied in line equidistant from the supports, with the shear span Ls = 450 mm;
b) uniformly distributed load (wsp);
c) one concentrated load (Psp) applied in line in the mid-span. where wsp is the characteristic value of the maximum superimposed distributed load. Psp is the characteristic value of the maximum su-perimposed concentrated load. Vl,R is the characteristic value of the longitudinal shear resistance, and ppslab is the dead load of the composite slab.
The following are the data of the composite slab (see Figures 2 and 8):
n Length of the slab, L = 2500 mm;
n Width of the slab, b = 1000 mm;
n Nominal thickness of the sheet, t =0.80 mm;
n Depth of the sheet, hF = 60 mm;
n Effective area of the sheet, AF,ef = 1060.47 mm2/m;
n Nominal value of the yield strength of structural steel, fy =280 N/mm²;
n Modulus of elasticity of steel, Ea = 200000 N/mm2;
n Overall depth of the slab, ht = 140 mm;
n Distance from the centroidal axis of proiled steel sheeting to
top of composite slab, dF = 110 mm;
n Distance from centroidal axis of proiled steel sheeting to bot -tom of steel deck; e = 30 mm;
n Distance from neutral-plastic axis of the proiled steel sheeting to bottom of steel deck, ep = 30 mm;
n Dead load of composite slab, ppslab = 0.00276 N/mm2;
n Characteristic compressive strength of concrete, fck = 20 N/mm2;
n Modulus of elasticity of concrete, Ec = 21287 N/mm2;
n Characteristic value of longitudinal shear strength of a compos-ite slab, τu,Rk(without friction) = 0.2283 N/mm2, τ
u,Rk (friction) =
0.2050 N/mm2.
Table 4 presents the results of the characteristic maximum su-perimposed loads obtained by PSC method, with friction and without friction.
The case (a) of two applied concentrated loads corresponds to the test conditions of specimen 02A, according to Table 1, whose maximum test load is equal to 32.67 kN for L equal to 1000mm. The result with friction presented in Table 4 for this case is below the test value in 12.5%, indicating the consistency of the method, as shown in Figure 14.
In all cases shown in Table 4 an increase in longitudinal shear resistance was observed when considering the inluence of the
Figure 16
Two concentrated loads
Figure 17
Uniformly distributed load
Figure 18
One concentrated load
Table 4
Results obtained by the PSC method
Load cases Maximum loads
Method Comparison
PSC* PSC**
(PSC** - PSC*) PSC**
(%)
Two concentrated loads Psp (kN) 24.34 28.57 14.80
Distributed load wsp (kN/m2) 25.35 27.19 6.77
One concentrated load Psp (kN) 39.44 41.00 3.80
friction, as expected. It is also veriied that this increase is greater the smaller the shear span (Ls) considered, indicating the consis-tency of the PSC method.
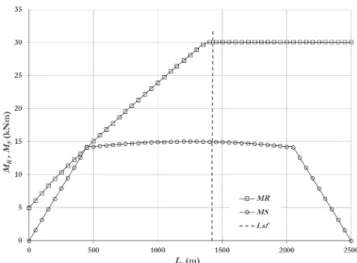
Figure 19 shows the nominal resistance moment curve (MR) ob-tained through the partial interaction diagram according to the proce-dure presented in section 4.6 and the applied nominal bending mo-ment curve (MS) for two concentrated loads. These curves illustrate the procedure for checking the shear strength of a composite slab. In this case the applied bending moment curve, MS, is tangential to the nominal resistance moment curve, MR, indicating a safe so-lution, where MS ≤ MR. The point at which MS and MR are equal correspond to the value of the shear span, Lsf, that is smaller than the length Lsf. The length Lsf deines the value from which the shear
connection is complete and the failure occurs by bending. There-fore, it was concluded that, in this case, the shear connection is partial, indicating that the longitudinal shear resistance is critical.
6. Conclusion
The partial shear connection method (PSC) is an alternative for the “m-k” method for checking the longitudinal shear resistance, allowing the theoretical evaluation of the contribution of the friction of the region at the support and of end anchorage in the longitudinal shear resistance. Tests were conducted at the Structural Engineering Laboratory of Federal University of Minas Gerais (UFMG) on 12 specimens of composite slabs varying shear spans and thickness of decking with embossments in a “V” shape. Delections, end slips and steel strains were measured, allowing the analysis of the behavior of the composite slab system and the determination of its failure mode by shear bond.
These analyses were evaluated through the PSC method, taking into account the inluence of the friction of the region of support in the longitudinal shear resistance, according to EUROCODE4[4]. The EUROCODE 4 [4] recommends a partial factor for design shear resistance (γsl) equal to 1.25 for both methods, “m-k” and PSC. However, it is recommended that for the calculation of the delections, generally no account need be taken of end slip if the initial slip load in tests exceeds 1.2 times the design service load. Therefore, the value of γsl obtained for this composite slab system, considering inluence of friction at the supports, was determined to be equal to 1.60 through the PSC method.
The analysis showed that the PSC method, considering the inlu -ence of the friction in the support, leads to consistent results in re-lation to the tests and in the determination of the longitudinal shear resistance. It was also concluded that the inluence of the friction in the support is signiicant for the determination of the longitudinal shear strength of composite slabs, the smaller the shear span, Ls. The example presented using the expressions and calculations from the PSC method, incorporating the friction demonstrated the eficien-cy of the method in the evaluation of the longitudinal shear resistance.
7. Acknowledgments
The authors are grateful to the CAPES - Coordination for the Im-provement of Higher Education Personnel and CNPq – Brazilian National Council for Scientiic and Technological Development, for their support to carry out this research.
8. References
[1] VELJKOVIC’, M. Behaviour and Resistance of Composite Slabs. Experiments and Finite Element Analysis. Doctoral The-sis - Luleå University of Technology, Tuleå, Swedish, 1996. [2] SCHUSTER R.M. Strength and behaviour of the P-2430 -
12HB, composite slab system (normal weight concrete). De-partment of civil engineering, university of waterloo. Report no. WRI 110-12-02. Canada; 1984.
[3] ANSI/ASCE 3-91. Standard for the structural design of com-posite slabs, American society of civil engineers, 1992. [4] EN 1994-1-1. Design of Composite Steel and Concrete
Structures, Part 1.1, General rules and rules for building, CEN - European Committee for Standardization, 2004. [5] CSSBI S2. Criteria for the testing of composite slabs.
Ca-nadian sheet steel building institute. Willodale, revised. On -tario. Canada, 2008.
[6] JOHNSON R.P. and Shepherd A.J. Resistance to longitudi-nal shear of composite slabs with longitudilongitudi-nal reinforcement. Journal of Constructional Steel Research; 82: 190-194, 2013.
[7] WRIGHT H.D, EVANS H.R, HARDING P.W. The use of pro-iled steel sheeting in loor construction. Journal of Construc -tional Steel Research; 7: 279–95, 1987.
[8] TENHOVUORI A.I and LESKELA M.V. Longitudinal shear resistance of composite slab. Journal of Constructional Steel Research; 46(1–3):228, 1998.
[9] MELO C.B.F. Análise do comportamento e da resistên-cia do sistema de lajes mistas. Dissertação de Mestrado. Programa de pós-graduação em engenharia de estruturas. Universidade Federal de Minas Gerais, Belo Horizonte. Bra-sil; 141p. 1999.
[10] MARIMUTHU V., SEETHARAMAN S., JAYACHANDRAN S.A., CHELLAPPAN A., BANDYOPADHYAY T.K. and
DUT-Figure 19
TA D. Experimental studies on composite deck slabs to de-termine the shear-bond characteristic (m-k) values of the embossed proile sheet. Journal of Constructional Steel Re -search; 63:791-803, 2007.
[11] CIFUENTES H and MEDINA F. Experimental study on shear bond behavior of composite slabs according to Eurocode 4. Journal of Constructional Steel Research; 82: 99-110, 2013. [12] JOHNSON R.P. Composite structures of steel and concrete
- beams, slabs, columns and frames for buildings. Blackwell Scientiic Publications. Vol. 01, 2ª ed. Oxford, 1984.
[13] VELJKOVIC’ M. Development of a New Sheeting Proile for Composite Floor. Experimental Study and Interpretation - Research Report, Division of Steel Structures, Luleå Univer-sity of Technology, Tuleå, Swedish, 1993.
[14] TENHOVUORI A. Parameters and deinitions for classifying the behaviour of composite slabs. Composite Construction in Steel and Concrete III. Proceedings of an engineering foundation conference. ASCE - American Society of Civil Engineers. New York, 1996.
[15] CALIXTO J.M. and Lavall A.C. Behavior and strength of composite slabs with ribbed decking. Journal of Construc-tional Steel Research; 46(1-3):211-2, 1998.
[16] SOUZA NETO A.S. Análise do comportamento e da resistên-cia de um sistema de lajes mistas com ancoragem de ex-tremidade com considerações sobre a fôrma de aço isolada e o atrito nos apoios. Dissertação de Mestrado. Programa de pós-graduação em engenharia de estruturas. Universidade Federal de Minas Gerais. Belo Horizonte. Brasil, 2001. [17] BODE, H. and Minas, F. Composite Slabs with and without
end Anchorage under Static and Dynamic Loading. Com-posite Construction – Conventional and Innovative, IABSE Conference Report, pp. 265-270, 1997.
[18] EN 1990. Basic Structural Design. CEN - European Commit-tee for Standardization, 2002.