*e-mail: [email protected]
1. Introduction
Melting behaviour of the solids is considered to be one of the most important phase transformations in material science and engineering from both scientiic and technological perspective1,2. It has been understood that melting behaviour of any material is strongly dependent on the free surface or interface2-5. In last two decades, there have been tremendous research activities going on the developing of nano-scaled alloys as they exhibit distinctly different properties compared to its constituent elements as well as its counter bulk materials due to its high surface to volume ratio6,7. It has been reported that due to the presence of this high surface to volume ratio in nano-scaled materials, they melt at temperature, which is much lower than that of bulk equilibrium melting temperature2. Therefore, thermal stability of any nano-scaled material is an important issue in the development of nanotechnology. Hence, the effect of size on the melting behaviour of the materials is utmost important and thus, it is essential to understand the mechanisms of melting of these solids.
Several attempts have been made in the last two decades to understand the effect of size on the melting behaviour of nano-scaled metals and alloys8-10. However, these studies are mainly focused on the nano-embedded pure metals and alloys4,11-17. For example, the melting and solidiication behaviour of pure nanometric Bi embedded in Al matrix4,11 or Zn matrix12 and nano-embedded Pb-Sn[10,17] or Pb-In[13] or Pb-Bi[16] alloys in Al matrix have been reported in the literature. It has also been reported that due to the effect of interface between the particle and matrix, the melting
temperature of material can be elevated as compared to the equilibrium bulk melting temperature1-3,14. However, the presence of the matrix limits the study of exact effect of size on melting behaviour of nanoparticle as it is extremely dificult to decouple this in an embedded system. Hence, this is very imperative to study the melting behaviour of free-standing nanoparticles in order to understand the exact effect of size on intrinsic mechanism of melting. Therefore, the investigation on melting behaviour of free standing nano-scaled alloy particles is vital because it will provide an avenue in understanding the exact effect of size on its melting in one way and also help in developing new materials in another way. We have chosen the Bi-Sb system as a model for the study because Bi-Sb alloy exhibit an isomorphous phase diagram with a miscibility gap at low temperature (177 °C) in large composition range of 5 to 95 atom % Sb[18]. However, behaviour of the alloy system depends on the size and thus, it is further necessary to study the alloying at nano-scale.
In the present work, we report some of the salient results on melting behaviour of Bi1-xSbx alloy nanoparticles, prepared with different reaction conditions. Four different compositions of Bi1-xSbx alloys (x=0.12, 0.25, 0.50, and 0.75) have been chosen for synthesis via solvothermal route using sodium borohydride (NaBH4) as a reducing agent. X-ray diffraction (XRD) technique has been utilized to identify the phase purity and structure of the samples. Size, shape and morphology of the samples were extensively analyzed with transmission electron microscope (TEM). The thermal characterizations of the alloys were extensively determined with differential scanning calorimetry (DSC).
Melting Behaviour of Bi
1-xSb
xFree Standing Alloy Nanoparticles Synthesized via
Solvothermal Route
Mayanglambam Manolata Devia, Krishanu Biswasa*
aDepartment of Materials Science and Engineering, Indian Institute of Technology,
Kanpur-208016, India
Received: September 9, 2014; Revised: September 30, 2015
The present investigation aims at understanding the effect of size on melting behaviour of free standing alloy nanoparticles. Alloy nanoparticles of Bi1-xSbx (x=0.12, 0.25, 0.50 and 0.75) have been synthesized by solvothermal route using sodium borohydride (NaBH4) as a reducing agent. The samples were characterized by X-ray diffraction (XRD) and transmission electron microscopy (TEM). The melting behaviour of alloys was determined by differential scanning calorimetry (DSC). The formation of different solid solution phases of Bi-Sb alloy has been conirmed by detailed XRD studies. Uniform cuboctahedral as well as spherical morphology of alloy nanoparticles has been observed in TEM with average particle size of 40±9 nm in Bi0.75Sb0.25 specimen. DSC studies indicate the depression in the melting temperature of the nanoparticles as compared to the bulk alloy of same composition.
2. Experimental Procedure
2.1. Materials
Bismuth chloride (BiCl3) (99.9%, Sigma Aldrich) and Antimony chloride (SbCl3) (99.9%, Sigma Aldrich) were taken as precursors for Bi and Sb respectively. N, N-dimethyformamide (DMF) (99.9%, Alfa Aesar), sodium borohydride (NaBH4) (99.9%, Alfa Aesar) and NaOH has been utilized in the reaction as solvent, reducing agent and pH controller respectively. Distilled water and methanol were used as washing agents. All the chemicals are of analytical grade and were used as received without any further puriication.
2.2. Preparation of Bi
1-xSb
xalloy nanoparticles by
solvothermal route
Four different compositions of Bi1-xSbx alloy (with x=0.12, 0.25, 0.50, and 0.75) have been synthesized by solvothermal route. In a typical experiment, 2 mmol of precursor (BiCl3 and SbCl3) and 0.72g of NaOH were dissolved in 80 mL of DMF in a beaker and subsequently the transparent solution was transferred into a Telon-lined container of 100 mL capacity. After that, molar ratio (MR) of precursor/ NaBH4 as 1:0.5 was added in the solution and immediately the colour of the solution turned black. Then, this reactant illed Telon container was inserted in a stainless steel autoclave which was then heated at 140 °C for 12h inside an oven.
After being cooled down to room temperature naturally, the black coloured products were collected by centrifugation and washing with water and methanol subsequently for several times to remove unreacted chemicals. Finally, the products were air-dried at room temperature and collected for further characterizations.
3. Characterizations
X-ray diffraction (XRD) pattern of all the solvothermally synthesized samples were recorded using Brukers D8 focus X-ray diffractometer with Cu kα radiation (λ=0.15405nm), employing a scan rate of 1º/min in angular range of 20º- 80º to identify the phases and structure. The size, shape and morphology of as-synthesized powder products were investigated by transmission electron microscope (TEM, FEI Tecnai G2 UT 20 operated at 200kV). The melting behaviour of all the samples were investigated using differential scanning calorimeter (DSC, Mettler Toledo TGA/DSC, STARe System), employing heating and cooling rate of 20 °C/min with Ar low of 100 mL/min.
4. Results
4.1. Phase and structural identiication
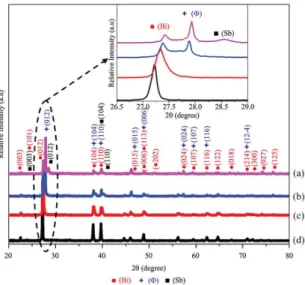
The X-ray diffraction (XRD) patterns obtained from the solvothermally synthesized powder products corresponding to four different alloy compositions, Bi1-xSbx, (x=0.12, 0.25, 0.50, and 0.75), synthesized at 140 °C for 12h using molar ratio (MR) of precursor/NaBH4 as 1:0.5 are shown in Figures 1a-d. All the diffraction peaks of Bi1-xSbx, (x=0.12, and 0.25), shown in Figure 1a and 1b were indexed to rhombohedral symmetry (space group=R3m) of Bi-Sb system (designated as (Bi)), which was conirmed by comparing the shift of all the diffraction peak positions as compared to pure Bi (a=0.45475 nm, c=1.18681 nm and, α=90°) (Pearson’s
database, 1210759) as well as from pure Sb (a=0.4309 nm, c=1.1286 nm and, α=90°) (Pearson’s database, 1923886). On the other hand, the diffraction peaks of Bi0.50Sb0.50 (shown in Figure 1c) can be indexed due to (Bi) and (ɸ) whereas that of Bi0.25Sb0.75 (shown in Figure 1d) can be indexed due to (Bi), (ɸ) and (Sb). The different phase of Bi-Sb solid solutions have been designated as (Bi) and (ɸ) corresponding to peak positions, which are the least and the most shifted respectively to higher angle as compared to pure Bi. On the other hand, (Sb) is designated for the peak positions, which are much closed to pure Sb. The inset of Figure 1 shows the enlarged view of (012) diffraction peak of the alloy for more clarity. The diffraction peaks are observed to be broad and shifted to higher 2θ as Sb concentration in the alloy increases, indicating distinct change in lattice parameter of different phases of alloy with different amount of Sb.
4.2. Microstructural observations
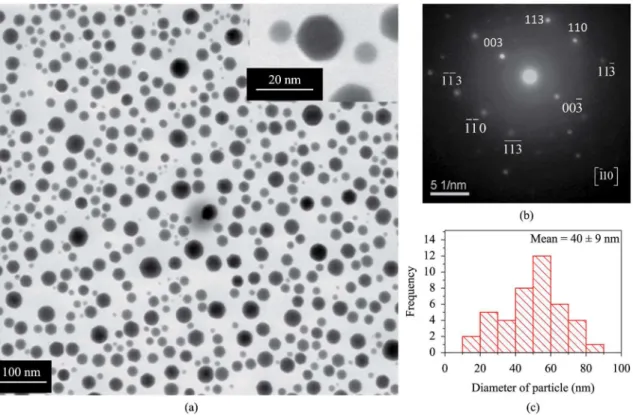
The detailed examinations of size, shape and morphology of different specimens, synthesized in the present investigation have been carried out using transmission electron microscope (TEM). Figure 2a, 2b and 2c reveals bright ield TEM micrograph, corresponding selected area electron diffraction (SAED) pattern captured from one such nanoparticle and histogram showing particle size distribution of Bi0.75Sb0.25 alloy nanoparticles respectively. Figure 2a reveals well-dispersed and free standing alloy nanoparticles with cuboctahedral morphology (see inset of Figure 2a). The SAED pattern also conirms the formation of (Bi) (a=0.4526171, c=1.1820370 and α=90º). The size distribution of these nanoparticles has been determined from large number of nanoparticles and the average particle sizes are estimated to be 40 ± 9 nm.
4.3. Differential scanning calorimetric (DSC)
investigation
Detailed thermal characterization of all the alloy nanoparticles using DSC has been carried out. Figure 3a-d shows the DSC thermograms of alloy nanoparticles having
four different compositions (x=0.12, 0.25, 0.50, and 0.75), prepared solvothermally at 140 °C, for 12h with MR of precursor/NaBH4 as 1:0.5. DSC results of these nanoparticles are listed also in Table 1. The solidus and liquidus temperature of Bi-Sb alloy obtained from equilibrium phase diagram18 are also shown for comparison. One can ind two different
types of thermal behaviour among four alloys. For x=0.12 and 0.25, single melting event is discerned (Figure 3a and 3b). However, the peak temperatures for these melting events vary depending on x, as indicated in Table 1. On the other hand, Figure 3c and 3d show the presence of two melting events for x=0.50 and 0.75. The irst melting event in each alloy is
Figure 2. Bright ield TEM images of Bi0.75Sb0.25 alloy, prepared 140 °C for 12h using different MR of precursor/NaBH4 as (a) 1:0.5, (b) corresponding selected area diffraction pattern and (c) histogram showing particle size distribution.
observed to be sharp and symmetrical. However, the later melting events of x=0.50 and 0.75, which are occurring at higher temperature, are found to have shoulder on left side of the peak and need to be de-convoluted to obtain the peak temperatures corresponding to individual events. The detailed results of these de-convoluted proiles (insets of Figure 3) are also listed in Table 1.
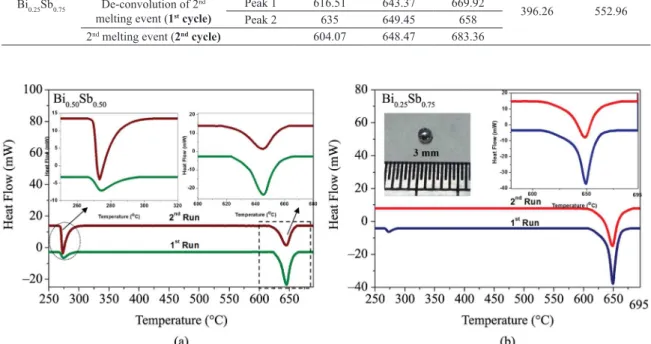
In order to decipher the origin of the melting peaks in Figure 3c and 3d, cyclic DSC has been carried out so that the effect of metastability of phases or particle size can clearly be understood. Figure 4a and 4b show the DSC traces for two cycles (1st and 2nd run). One can clearly observe two different types of behaviour. For x=0.75, the irst melting peak (as observed in the 1st cycle) vanishes and the second melting peak becomes symmetrical without any shoulder.
No signiicant change in the peak of the second melting is observed in subsequent cycles. On the other hand, cyclic DSC of the nanoalloy with x=0.50 reveals distinctly different behaviour as shown in Figure 4a. The irst melting peak becomes more intense and sharp whereas the second peak is observed to be less intense but symmetrical in comparison to the 1st cycle. The detailed origin of these melting events will be discussed in the subsequent section.
5. Discussion
The detailed DSC analysis of all the compositions of alloys prepared by solvothermal route using MR of precursor/NaBH4 as 1:0.5 reveal the presence of one (x=0.12 and 0.25) or two (x=0.50 and 0.75) melting events depending on their
Table 1. Comparison of DSC Data for different alloy compositions of Bi1-xSbx alloys (x=0.12, 0.25, 0.50, and 0.75), prepared by solvothermal route at 140 °C for 12h using MR of precursor/NaBH4 as 1:0.5 with melting of corresponding bulk alloys of similar composition from equilibrium phase diagram.
Alloy Compositions
Heating Cycle
Alloy Nanoparticles Bulk alloys
Onset Temp
(°C)
Peak Temp. (°C)
End set Temp. (°C)
Solidus Temp
(°C)
Liquidus Temp
(°C)
Bi0.88Sb0.12 264.97 275.17 295.63 280.12 326.21
Bi0.75Sb0.25 265.31 279.26 312.26 291.69 381.50
Bi0.50Sb0.50
1st melting event
(1st cycle) 266.06 274.84 297.09
326.67 473.49
1st melting event
(2nd cycle) 266.64 273.36 306.69
De-convolution of 2nd melting event (1st cycle )
Peak 1 614.35 640.93 665.38
Peak 2 623.65 646.19 672
2nd melting event (2ndcycle) 616.81 644.62 662.80
Bi0.25Sb0.75
1st melting event (1st cycle) 266.94 273.14 290.84
396.26 552.96
De-convolution of 2nd melting event (1st cycle)
Peak 1 616.51 643.37 669.92
Peak 2 635 649.45 658
2nd melting event (2nd cycle) 604.07 648.47 683.36
Figure 4. Comparison of 1st and 2nd heating cycle of (a) Bi
compositions, suggesting the presence of one or more phases in the samples (see Figure 3). It is to be noted that the melting temperature of pure Bi and Sb are 271.5 and 630.63 °C respectively. Therefore, the appearance of one melting event in the heating cycle of x=0.12 and 0.25 as shown in Figure 3a and 3b, can be attributed to the melting of the phase corresponding to (Bi). It can also clearly be observed that the melting temperature of this phase is found to have depression of 15.15 °C as compared to that of the corresponding bulk data (see Table 1). For x=0.25, a depression of 26.4 °C has been observed. This depression in melting temperature is mainly due to nano-scale sized free standing particles, which is consistent with the reported literature2. Similar observations of melting of (Bi) in other alloy compositions (x=0.50 and 0.75) have also been found. In addition, one can clearly be observed that the melting temperature of (Bi) in all the alloy compositions increases as the Sb content increases. This may be because of the obvious fact that there exist different amount of Sb in the alloy composition. On the other hand, the melting corresponding to alloys x=0.50 and 0.75 are complex and need further exploration. For x=0.75, cyclic DSC experiments clearly suggest the formation of metastable (Bi) (irst peak in 1st run), which vanishes and subsequently dissolves into equilibrium (Sb) solid solution phase. The peak corresponding to melting of (Sb) becomes broad with a weak shoulder, indicating the pre-melting of (Sb) phase. The pre-melting event can be anticipated to be dissolution of Bi-rich phase. On the other hand, the alloy with x=0.50 reveals the presence of two melting events even after cyclic DSC, indicating retainment of (Bi) and (Sb) phases in the nanoparticles. However, it is not possible to conclude the detailed mechanism of melting from the DSC results. This aspect is under investigation and will be reported later.
It has been well known that the size dependent depression of the melting temperature of free-standing alloy nanoparticles can be well interpreted with the classical approached by Gibbs-Thomson equation19. The following expression represents melting point depression:
(B) ( ) (B)
( )N (N)
= −
s m
m N m l
s m
2T
T T
r L
γ
ρ (1)
where Tm(N) and Tm(B) are the melting temperature of nanoparticle and bulk respectively, r(N) the radius of nanoparticle, ρs the density of bulk, Lm(N) the latent heat of nanoalloy and γsl is the surface energy of nanoparticles. Thus, it allows us to estimate γsl using the melting points of depression via;
( ) (B)
(N) (N)
(B) (B)
) )
2
= − = ∆
sl m N m s
m m
m(N s m(N
T T
r r
2
T L
T T L
γ ρ ρ (2)
It is to be noted that Tm(N) of different alloys (x=0.12 and 0.25) are obtained from DSC data, whereas Tm(B) of similar compositions were obtained from equilibrium phase diagram18. The r(N), ρ
s and Lm(N) were calculated
or measured from XRD, Archimedes method20 and DSC thermograms respectively. The detailed values are listed in Table 2. Table 2 also shows γsl values for bulk Bi and Sb[21]. To the best of the authors’ knowledge, the γ
sl values
for nano-sized Bi and Sb are not reported in the literature. The calculated γsl values for Bi-Sb alloys nanoparticles are observed to be lower than those corresponding to bulk Bi and Sb. Therefore, the chemistry and size play a signiicant role in determining the γsl values of Bi-Sb alloy nanoparticles.
6. Conclusion
The present investigation has clearly shown that free standing Bi-Sb alloy nanoparticles can be successfully synthesized by solvothermal route. The experimental indings can be summarized as follows:
• The detailed analysis of XRD patterns indicates that single alloy phase, (Bi), is present in alloy composition with Sb < 50 atom %. On the other hand, (Sb) and (ɸ) along with (Bi) have been observed when Sb concentration in the alloy is ≥ 50 atom %.
• The extensive TEM observation shows that the alloy nanoparticles have cuboctahedral as well as spherical shape with the particle size of 40 ± 9 nm of Bi0.75Sb0.25 alloy.
• The careful and extensive DSC analysis of different compositions of Bi-Sb alloy nanoparticles prepared with MR of precursor/NaBH4 as 1:0.5 reveals the single melting event of (Bi) when the composition of alloy is < 50% of Sb content whereas the multiple melting events have been observed in the alloy samples when the Sb content is ≥ 50%.
• Cyclic DSC events indicated different behaviour for alloys with x=0.50 and 0.75.
• Solid-liquid interfacial energies have been calculated for Bi-Sb nanoalloys with x=0.12 and 0.25 and the values are found to be lowered as compared to bulk Bi and Sb
Acknowledgements
We would like to acknowledge the XRD and Electron Microscopy facilities at IIT Kanpur.
Table 2. The detailed of interfacial energies of Bi-Sb alloy nanoparticles.
Alloy
Compo-sition
Radius of nanoparticle
(r(N))(nm)
Density (ρs) (g/cm3)
Latent heat Lm(N) (mJ/g)
Melting temp. of nanoparticle
Tm(N) (°C)
Melting temp. of Bulk
Tm(B) (°C)
Interfacial Energy γsl (mJ/m2)
Ref.
Bi0.88Sb0.12 22.3 9.61 4028.97 264.97 280.12 23.34 Present
study
Bi0.75Sb0.25 20.5 9.18 5734.93 265.31 291.69 48.82 Present
study
Pure Bi Bulk 10.05 10.55 × 10⁶ - 271.4 95 Jones21
References
1. Mei QS and Lu K. Melting and superheating of crystalline solids: from bulk to nanocrystals. Progress in Materials Science. 2007; 52(8):1175-1262. http://dx.doi.org/10.1016/j. pmatsci.2007.01.001.
2. Lu K and Jin ZH. Melting and superheating of low-dimensional materials. Current Opinion in Solid State and Materials Science. 2001; 5(1):39-44. http://dx.doi.org/10.1016/S1359-0286(00)00027-9.
3. Chattopadhyay K and Goswami R. Melting and superheating of metals and alloys. Progress in Materials Science. 1991; 1991(42):287-300.
4. Goswami R and Chattopadhyay K. Depression of melting point of multidomained Bismuth in Aluminum based metallic glass nanocomposites. Applied Physics Letters. 1996; 69(7):910-912. http://dx.doi.org/10.1063/1.116940.
5. Singh A and Tsai AP. Melting behaviour of lead and bismuth nano-particles in quasicrystalline matrix: the role of interfaces.
Sadhana. 2003; 28(1-2):63-80. http://dx.doi.org/10.1007/ BF02717126.
6. Rao CNR, Matte HSSR, Voggu R and Govindaraj A. Recent
progress in the synthesis of inorganic nanoparticles. Dalton Transactions. 2012; 41(17):5089-5120. http://dx.doi.org/10.1039/ c2dt12266a. PMid:22430878.
7. Ferrando R, Jellinek J and Johnston RL. Nanoalloys: from theory to applications of alloy clusters and nanoparticles. Chemical Reviews. 2008; 108(3):845-910. http://dx.doi.org/10.1021/ cr040090g. PMid:18335972.
8. Dick K, Dhanasekaran T, Zhang Z and Meisel D. Size-dependent melting of silica-encapsulated gold nanoparticles. Journal of the American Chemical Society. 2002; 124(10):2312-2317. http://dx.doi.org/10.1021/ja017281a. PMid:11878986.
9. Sheng HW, Lu K and Ma E. Melting and freezing behavior of embedded nanoparticles in ball-milled Al±10 WT% M (M = In, Sn, Bi, Cd, Pb) mixtures. Acta Materiallurgica. 1998; 46(14):5195-5205. http://dx.doi.org/10.1016/S1359-6454(98)00108-6.
10. Khan PY, Bhattacharya V, Biswas K and Chattopadhyay K.
Melting and solidification behavior of Pb-Sn embedded alloy
nano-particles. Journal of Nanoparticle Research. 2013; 15(11):2049. http://dx.doi.org/10.1007/s11051-013-2049-8.
11. Goswami R and Chattopadhyay K. The solidification behaviour of bi particles embedded in an Al matrix. Acta Materialia. 1996; 44(6):2421-2429. http://dx.doi.org/10.1016/1359-6454(95)00332-0.
12. Goswami R and Chattopadhyay K. Melting of Bi nanoparticles embedded in a Zn matrix. Acta Materialia. 2004; 52(19):5503-5510. http://dx.doi.org/10.1016/j.actamat.2004.08.010.
13. Bhattacharya P and Chattopadhyay K. Phase formation and transformation of embedded alloy nanoparticles: case of lead indium alloy particles in aluminum. International Journal of Nanoscience. 2005; 4(5-6):909-920. http://dx.doi.org/10.1142/ S0219581X05003875.
14. Sun NX, Lu H and Zhou YC. Explanation of the melting behaviour of embedded particles: equilibrium melting point elevation and superheating. Philosophical Magazine Letters. 1997; 76(2):105-110. http://dx.doi.org/10.1080/095008397179282.
15. Goswami R, Chattopadhyay K and Ryder PL. Melting of Pb particles embedded in Cu-Zn matrices. Acta Materialia. 1998; 46(12):4257-4271. http://dx.doi.org/10.1016/S1359-6454(98)00094-9.
16. Yousaf PK and Krishanu B. Melting and solidification behaviour of Bi-Pb multiphase alloy nanoparticles embedded in Aluminum matrix. Journal of Nanoscience and Nanotechnology. 2014; 14:1-8. PMid:24730249.
17. Khan PY and Biswas K. The effect of matrix on melting and solidification behaviours of embedded Pb-Sn alloy nanoparticles.
Philosophical Magazine Letters. 2014; 94(18):2031-2045. http://dx.doi.org/10.1080/14786435.2014.904966.
18. Massalski TB. Binary alloy phase diagram. 2nd ed. Materials Park: ASM International; 1992.
19. Sun J and Simon SL. The melting behavior of aluminum nanoparticles. Thermochimica Acta. 2007; 463(1-2):32-40. http://dx.doi.org/10.1016/j.tca.2007.07.007.
20. Makkonen L. On the methods to determine surface energies.
Langmuir. 2000; 16(20):7669-7672. http://dx.doi.org/10.1021/ la990815p.