Abstract— Modal multiplexing (MDM) is a core technology to
allow a capacity increase in modern optical systems. However, in MDM links, the amplified WDM signal suffers not only from lack of spectral gain equalization but also from unequal modal gain. The proper design of the MDM-EDFA is crucial to provide modal gain equalization and to overcome those impairments, thereby ensuring long haul transmission. In this paper, our methodology of project EDFA design for MDM-WDM systems is presented. The technique is based on a figure of merit arising from the rate and propagation equations which describe the EDFA behavior. This figure of merit is then used for the definition of the objective functions employed in the optimization step, which is based on the non-dominated sorting genetic algorithm NSGA-II. Finally, the method is applied to demonstrate gain equalization through the simulation of a WDM optical system composed of two group modes (LP01,s and LP11,s)
with up to 16 channels in each mode. It is demonstrated that, for a MDM-WDM system with optimized EDFAs, the differential spectral gain is the main cause of non-equalization of the amplified signal.
Index Terms— Erbium doped fiber amplifier, few-mode fiber amplifiers,
genetic algorithm, spatial division multiplexing. I. INTRODUCTION
There has been an increase on the demand of transmission rate in optical networks, due to novel
applications, such as high definition video services (e.g. NetFlix) and data center storage (e.g.
DropBox and Google Drive). In order to respond to this need, coherent transmission techniques,
associated to digital signal processing algorithms, have been developed [1]. As a consequence, the
limit of the capacity of the optical channel based on single-mode fiber (~100 Tbits/s [2]) has already
been reached [3-4].
Further progress is possible only if an additional degree of freedom for optical transmission can be
exploit. That is why recent research has focused on the development of technologies for coherent
optical systems based on Spatial-Division Multiplexing (SDM). In those SDM systems there are two
EDFA Design and Analysis for WDM Optical
Systems Based on Modal Multiplexing
Adolfo Fernandes Herbster, Department of Electrical Engineering
Federal University of Campina Grande, Campina Grande, PB, Brazil [email protected]
Murilo Araújo Romero
Department of Electrical and Computer Engineering University of São Paulo, São Carlos, SP, Brazil
basic multiplexing forms (which can also be combined together): (a) through spatially separate cores
in a multi-core fiber (MC); and (b) through orthogonal modes in a few-mode fiber (FM). In both
cases, for long haul WDM transmission, optical amplification remains an essential part of the optical
system.
Specifically, in the particular case of few-mode (FM) systems, for an efficient WDM amplification,
the EDFA must present high modal gain and low differential modal gain (DMG), as well as the usual
requirement of equalized spectral gain (DSG) across the C-band. Because of its complexity, the
design of FM-EDFAs than single-mode amplifiers and the design of FM-EDFAs for WDM signals
has recently received major attention [5-6].
The first methodology specifically focused on the FM-EDFA design for WDM systems is described
in [7]. An annular doping profile with uniform fiber refractive index profile (FRIP) is proposed in this
paper, allowing satisfactory gain equalization between thegroup modesLP01,s and LP11,s for six WDM
channels, namely a DMG value of ~2 dB associated to gains values higher than 20 dB. The pump
signal was composed only by the LP01,p mode.
Alternatively, Kang et al proposed an annular doping profile with uniform FRIP and non-centered
cladding pump for the equalization of 15 channels multiplexed in four group modes (LP01,s , LP11,s ,
LP21,s and LP02,s) [8]. An optimization procedure concerning the doping profile, based on genetic
algorithms, is adopted. The average mode gain is higher than 20 dB, with DMG lower than 1 dB.
However, the pump signal intensity is too high (2.5 W).
Next, in [9], the amplifier is designed to amplify a WDM signal with four channels in four modes.
The maximum gain difference between two distinct wavelengths is lower than 3.2 dB with an average
gain of about 21 dB. The geometry of the doped fiber is defined by 19 microstructure cells and the
doping profile is optimized through the gradient descent optimization algorithm (GDOA).
Although it presents good results, the optimization method used in [8] and [9] require a fairly
time-consuming numerical solution for the rate and propagation equations describing the behavior of the
FM-EDFA. For WDM signals, the optimization procedure significant computational effort, since the
necessary processing is much higher than that in the single channel case. As a consequence, it is usual
that the investigations reported in the literature focus on a limited search space and/or rely on the
predefinition of the pump mode, specified at the beginning of the algorithm.
A new methodology for an FM-EDFA project for WDM signal is proposed in this paper. The
approach is based on a technique presented by us in reference [15], originally for the design of
single-channel FM-EDFAs. Specifically, in our methodology, the rate and propagation equations are used
only as a starting point, to derive a simplified figure of merit, which relates the output characteristics
of the FM-EDF to the set of modes composing the input and pump signals. By using this figure of
merit, computational effort is greatly reduced, allowing a generalized optimization process to be
carried out by means of the non-dominated sorting genetic algorithm II (NSGA-II) [10].
of a signal composed of up to 16 channels per mode. The outline of the paper is given as follows. The
parameters which are used to evaluate the amplifier performance, such as DMG and DSG, are defined
in section II. Next, the figure of merit for WDM signals is determined in section III. This parameter is
used in the optimization stage, described in the same section. The FM-EDFA design for WDM signals
is carried out in section IV. The performance of the designed amplifier is analyzed in the stand-alone
form, as well as inserted into the WDM system.
II. PERFORMANCEPARAMETERS
The four basic parameters for the evaluation of an FM-EDFA performance are gain, noise figure,
gain efficiency and differential spectral gain (DSG). In conventional WDM systems, the gain
differencebetween two channels is calculated as
G
G max ) (
DSG dB i dB j
j i
m
,
(1)
where GdB(i) represents the gain (in dB) in the i wavelength.
For the FM-EDFA, three new performance parameters are required, namely, the differential modal
gain (DMG), gain excursion (∆G) and differential modal noise figure (DMNF). In this paper, the parameter related to the noise figure will not be addressed. On the other hand, DMG is defined as the
differential gain between two points of the spectrum of the amplified optical modes, as [11]
,
G
, Gmax ) (
DMG dB m dB n
n m
,
(2)
where m and n represent two allowed signal modes of the FM-EDFA.
For long range systems, the differential gain (DSG and DMG) must be kept the minimum possible.
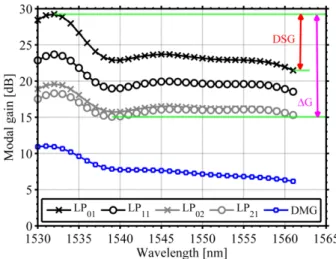
Fig. 1 illustrates the typical optical gain of a FM-EDFA, taking into account an optical input signal
composed of four modes (LP01, LP02, LP11 and LP21) and 32 equally spaced channels between 1530
and 1561 nm. Ideally, both the DSG and the DMG parameters must be zero along the optical band of
interest. However, in the example, the value of DSG reaches 7.8 dB (for LP01 mode) while the DMG
can be as high as 11.02 dB (at 1531 nm).
Finally, the ∆G parameter represents the maximum differential gain between two different wavelengths, regardless of the spatial mode, and mathematically defined as [11]:
,
G
, Gmax
G dB i dB j
n
m m n
j i
.
(3)
Accordingly to Fig. 1, the channel 1539 nm of the mode LP21 (15.06 dB) exhibits the minimum
gain, while the maximum gain is obtained by channel 1532 nm of the LP01 mode (29.04 dB).
Therefore, ∆G is about 14 dB. It is important to note that both the DMG and the DSG parameters contribute to raise the value of ∆G.
III. OPTIMIZATIONFORMALISMANDMETHODOLOGY
In this paper, the FM-EDFA is considered a two-level system. The FM-EDF is also taken as weakly
guided and the propagating modes are described as linearly polarized (LP) [12]. The fiber is
considered perfectly symmetrical and coupling effects between spatial modes are disregarded. Optical
losses can be also neglected due to the small length of the doped fiber and the pump signal is
considered as monochromatic. Our approach is to provide a simplified figure of merit to allow an
exhaustive and comprehensive search on the all possible doping profile geometries. With this goal in
mind, the figure of merit is derived accounting for the generation of the amplified spontaneous
emission (ASE) [13], which is disregarded in a preliminary evaluation of the FM-EDFA performance.
However, after the figure of merit is used to select the most promising doping profiles, further
analysis and final performance assessment do include the ASE effects.
The derivation of our figure of merit starts by the rate equations, defined in [14] for the two-level
system. As a result of above simplifications, those equations are rewritten as:
p p p a q N i i s i s i s a i s e i s N i i s i s i s e i s P P h P h N z N s s
1 , , , , , 1 , , , , 0 1 , , ,, (4)
p p p a q N i i s i s i s a i s e i s N i p p p a q i s i s i s e i s P P h P P N z N s s
1 , , , , , 1 , , , , 0 2 , , ,. (5)
The variables N1(ρ, ϕ, z) [m3] and N2(ρ, ϕ, z) [m3] represent the ion density in the fundamental and
metastable levels, respectively, while N0(ρ, ϕ) [m3] is the distribution of the ion density of the
FM-EDF (doping profile). Subindex p and s represent variables related to pump and input signals,
respectively. The absorption and emission cross section are defined by a [m2] and e [m2],
respectively, [s] represents the lifetime of the erbium ions of the metastable state, h [J.s] represents
Planck’s constant and t represents the frequency of the optical component t. The variable Pt(z) [W]
represents the signal intensity t at position z [m] of FM-EDF and variable t(ρ, ϕ) [m 2
normalized modal-intensity distribution. The maximum number of components i of the input signal is
defined by Ns.
In order to complete the model for the FM-EDFA, while simultaneously taking into account the
simplifications proposed in this section, the input signal propagating equations defined in [14] are
rewritten as
2 1 2 0 0 , 0 , , 2 0 0 , 0 , , , d d , , , , , d d , , , , d d
a p i s p a p e i s p i s a i s a i s i s i s z N P P z N h P z P , (6) where
, ,
. 1 , , , , ,
s N x p p p a p x s x s x s e x s a x s P P h z (7)The first portion at the RHS of Eq. 6, called η1, contributes to the power decrease of ith input signal,
due to the absorption of the optical signal. Meanwhile, the second portion at the RHS of Eq. 6, called
η2, contributes to the power of ith input signal. The increase of the optical power is proportional to both the intensities of the input (Ps,i) and pump (Pp) signals, as well as to the integrals themselves.
When the signal can be considered as a single wavelength channel and the optical amplifier operates
in the unsaturated regime, component η1 is neglected and the simplified equation describing the
propagation of the signal is simply defined by η2.
In this condition, a useful figure of merit concerning the amplifier gain was previously defined by
us as [15]
, , , d d .2 0 0 , 0 ,
a p i s p is N (8)
A. Figure of merit for WDM signals
In the case of WDM signals, the set of propagation equations, defined by Eqs. 6 and 7, also includes
the added term:
d d ., , , , , 1 2 0 0 , 0 , , , , , , ,
3
s N x a p i s x s a i s e x s e i s a x s i s x s z N P P (9)
This new term added to Eq. 6 corresponds to the process of stimulated emission, rising from the
absorption of the input signal. This component is zero when the wavelength of component i is close to
the wavelength of component x
sa,xse,ise,xsa,i 0
.The value of η3 is proportional to the product of optical intensities for the components of the input
signal (Ps,x Ps,i). Therefore, at the fiber input, the magnitude of η3 is negligible when compared to η2.
However, in the saturation regime of the FM-EDF, when the amplitude of input signal amplitude is
high, component η3 must be taken into account. On the other hand, similarly to the single channel
Also, as explained before, the proper design of FM-EDFAs aims at equalized modal gain. In order
to assure that the values of modal gains are similar, a sufficient condition is that dPs,i/dz = dPs,i/dz,
with i j. In this case, when considering the optical intensities concerning the signal components of
the input signal to be similar, it is necessary that
d d ., ,
, ,
, d
d ,
,
, ,
, 2
0 0
, 0
, 2
0 0
, 0
,
a
p j
s e
j s a
p i
s e
i s
z N
z N
(10)
The previous expression can be explored by highlighting three particular cases. The first case
consists of an input signal with only one spatial mode, such as the LP01,s mode, and different channels,
for example, 1530 and 1550 nm. In this case, the integral η2 is nearly identical for all the signal
components, because the distribution of normalized intensity for all the channels in the same spatial
mode is similar. Accordingly, a sufficient condition for the gain equalization is to assure that the cross
sections of the different channels are similar. Unfortunately, complete spectral gain equalization in a
given mode is not possible, because it is not possible to make the emissioncross section independent
from the wavelength, since the value of this parameter depends on the position of energy levels of the
erbium ions in the silica matrix [16].
The second case relates to optical channels of same wavelength but distinct spatial modes.
Consider, for example, a channel located at 1530 nm and composed of the spatial modes LP01,s and
LP11,s. For this case, the emissioncross sections are similar
se,i se,j
and Eq. 10 must be satisfiedfor the design of the FM-EDF, by careful selection of the Erbium doping profile as well as the choice
of the pump signal mode.
Finally, the third case is a generalization of the previous two, that is, the input signal is composed of
different optical channels and of different spatial modes, for example, channels at 1530 and 1550 nm
for spatial modes LP01,s and LP11,s . In this case, besides the similarity between the overlap integrals, it
is necessary that sej e
i s, ,
(for different signal wavelength components).
Concerning this required spectral equalization, in the unsaturated region, the amplifier shows
maximum gain close to 1530 nm and a relatively flat region between 1540 and 1560 nm. However, in
moderate inversion condition, the region close to 1530 nm presents higher attenuation, due to the
higher value of the absorption cross section [16]. Therefore, controlling the equalization of the
amplifier simply through the inversion control is not effective for long distance systems. This is
because the link reach and, consequently, the link loss are a paramount factor to determine the level of
inversion of the fiber. In other words, intentional variations of the loss of links generate
non-equalized gain. To overcome this difficulties a multi-objective optimization procedure for the design
B. Multi-objective optimization
The methodology applied to the FM-EDFAs design for WDM signals is presented in this section.
The methodology can be used in single channel as well as WDM systems, being divided into four
phases: (a) parameters definition, (b) solution of the multi-objective problem, (c) determination of the
FM-EDF optimum length, and (d) analysis of the amplifier performance.
1. Parameters definition: parameters concerning the input signal, the FM-EDF and the pump
signal are defined in the phase. The modes are characterized by the distribution of
normalized intensity, optical power and frequency of each component. Because the
wavelength of the pump signal, e.g. 980 nm, is lower than the input signal, e.g. C band, the
value of the pump beam normalized frequency is higher, allowing more propagatingmodes.
Desired restrictions on the allowed geometries of the doping profile for the FM-EDF are
specified in this phase.
2. Solution of the multi-objective problem: to determine the pumping mode and the variables
that specify the geometry of the FM-EDF profile, in order to reduce the differential modal
gain (DMG) without lowering the absolute gain, is translated into a multi-objective
optimization problem (MOOP). The objective functions, which describe the design problem
as a trade-off between the conflicting goals (high modal gain and low DMG), are defined as
x 1
f , (11)
x 2f , (12)
where and are the average and standard deviation of our figure of merit, defined by
Eq. 8. The definition of the MOOP in terms of the figure of merit defined by Eq. 8 causes
the reduction of processing time required for the FM-EDFA design, allowing the algorithm
NSGA-II [10] to be employed for MOOP solution. Although there is no guarantee of
obtaining the global optimum, optimum local solutions are easily found.
3. Determination of the FM-EDF optimum length: the third phase determines the FM-EDF
ideal length. In a WDM input signal, as the inversion of the Er ions population affects the
value of the differential spectral gain (DSG), for each level of intensity of the input and
pump signals, there is an optimum length. The length in which the FM-EDFA displays
lower DSG and DMG and higher average gain is chosen as the ideal length.
4. Performance analysis of the FM-EDFA: in the final phase, the main parameters of the
FM-EDFA (average gain, DMG, DSG and ∆G) are determined for a set of values of intensity of the input signal and pump power by the rigorous solution of propagation and rate equations.
In case the design target goals are not achieved, the pump mode and profile determined by
the algorithm NSGA-II are disregarded. New simulations are performed up to the point
IV. SIMULATION AND ANALYSIS
In this section, the LPlm,p and LPlm,s notations are used to denote the spatial mode LPlm in the
wavelength of the pump signal, e.g. 980 nm, and the C-band input signal, respectively. Likewise, the
LPlma and LPlmb notations represent the degenerated LPlm mode of odd and even orientations,
respectively.
The pump signal is considered monochromatic and co-propagating, with wavelength equal to 980
nm. Taking into account the degenerated modes, the pump signal is represented by
,p ,p
p
, LP LP
2 1
LPlm lma lmb . (13)
The pump signal is modal and polarizationmultiplexed. For the non-degenerated modes, the signal
is represented by
0 ,s 0 ,s
s,
0 LP LP
LP m mx my , (14)
while the degenerated modes are defined by
,s ,s ,s ,s
s, LP LP LP LP 2
1
LPlm lmax lmay lmbx lmby , (15)
in which LPlmax,s and LPlmay,s represent polarization x and y of the degenerated mode LPlma,s
respectively.
In the sections to follow, first, the FM-EDFA is designed considering a WDM signal composed by
two group modes (LP01,s and LP11,s). Next, an optical system is simulated in order to analyze the
performance of the amplified signal, considering its average gain, differential modal and spectral gain
and gain excursion.
A. FM-EDFA for WDM signals
In this subsubsection, each mode of the input signal is composed by 16 spaced channels between
1530 and 1550 nm. ASE noise is considered in the simulations. The core radius and numerical
aperture (NA) of the FM-EDF used in the simulations are equal to 7.18 m and 0.13 respectively. The
refractive index difference at the core-cladding interface and the erbium ion density are 5.91×10⁻³ and
5×1024 [m-3]. The target geometry of the FM-EDF doping profile is pre-selected as annular, or, in
other words, defined by two concentric rings of radius x1 and x2. The values of the emission and
absorption cross sections are extracted from [17] (corresponding to the R37003X fiber).
The pump signal wavelength is 980 nm, and the normalized frequency is 5.98, in such way that
there are six spatial propagation modes (LP01,p, LP11,p, LP21,p, LP02,p, LP31,p and LP12,p). The
methodology described in the previous section was then applied and the resulting radii that define the
Er doping profile are x1 = 1.91 m and x2 = 7.18 m. The optimization algorithm NSGA-II also
identifies the LP11,p mode as the most suitable pump mode to promote the amplifier performance.
The values of average gain and DMG as a function of the length of the FM-EDFA are illustrated in
Fig. 2(a). The pumping intensity is 275 mW and the power per channel is -22 dBm (total of -10
our figure of merit, concerning the amplified signal composed by 16 channels.
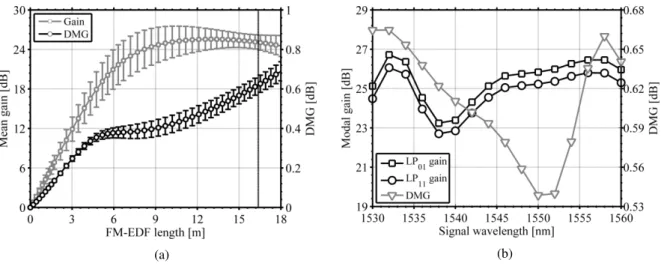
(a) (b)
Fig. 2: Performance of the FM-EDFA: (a) average gain and DMG as a function of the length of the FM-EDF and (b) modal gain and DMG as a function of the wavelength with ideal FM-EDF length equal to 16.4 m. The power of the input signal per
channel is -22 dBm and the pump power is 275 mW.
The average gain, whose maximum value is 25.5 dB, is directly proportional to the length of the
FM-EDF up to 12.8 meters. After this point, the value of the average gain decreases, due to the
absorption of the amplified optical signal. However, the minimum value of the standard deviation for
our figure of merit occurs at the length of 16.4 meters. As a consequence, this length corresponds to a
minimum value of DSG, equal to 3.3 dB, while the corresponding average gain is 25 dB, only 2 %
lower than the maximum average gain (25.5 dB). Although the increase of the DMG is lower than the
0.15 dB (0.57 dB and 0.68 dB in 12.8 meters and 16.4 meters, respectively) for maximum gain
operation, the variation of the DSG is quite high, of 1.9 dB (5.3 dB and 3.4 dB in 12.8 m and 16.4 m
respectively), justifying the choice of the FM-EDF ideal lengths 16.4 m. In what follows, this initial
amplifier design is called design A.
The modal gain spectrum and the value of the DMG are shown in Fig. 2(b), taking the same optical
power of the input and pump signals used when considering the FM-EDF length equal to 16.4 meters.
The difference in modal gain is lower than 0.68 dB along the whole C-band, therefore being lower
than the DSG. Then, in this case, the main factor of optical signal degradation is the high value of the
differential spectral gain, penalizing the channels located in the spectral region around 1540 nm,
because the gain level is about 2 dB lower than observed in the spectral range between channels 1545
and 1560 nm.
The ideal length of the FM-EDF varies according the power of the input and pump signals, due to
the change on the inversion level. Fig. 3 shows the performance of the design A FM-EDFA as
function of the pump power and of the power of the input signal. In the first case (Fig. 3(a)), the pump
intensity of the LP11,p mode varies between 100 and 345 mW and the power per channel equals to -22
dBm. The higher the pump intensity the higher the fiber length necessary to absorb the pump signal as
well as to guarantee a moderate inversion along the fiber. Likewise, the average gain and the DSG are
optical pumping level.
The performance of the FM-EDF as a function of the input signal power is shown in Fig. 3(b),
taking into account the pump intensity 275 mW. Similarly to what is observed in Fig. 3(a), the ideal
length varies inversely to the input signal level.
(a)
(b)
Fig. 3: Performance of the FM-EDFA as function (a) of the pump power of the LP11p mode and -22 dBm per channel and (b)
power of the input signal per channel and 275 mW of pump intensity.
B. Optical MDM-WDM systems
The block diagram of the simulated system is shown in Fig. 4. Since the optical fiber is not
explicitly included in the diagram, only attenuation effects are considered in the analysis. In the
simulation, three WDM transmitters, one for each mode (LP01, LP11a, LP11b, respectively) generate the
optical signal with 16 equally spaced channels between 1530 and 1560 nm. The optical power per
channel equals to -15 dBm, representing -3 dBm per mode. The WDM optical signals are multiplexed
through a lossless modal multiplexer (MMUX) and the FM-EDFA placed after the MMUX ensures
that the optical power at the link input is 5 dBm/channel.
Fig. 4: Block diagram of the simulated communication system, with input signal multiplexed both in the modal and wavelength domains.
The simulated optical link consists of an optical attenuator (ATT), whose attenuation is equal to 20
set of devices (ATT plus FM-EDFA) is repeated NL times. Finally, an optical spectrum analyzer
(OSA) is used to evaluate the properties of the optical signal.
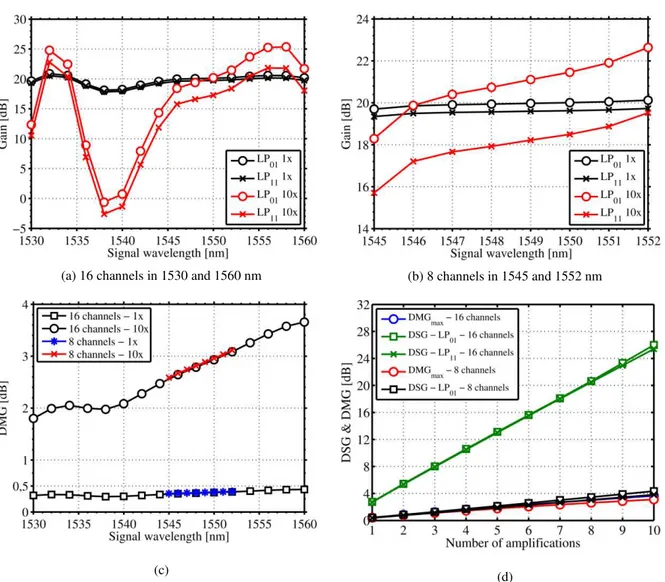
Fig. 5(a) shows the gain spectrum for each mode group of the amplified signal. The analysis focus
on two specific points in the system: the outputs of the first and tenth amplifiers, the last case
corresponding to the 10th identical span. The maximum values of DSG and of DMG of the amplified
optical signal are 2.8 dB and 0.43 dB, respectively, in the first passing through the amplifier. After ten
rounds of amplification, these values increase to 26 dB and 3.7 dB.
(a) 16 channels in 1530 and 1560 nm (b) 8 channels in 1545 and 1552 nm
(c) (d)
Fig. 5: Performance of the simulated optical system, in which the parameters are extracted from the output signals of the first (1x) and of the tenth (10x) amplifier (design A) of the optical link, considering two input signals, composed by 16 or 8
channels.
The results indicate that the values of DSG can become prohibitively high across the overall
C-band. In order to minimize the effects of the DSG on the amplified signal, a possible solution is to
restrict signal transmission to the spectral region between 1545 and 1552 to take advantage of its
higher level of gain equalization. In this case, each optical signal generated was composed of eight
equally spaced channels, with optical power of -12 dBm per channel, representing -3 dBm of optical
intensity per mode.
values of DSG and of DMG of the amplified optical signal in the first passing are 0.42 dB and 0.4 dB,
respectively. After ten amplifications, these values increase to 4.3 dB and 3.1 dB. Compared to the
previous case, there is a significant decrease on the DSG (4.3 versus 26 dB) with little variation on the
DMG, albeit at expense of a reduction on the available optical bandwidth.
From the analysis of Fig. 5(c), which shows the DMG of the amplified optical signal as a function
of the wavelength, the DMG does not depend on the number of channels (16 or 8 channels) but rather
on the power per mode, because the values of the differential modal gain (DMG) are similar in the
region between 1545 and 1552 nm.
Next, Fig. 5(d) shows the maximum DSG and DMG as a function of the number of amplification
spans. All parameters analyzed are directly proportional to the number of amplification stages and,
consequently, to the length of the optical link. The difference between the cases analyzed (16 or 8
channels, respectively) are the values of the DSG, higher for the case in which 16 channels compose
the input signal.
The final analysis consists of examining the performance degradation arising from the use of a
conventional, uniform doping FM-EDFA, not specifically designed for MDM-WDM optical systems.
The resulting lack of gain equalization (expressed in terms of DSG and DMG), as a function of the
number of amplifiers along the link, is presented in Fig. 6(a) for an amplified MDM-WDM system
considering an FM-EDF of uniform doping profile. The properties of the FM-EDF of uniform profile,
such as ions density and numerical aperture, are similar to the fiber used on the design A FM-EDFA
of the previous sections. However, in the case discussed here the optimum fiber length is 11.25
meters. This second amplifier design is called design B FM-EDFA.
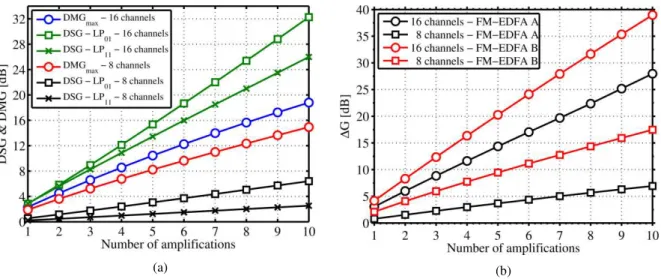
(a) (b)
Fig. 6: (a) DSG and DMG parameters of the amplified optical signal with design B FM-EDFA and (b) maximum variation of gain G as a function of the number of amplifiers along the optical link. Two input signals are considered, composed by 16 and 8 WDM channels, respectively, and, in (b), two FM-EDFA are used: model A EDFA A and the uniform doping
FM-EDFA (model B).
After ten amplifications spans, in the best case scenario (8 channels), the maximum values of DSG
for modal gain equalization, the main source of penalties becomes the DMG (and not the DSG, as in
the previous design), clearly demonstrating the need for specific tailoring of the FM-EDFA doping
profile in order to assure modal equalization.
The gain excursion, defined in Eq. 3, is illustrated in Fig. 6(b). For this analysis, the amplifiers
considered are models A and B, respectively, and the two input optical signals are composed of 8
optical channels with -12 dBm per channel or 16 optical channels with -15 dBm per channel. The total
power per mode in both cases is -3 dBm. Accordingly to Fig. 5(d), when model A is used and the
signal is composed by 16 channels, the raising of G can be mostly attributed to the signal DSG. In
fact, the value of G after ten amplifications is 28 dB, while the maximum values of DSG and DMG
are 26 dB and 3.7 dB respectively.
In the case where model A FM-EDFA is used and the signal is composed of 8 channels, the
contributions to G are equally divided between the parameters DSG and DMG, also representing the
best system performance. In contrast, accordingly to Fig. 6(a), when model B is used (uniform doping
profile) and the input signal composed by 16 channels, the higher portion of G still comes from the
DSG effect. However, when the signal is composed by 8 channels, the DMG effect provides the major
contribution to G.
V. CONCLUSION
The optimum doping profile of FM-EDFAs was investigated by using our proposed figure of merit,
a modified overlap integral, to calculate the gain performance of each configuration. The use of the
figure of merit greatly reduces computational effort, allowing the designer to employ the NSGA-II
genetic algorithm for a complete search of the whole solution space.
It is then possible to propose novel doping profiles, not yet investigated in the literature. An
optimum design, considering both pump mode and doping, was provided and a WDM analysis was
carried out. When comparing the system performance accordingly to the amplifier model used, it is
demonstrated that a specifically designed FM-EDFA is essential for an improved performance of the
MDM-WDM optical system since FM-EDFAs with uniform doping profiles cannot provide adequate
levels of gain equalization.
ACKNOWLEDGMENT
This work was partially supported by CNPq (Brazilian Research Council).
REFERENCES
[1] S. Savory, “Digital coherent optical receivers: Algorithms and subsystems,” IEEE Journal of Selected Topics in Quantum Electronics, vol. 16, no. 5, pp. 1164–1179, 2010.
[2] R.-J. Essiambre, G. Kramer, P. Winzer, G. Foschini, and B. Goebel, “Capacity limits of optical fiber networks,”
IEEE Journal of Lightwave Technology, vol. 28, no. 4, pp. 662–701, 2010.
[3] D. Qian, M.-F. Huang, E. Ip, Y.-K. Huang, Y. Shao, J. Hu, and T. Wang, “101.7-Tb/s (370×294-Gb/s) PDM-128QAM-OFDM transmission over 3×55-km SSMF using pilot-based phase noise mitigation,” in Optical Fiber Communication Conference/National Fiber Optic Engineers Conference 2011. Los Angeles, EUA: Optical Society of America, March 2011, p. PDPB5.
“102.3-Tb/s (224×548-Gb/s) C- and extended L-band all Raman transmission over 240 km using PDM-64QAM
single carrier FDM with digital pilot tone,” in Optical Fiber Communication Conference/National Fiber Optic Engineers Conference 2012. Los Angeles, EUA: Optical Society of America, 2012, p. PDP5C.3.
[5] G. Le Cocq, Y. Quiquempois, and L. Bigot, “Optimization algorithm applied to the design of few-mode erbium
doped fiber amplifier for modal and spectral gain equalization,” IEEE Journal of Lightwave Technology, vol. 33, no. 1, pp. 100–108, 2015.
[6] Q. Kang, E.-L. Lim, F. P. Y. Jung, C. Baskiotis, S. ul Alam, and D. J. Richardson, “Minimizing differential modal gain in cladding-pumped EDFAs supporting four and six mode groups,” Optics Express, vol. 22, no. 18, pp. 21 499–21 507, 2014.
[7] Q. Kang, E.-L. Lim, Y. Jung, J. K. Sahu, F. Poletti, C. Baskiotis, S.U. Alam, and D. J. Richardson, “Accurate modal gain control in a multimode erbium doped fiber amplifier incorporating ring doping and a simple LP01 pump
configuration,” Optics Express, vol. 20, no. 19, pp. 20 835–20 843, September 2012.
[8] Q. Kang, E.-L. Lim, F. P. Y. Jung, C. Baskiotis, S. ul Alam, and D. J. Richardson, “Minimizing differential modal gain in cladding-pumped EDFAs supporting four and six mode groups,” Optics Express, vol. 22, no. 18, pp. 21 499–21 507, 2014.
[9] G. L. Cocq, Y. Quiquempois, A. L. Rouge, G. Bouwmans, H. E. Hamzaoui, K. Delplace, M. Bouazaoui, and L.
Bigot, “Few mode Er3+-doped fiber with micro-structured core for mode division multiplexing in the C-band,”
Optics Express, vol. 21, no. 25, pp. 31 646–31 659, Dezembro 2013.
[10] K. Deb, A. Pratap, S. Agarwal, and T. Meyarivan, “A fast and elitist multiobjective genetic algorithm: NSGA-II,”
IEEE Transactions on Evolutionary Computation, vol. 6, no. 2, pp. 182–197, 2002.
[11] L. Bigot, G. Le Cocq, and Y. Quiquempois, “Few-mode erbium-doped fiber amplifiers: A review,” IEEE Journal of Lightwave Technology, vol. 33, no. 3, pp. 588–596, 2015.
[12] D. Gloge, “Weakly guiding fibers,” Applied Optics, vol. 10, no. 10, pp. 2252–2258, 1971.
[13] Z. Jiang and J. R. Marciante, “Impact of transverse spatial-hole burning on beam quality in large-mode-area
Yb-doped fibers,” Journal of the Optical Society of America B, vol. 25, no. 2, pp. 247–254, 2008.
[14] N. Bai, E. Ip, T. Wang, and G. Li, “Multimode fiber amplifier with tunable modal gain using a reconfigurable
multimode pump,” Optics Express, vol. 19, no. 17, pp. 16 601–16 611, 2011.
[15] A. Herbster and M. A. Romero, “On the design of few-mode Er-doped fiber amplifiers for space-division multiplexing optical communications systems,” in Proceedings of SPIE, vol. 9131, 2014, pp. 91 310Y–91 310Y–9. [16] P. C. Becker, N. A. Olsson, and J. R. Simpson, Erbium-Doped Fiber Amplifiers: Fundamentals and Technology.
San Diego, EUA: Academic Press, 1999.