ABSTRACT: Broiler strains available in the poultry industry present different requirements for dietary lysine due to their different growth potentials as a result of their genetic makeup. This study aimed to determine the model parameters for maximum nitrogen retention (NRmaxT), the ni-trogen maintenance requirement (NMR) and the efficiency of lysine utilization (bc–1) to reevaluate the lysine (Lys) requirements of male and female broilers. Nitrogen balance trials were performed during three periods (I: 6-21 days, II: 22-37 days, and III: 38-53 days). Seven treatments were used for males and females; the treatments consisted of seven diets with protein levels ranging from 61 to 364 g kg–1 dry matter, with Lys being limiting in the dietary nitrogen (4.91 g of Lys in
16 gofN). Nitrogen intake (NI), excretion (NEX), deposition (ND, ND=NI-NEX) and retention (NR, NR=ND+NMR) values were obtained. The NMR was represented by the exponential relationship between NEX and NI. The NRmaxT and bc
–1 were estimated by the exponential fit between ND and NI. The NRmaxT, bc
–1, and NMR values were combined in a model to estimate Lys intake by simulating different percentages of the NRmaxT. The Lys intake estimates were 581, 1,538, and
2,171 mg day–1 for males and 512, 1,340, and 1674 mg day–1 for females during periods I, II,
and III, respectively. Due to the flexibility of the model, it is possible to calculate the Lys intake for percentages of NR in the range of practical performance data.
Keywords: amino acid, exponential model, maintenance, nitrogen retention, performance Received July 12, 2013
Accepted February 07, 2014
São Paulo State University – Dept. of Animal Sciences and Nutrition, Via de Acesso Prof. Paulo Donato Castellane s/n – 14884-900 – Jaboticabal – SP – Brazil.
*Corresponding author <[email protected]>
Edited by: Concepta Margaret McManus Pimentel
Reevaluation of the digestible lysine requirement for broilers based on genetic
Juliano Cesar De Paula Dorigam, Nilva Kazue Sakomura*, Luciano Hauschild, Edney Pereira da Silva, Hilda Cristina Palma Bendezu, João Batista Kochenborger Fernandes
potential
Introduction
The broiler strains available in the poultry market present different dietary amino acid requirements due to the different growth potentials of each bird, which are determined mainly by genotype (Smith and Pesti, 1998) and other factors, such as sex and age (Zuprizal et al., 1992; Rosa et al., 2001). Accordingly, the determination of the amino acid requirements of poultry is dependent on adequate description of the potential of the birds for protein deposition according to genotype, age and sex. This potential has been determined in nitrogen balance trials (Samadi and Liebert, 2007).
In addition to the maximum potential for pro-tein deposition, the efficiency of amino acid utilization and nitrogen requirements for maintenance have been integrated into a factorial equation that enables amino acid requirements to be estimated (Samadi and Liebert, 2007). The efficiency of amino acid utilization typical-ly has been represented by a model, in which the re-sponse of the bird to amino acid intake is constant and linear to the point where maximum protein deposition is achieved. However, studies have demonstrated that the response of a group of birds to nutrient intake is cur-vilinear due to variability in maintenance and growth potential (Curnow, 1973).
Broilers with a high capacity for lean deposition require higher amounts of lysine to maximize both their performance and the protein deposition rate in the car-cass. Lysine is considered to be the second most limiting amino acid after the sulfur-containing amino acids for
broilers fed diets based on corn and soybean meal. For these reasons lysine was chosen as the reference amino acid as the ideal protein concept, in which all other es-sential amino acids are formulated into the diet as a ra-tio to lysine (Emmert and Baker, 1997). Consequently, obtaining an accurate and precise estimate of lysine re-quirements of broilers is highly desirable. In addition, formulating diets based on an ideal protein concept re-sults in an efficient use of dietary protein by improving nitrogen utilization, resulting in minimal nitrogen excre-tion.
Responses to dietary lysine levels have been stud-ied for decades and mathematical models have been de-veloped to predict lysine requirements (Han and Baker, 1994; Samadi and Liebert, 2007; Samadi and Liebert, 2008; Goulart et al., 2008). However, the daily dietary lysine requirements have changed over the past few years because of the considerable influence of progress in genetics. Thus, this study aimed to reevaluate the di-gestible lysine requirements of male and female broilers based on their genetic potential.
Materials and Methods
Birds and housing
indi-vidually distributed in a completely randomized design with seven treatments composed of six males and six females per experimental unit. The experimental units consisted of metabolic cages with wire flooring equipped with individual feeders and water drinkers. This study was approved by the Ethics Committee on Animal Use (CEUA) of the Faculty of Agriculture and Veterinary Sci-ences, UNESP, Jaboticabal (protocol number 007125-08).
Experimental diets
The first six treatments consisted of varying levels of dietary protein at 61 (N1), 124 (N2), 183 (N3), 239 (N4), 295 (N5), and 364 (N6) g kg–1 of dry matter (DM);
these treatments all maintained lysine as the first limit-ing amino acid (at 4.91 g of lysine for every 16 g of N). The seventh treatment (N7) was obtained by adding 4 g of L-lysine HCl (78 %) per kg of feed to a diet composi-tion similar to that of N1 containing 61 g kg–1 DM to
verify that lysine was the first limiting amino acid in the diets. The experimental diets were obtained by diluting
a high protein diet (consisting of soybean meal, corn glu-ten meal and crystalline amino acids) with a protein-free diet consisting mainly of corn starch (Table 1) to obtain the graded levels of dietary protein and to keep lysine as the first limiting amino acid in all diets (thereby main-taining the amino acid ratio). The composition of digest-ible amino acids analyzed in the experimental diets is presented in Table 2. The proportion of high protein diet (N6) to protein-free diet used in the preparation of the experimental diets was 15:85 for N1, 32:68 for N2, 49:51 for N3, 66:34 for N4, 83:17 for N5, and 100:0 for N6.
Feeding and data collection
The experimental period was divided into five days of adaptation to the diets followed by two consecu-tive periods of excreta collection (five days each); at the end of each period, nitrogen balance data were obtained from six different birds receiving the same diet. The ex-perimental diets were provided ad libitum throughout the entire study period. During the collection periods,
Table 1 – Composition of experimental diets.
Ingredients Diets
(g kg–1) High protein (N6) Protein-free
Soybean meal (45 %) 540.3
-Corn 170.0
-Corn gluten meal (60 %) 165.0
-Soybean oil 80.7 65.0
Dicalcium phosphate 19.0 27.0
Limestone 7.2 3.4
Salt 5.1 5.2
DL-Methionine (99 %) 4.5
-L-Lysine HCl (78 %) 3.5
-L-Threonine (99 %) 1.5
-Vitaminic supplement1 1.0 1.0
Choline chloride (70 %) 0.7 0.7
Mineral supplement2 1.0 1.0
Anticoccidial3 0.5 0.5
Potassium chloride - 12.8
Corn starch - 595.0
Inert (sand) - 59.6
Rice husk - 128.8
Sugar - 100.0
Nutritional composition (g kg–1 DM)4 Diets
N1 N2 N3 N4 N5 N6 N7
Crude protein 61.0 124.0 183.0 239.0 295.0 364.0 61.0
Ether extract 72.1 89.1 83.2 88.7 94.3 99.8 72.1
Crude fiber 48.4 45.5 42.6 39.7 36.8 33.9 48.4
Calcium 9.3 9.3 9.3 9.3 9.3 9.3 9.3
Sodium 2.2 2.2 2.2 2.2 2.2 2.2 2.2
Potassium 6.6 7.4 8.2 9.0 9.8 10.6 6.6
Available phosphorus 4.7 4.7 4.7 4.7 4.7 4.7 4.7
AMEn (Mcal kg
–1)5 3.15 3.15 3.15 3.15 3.15 3.15 3.15
1Vitaminic mixture (content per kg of the supplement): Vitamin A, 7,000,000 IU; Vitamin D3, 2,200,000 IU; Vitamin E, 11,000 mg; Vitamin K3, 1,600 mg; Vitamin B1,
2,000 mg; Vitamin B2, 5,000 mg, Vitamin B12, 12,000 µg; Niacin, 35,000 mg; Pantothenic acid, 13,000 mg; Folic acid, 800 mg; Vehicle q.s.p. 1,000 g; 2Mineral
mixture (content per kg of the supplement): Iron, 10,000 mg; Copper, 16,000 mg; Iodine, 2,400 mg; Zinc, 100,000 mg; Manganese, 140,000 mg; Selenium, 400 mg; Vehicle q.s.p. 1,000 g; 3Coxistac 12 %; 4Calculated composition using data from the Brazilian Tables for Poultry and Swine (Rostagno et al., 2011); 5Apparent
the excreta were collected in trays (free from feathers) and weighed at the end of each period.
Chemical analysis
The samples of excreta obtained from each experi-mental unit during each period were thawed, homog-enized, weighed in Petri dishes and frozen again. After-wards, the excreta samples were freeze-dried for 72 h at -80 °C and 0.08 MPa of pressure. The samples were weighed to quantify the dry matter content and were then ground in a Micro Mill. The total nitrogen contents of the diets and excreta were analyzed in a nitrogen dis-tiller using the Kjeldahl method (Method No. 2001.11) according to AOAC (2005). A factor of 6.25 was used in the conversion of the nitrogen value to crude protein (CP). The total amino acid content of the ingredients in the experimental diets was analyzed using high perfor-mance liquid chromatography (HPLC), and these values were corrected for digestible amino acids using the tabu-lated coefficients of digestibility (Rostagno et al., 2011).
Statistical analysis
Data were analyzed by a one-way ANOVA using a GLM procedure and were fitted to exponential models using PROC NLIN in SAS (Statistical Analysis System, version 9.1); the Levenberg-Marquardt algorithm was used to converge on a solution for these models.
Regression analysis between nitrogen intake (NI, mg BW0.67 kg–1 day–1) and nitrogen excretion (NEX, mg
BW0.67 kg–1 day–1) was used in the fitting of the
exponen-tial function:
NEX = NMR × eb × NI (1)
where NMR is the nitrogen requirement for maintenance (mg BW0.67 kg–1 day–1), b is the slope of the exponential
curve and e is the base number of the natural logarithm (ln). From the exponential function (1), the NMR was es-timated by considering the intercept of the curve on the y-axis (NEX) when NI = 0. The nitrogen balance or nitro-gen deposition (ND, mg BW0.67 kg–1 day–1) was calculated
as the difference between NI and NEX (ND=NI-NEX).
Regression analysis between NI and nitrogen re-tention (NR = ND + NMR, mg BW0.67 kg–1 day–1) was
performed to fit another exponential model:
NR = NRmaxT × (1 - e –b × NI) (2)
where NRmaxT is the theoretical maximum nitrogen re-tention (mg BW0.67 kg–1 day–1). Another way to express
the exponential model (2), according to Samadi and Li-ebert (2007), is by regression analysis between NI and ND, considering ND = NR-NMR, as shown here:
ND = NRmaxT × (1 - e –b × NI) – NMR (3)
The model generated in equation (3) was used to estimate NRmaxT for each age, where b is the slope of the nitrogen retention curve and e is the base number of the natural logarithm (ln). The NRmaxT was estimated by a statistical procedure following several iterations by the Levenberg-Marquardt algorithm until the sum of the squares of the residual was minimized. The theoretical maximum nitrogen deposition (NDmaxT, mg BW0.67 kg–1
day–1) for each period was obtained by subtracting the
NMR from the NRmaxT (NDmaxT = NRmaxT - NMR) ex-pression.
To estimate digestible lysine requirements, the first step was to modify equation (2) by logarithmiza-tion and by several conversions, the b parameter, used as feed protein evaluation, can be calculated by fol-lowing the equation proposed by Samadi and Liebert (2007):
b = [lnNRmaxT - ln(NRmaxT - NR)] / NI (4)
The b value (×10–6) calculated in this way and
di-vided by the concentration of the limiting amino acid in the feed protein, c (g of AA in 16 gof N), was used to express the efficiency of utilization of the limiting amino acid (bc–1). The bc–1 value (×10–6) is represented by the
slope of the straight line between the quality of the pro-tein in the diet (b) and the limiting amino acid (LAA) concentration (c) in the diet provided.
Table 2 – Digestible amino acid content of experimental diets.
Amino acids (AA)1 N1 N2 N3 N4 N5 N6 N7 AA-Ratio (AA/lysine)
Lysine 4.53 4.74 4.92 5.07 5.16 5.04 9.43(100)2 100
Arginine 5.18 5.43 5.63 5.80 5.90 5.77 4.87(52) 114
Histidine 2.07 2.17 2.25 2.32 2.36 2.31 1.95(21) 46
Isoleucine 3.64 3.82 3.96 4.08 4.15 4.06 3.42(36) 81
Leucine 8.84 9.27 9.61 9.90 10.07 9.84 8.30(88) 195
Met+Cys 3.65 3.83 3.97 4.09 4.16 4.07 3.43(36) 81
Methionine 2.50 2.63 2.72 2.80 2.85 2.79 2.35(25) 55
Threonine 3.36 3.52 3.65 3.76 3.82 3.73 3.15(33) 74
Tryptophan 0.88 0.92 0.96 0.99 1.00 0.98 0.83(9) 19
Valine 3.83 4.01 4.16 4.29 4.36 4.26 3.60(38) 85
The necessary NI for a defined level of NR, de-pending on the parameter b (feed protein quality), can be calculated from a modification of the following equa-tion (4):
NI = [lnNRmaxT - ln(NRmaxT - NR)] / b (5)
According to Samadi and Liebert (2008), the math-ematical description of NI against limiting amino acid intake (LAAI) is calculated as:
NI = 16LAAI / c (6)
The LAAI was obtained by replacing NI in equa-tion (5) with equaequa-tion (6), resulting in equaequa-tion (7):
LAAI = [lnNRmaxT - ln(NRmaxT - NR)] / 16bc–1 (7)
where LAAI is the intake of the LAA and bc–1 is the
effi-ciency of utilization of the dietary LAA. The LAAI equa-tion (7) was used to calculate the Lys requirement (mg day–1) based on estimated NR data (targeted growth
per-formance) and bc–1. The NR was expressed as a
percent-age of the NRmaxT using mean values for body weights (BW, g), feed intake (FI, g day–1) and Lys requirements (g
kg–1) from the Cobb500 management guide (Cobb, 2008;
2012) to simulate targeted growth performance recom-mended under practical conditions. For this simulation, the Lys requirement (mg day–1) was expressed per mass
of metabolic BW (mg BW0.67 kg–1 day–1) using a
math-ematical rearrangement of equation (7), where the LAAI (in this case Lys) was multiplied by 16bc–1 resulting in
the following equation (7a):
16×Lys×bc–1 = ln(NR
maxT) - ln(NRmaxT - NR) (7a)
Isolating ln(NRmaxT - NR) in equation (7a) results in equation (7b):
ln(NRmaxT - NR) = ln(NRmaxT) - (16×Lys×bc–1) (7b)
The ln(x)=y function can be interpreted using the usual properties for inverse functions, that is x=e(y).
Considering that x = NRmaxT - NR and y = ln(NRmax T)-(16×Lys×bc–1), it is possible to derive the following
equation (7c):
NRmaxT - NR = e(ln(NRmaxT)-(16×Lys×bc–1)) (7c)
Finally, taking NR as the response in equation (7c) results in equation (8):
NR = NRmaxT - e(ln(NRmaxT)-(16×Lys× bc–1)) (8)
From equation (8), the NR expressed as a percent-age of the NRmaxT (the reference for genetic growth po-tential) was calculated using the NRmaxT and bc–1 values
estimated in this study to model the Lys data and
de-termine the Lys requirement nearest to the growth po-tential observed under practical conditions. The optimal Lys concentration in the diet (g kg–1) was calculated from
the assumptions made for the daily feed intake (± 10g) taken from the management guide for the lineage (Cobb, 2008; 2012). The optimum level of dietary lysine was calculated as the Lys requirement (g day–1) divided by
the feed intake (kg day–1).
Results
The ND data responded (p < 0.001) because of the graded dietary protein supply from N1 to N6 (Ta-ble 3 and 4). Accordingly, the NEincreased (p < 0.001) with increasing NI and mostly exceeded the ND data observed. An increase in the ND response of birds was observed in the counter-proof treatment (N7), and this response was between the values obtained from N1 and N2, confirming that lysine was the first limiting amino acid in the experimental diets.
The NMR values obtained in this study increased from 219 mg BW0.67 kg–1 day–1 (Period I) to 276 mg BW0.67
kg–1 day–1 (period III) and from 225 mg BW0.67 kg–1 day–1
(Pe-riod I) to 271 mg BW0.67 kg–1 day–1 (period III) for males
and females, respectively (Figure 1).
Table 3 – Mean body weight (BW), dry matter intake (DMI), daily nitrogen intake (NI), daily nitrogen excretion (NEX) and daily nitrogen deposition (ND) obtained in nitrogen balance trials with males receiving graded levels of protein1.
Diets
Males
Period I (6-21 days)2
N1 N2 N3 N4 N5 N6 N7 RSD3 p-value
BW (g) 261 348 381 405 402 417 254 140 NS
DMI (g day–1) 32 48 45 49 48 47 40 12 NS
NI (mg BW0.67 kg–1) 787 1941 2518 3493 4238 5043 1226 112 ***
NEX (mg BW0.67 kg–1) 225 475 741 1163 1622 2294 335 113 ***
ND (mg BW0.67 kg–1) 562 1466 1777 2330 2616 2750 891 93 ***
Diets Period II (22-37 days)
2
N1 N2 N3 N4 N5 N6 N7 RSD3 p-value
BW (g) 1211 1381 1490 1579 1420 1533 1201 269 NS
DMI (g day–1) 105 113 111 113 106 106 114 11 NS
NI (mg BW0.67 kg–1) 918 1826 2503 3193 4006 4652 1265 169 ***
NEX (mg BW0.67 kg–1) 324 669 812 1229 1834 2303 512 133 ***
ND (mg BW0.67 kg–1) 594 1157 1691 1964 2172 2349 753 87 ***
Diets Period III (38-53 days)
2
N1 N2 N3 N4 N5 N6 N7 RSD3 p-value
BW (g) 2902 3039 3166 3249 3198 3103 2874 267 NS
DMI (g day–1) 131 156 155 150 155 147 133 9 **
NI (mg BW0.67 kg–1) 625 1474 2102 2607 3363 4024 811 182 ***
NEX (mg BW0.67 kg–1) 261 575 789 1139 1647 2232 285 159 ***
ND (mg BW0.67 kg–1) 364 898 1312 1468 1716 1792 526 72 ***
1N1=61, N2=124, N3=183, N4=239, N5=295, N6=364 g kg–1 dry matter and N7 is the counter-proof treatment (N1 + 4 g of L-lysine HCl (78 %) per kg of feed); 2Mean value of two collection periods; 3Residual standard deviation, expressed in the same units as the related variable; NS, not significant; **p < 0.05; ***p <
0.001.
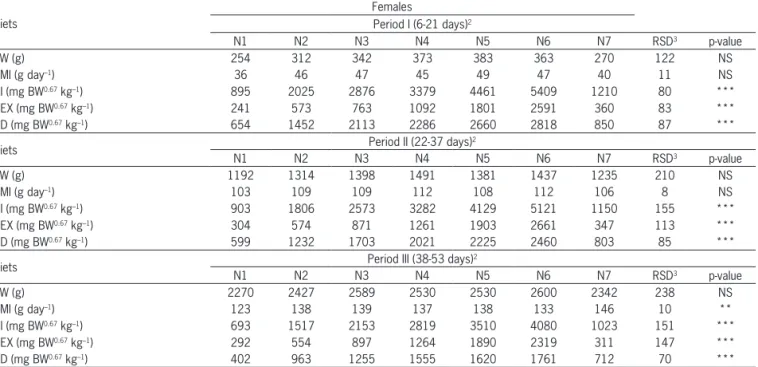
Table 4 – Mean body weight (BW), dry matter intake (DMI), daily nitrogen intake (NI), daily nitrogen excretion (NEX) and daily nitrogen deposition (ND) obtained in nitrogen balance trials with femalesreceiving graded levels of protein1.
Diets
Females
Period I (6-21 days)2
N1 N2 N3 N4 N5 N6 N7 RSD3 p-value
BW (g) 254 312 342 373 383 363 270 122 NS
DMI (g day–1) 36 46 47 45 49 47 40 11 NS
NI (mg BW0.67 kg–1) 895 2025 2876 3379 4461 5409 1210 80 ***
NEX (mg BW0.67 kg–1) 241 573 763 1092 1801 2591 360 83 ***
ND (mg BW0.67 kg–1) 654 1452 2113 2286 2660 2818 850 87 ***
Diets Period II (22-37 days)
2
N1 N2 N3 N4 N5 N6 N7 RSD3 p-value
BW (g) 1192 1314 1398 1491 1381 1437 1235 210 NS
DMI (g day–1) 103 109 109 112 108 112 106 8 NS
NI (mg BW0.67 kg–1) 903 1806 2573 3282 4129 5121 1150 155 ***
NEX (mg BW0.67 kg–1) 304 574 871 1261 1903 2661 347 113 ***
ND (mg BW0.67 kg–1) 599 1232 1703 2021 2225 2460 803 85 ***
Diets Period III (38-53 days)
2
N1 N2 N3 N4 N5 N6 N7 RSD3 p-value
BW (g) 2270 2427 2589 2530 2530 2600 2342 238 NS
DMI (g day–1) 123 138 139 137 138 133 146 10 **
NI (mg BW0.67 kg–1) 693 1517 2153 2819 3510 4080 1023 151 ***
NEX (mg BW0.67 kg–1) 292 554 897 1264 1890 2319 311 147 ***
ND (mg BW0.67 kg–1) 402 963 1255 1555 1620 1761 712 70 ***
1N1=61, N2=124, N3=183, N4=239, N5=295, N6=364 g kg–1 dry matter and N7 is the counter-proof treatment (N1 + 4 g of L-lysine HCl (78 %) per kg of feed); 2Mean value of two collection periods; 3Residual standard deviation, expressed in the same units as the related variable; NS, not significant; **p < 0.05; ***p <
0.001.
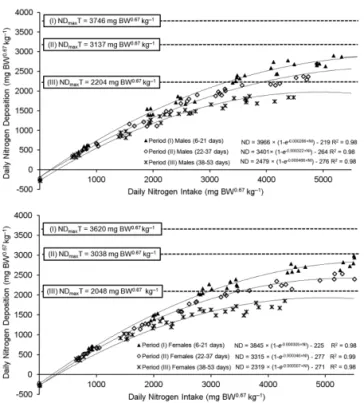
The estimated values of the NDmaxT decreased, depending on age, from 3,746 mg BW0.67 kg–1 day–1
(pe-riod I) to 2,204 mg BW0.67 kg–1 day–1 (period III) for males
and from 3,620 mg BW0.67 kg–1 day–1 (period I) to 2,048
mg BW0.67 kg–1 day–1 (period III) for females (Figure 2).
In contrast, the b parameter calculated by equation (4) increased with age and was 286, 322, and 466×10–6 for
pe-riods I, II, and III, respectively. This increase in the b
value was accompanied by a decline in the NDmaxT value that can be observed in Figure 2 and is characteristic of the modeling procedure. Consequently, the efficiency of lysine utilization, bc–1, also increased.The mean
val-ues for the ratio between the b parameter and the lysine concentration, c, (from Table 2) were estimated at 58, 66, and 96×10–6 for males and 62, 71, and 104×10–6 for
females during periods I, II, and III, respectively. Results of the simulation using equation (8) and data from the Cobb500 management guides to estimate the NR under practical conditions are summarized in Table 5. The simulation showed that the potentials for nitrogen retention (NR) using the 2008 recommenda-tions are 64 and 65 % of the NRmaxT (period I), 71 and 73 % of the NRmaxT (Period II), and 75 and 77 % of the NRmaxT (Period III) for males and females, respec-tively. For the 2012 management guide recommenda-tions, the estimated potentials for the birds were 65 % of the NRmaxT for both sexes (period I), 72 and 71 % of the NRmaxT (period II), and 79 and 78 % of the NRmaxT (period III) for males and females, respectively. The dif-ference in the potentials from 2008 to 2012 represented approximately 1 to 4 % for males but no more than 1 % for females.
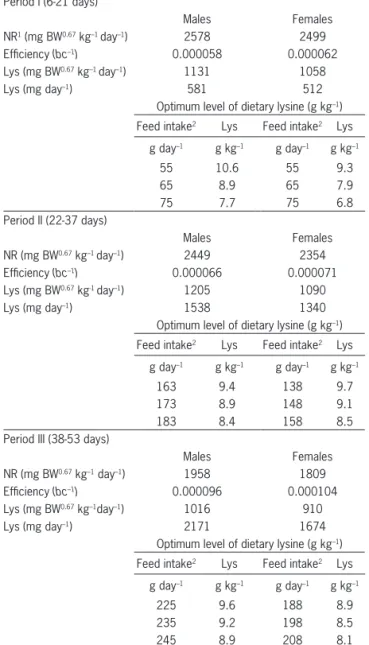
Results for modeling of the Lys requirement data from equation (7) are summarized in Table 6 and dem-onstrate the application of the modeling procedure to establish Lys requirement data (mg day–1) from the
tar-geted growth potential or nitrogen retention (NR, mg BW0.67 kg–1 day–1) and bc–1.
Based on the calculated values for bc–1, the Lys
in-take required to achieve 65 % of the NRmaxT for both sexes (estimated from the simulation in Table 5) during period I was estimated to be 581 mg day–1 for males and
512 mg day–1 for females. During period II, the Lys
in-take to achieve 72 % of the NRmaxT for males and 71 % of the NRmaxT for females was estimated to be 1,538 mg day–1 for males and 1,340 mg day–1 for females. During
period III, the Lys intake was estimated to be 2,171 mg day–1 for males and 1,674 mg day–1 for females to reach
79 and 78 % of the NRmaxT, respectively.
Discussion
Dose response studies are generally based on the acceptance of a relationship between the content of the limiting amino acid in the diet and the growth response, but this ratio is only valid for the limiting position of the amino acid (Samadi and Liebert, 2006). By adding a small quantity of crystalline lysine in the N1 diet, it was possible to confirm that the amino acid tested in this study was in the limiting position because of the small incremental response in the birds being fed the N7 diet (Tables 3 and 4). This procedure was carried out to demonstrate that the response obtained by the relative deficiency of the test amino acid was independent of the
Figure 2 – Estimation of the theoretical potential for nitrogen deposition (NDmaxT) in male and female broilers of the Cobb500 genotype based on the ratio between the daily nitrogen intake (NI) and the daily nitrogen balance (ND) at different ages.
Table 5 – Comparison between the nitrogen retention (NR) estimated in relation to the theoretical maximum nitrogen retention (NRmaxT)1
using the body weights (BW), feed intake (FI) and lysine requirements (Lys) provided by the management guide for Cobb500 broilers.
Period BW FI Lys Lys NR3 NR
days g g day–1 g kg–1 mg BW0.67 kg–1 day–1 (%NR maxT)
Cobb 2008 Males
6 to 21 501 65 10.1 1090 2522 64
22 to 37 1633 168 9.5 1164 2405 71
38 to 53 3156 212 9.2 910 1860 75
Females
6 to 21 457 63 10.1 1070 2511 65
22 to 37 1442 153 9.5 1150 2417 73
38 to 53 2633 186 9.2 896 1791 77
Cobb 2012 Males
6 to 21 510 65 10.8 1143 2589 65
22 to 37 1583 173 9.6 1218 2461 72
38 to 53 3047 235 9.2 1028 1964 79
Females
6 to 21 488 61 10.8 1064 2506 65
22 to 37 1474 148 9.6 1093 2356 71
38 to 53 2795 198 9.2 920 1814 78
1NR
maxT = 3,966 and 3,845 (6 to 21 days); 3,401 and 3,315 (22 to 37
days); and 2,479 and 2,319mg BW0.67 kg–1 day–1 (38 to 53 days) for males
and females, respectively; 2bc–1= 0.000058 and 0.000062 (6 to 21 days); 0.000066 and 0.000071 (22 to 37 days); and 0.000096 and 0.000104 (38 to 53 days) for males and females, respectively; 3NR = NR
Table 6 – Calculations for the digestible lysine requirements (Lys) using equation (7) for males and females in each period for the targeted response estimated for the Cobb500 genotype using data from the manual for the strain (Cobb, 2012).
Period I (6-21 days)
Males Females
NR1 (mg BW0.67 kg–1 day–1) 2578 2499
Efficiency (bc–1) 0.000058 0.000062
Lys (mg BW0.67 kg–1 day–1) 1131 1058
Lys (mg day–1) 581 512
Optimum level of dietary lysine (g kg–1)
Feed intake2 Lys Feed intake2 Lys
g day–1 g kg–1 g day–1 g kg–1
55 10.6 55 9.3
65 8.9 65 7.9
75 7.7 75 6.8
Period II (22-37 days)
Males Females
NR (mg BW0.67 kg–1 day–1) 2449 2354
Efficiency (bc–1) 0.000066 0.000071
Lys (mg BW0.67 kg-1 day–1) 1205 1090
Lys (mg day–1) 1538 1340
Optimum level of dietary lysine (g kg–1)
Feed intake2 Lys Feed intake2 Lys
g day–1 g kg–1 g day–1 g kg–1
163 9.4 138 9.7
173 8.9 148 9.1
183 8.4 158 8.5
Period III (38-53 days)
Males Females
NR (mg BW0.67 kg–1 day–1) 1958 1809
Efficiency (bc–1) 0.000096 0.000104
Lys (mg BW0.67 kg–1day–1) 1016 910
Lys (mg day–1) 2171 1674
Optimum level of dietary lysine (g kg–1)
Feed intake2 Lys Feed intake2 Lys
g day–1 g kg–1 g day–1 g kg–1
225 9.6 188 8.9
235 9.2 198 8.5
245 8.9 208 8.1
1From Table 5: 65 % of the NR
maxT (3,966 and 3,845 mg BW
0.67 kg–1 day–1for
males and females, respectively) in period I for both sexes; 72 % of the NRmaxT for males (3,401 mg BW0.67 kg–1 day–1) and 71 % of the NR
maxT for females
(3,315 mg BW0.67 kg–1 day–1) in period II; 79 % of the NR
maxT for males (2,479
mg BW0.67 kg–1 day–1) and 78 % of the NR
maxT for females (2,319 mg BW 0.67
kg–1 day–1) in period III; 2 daily feed intake was based on the mean values for
the given period in the management guide for the strain (Cobb, 2012) with extrapolation for 10 g above and 10 g below the mean.
level of dietary protein and was not influenced by the effects of dilution (Fisher and Morris, 1970).
The NMR value estimated in this study represents the amount of N that needs to be ingested to compen-sate for endogenous nitrogen losses, according to Samadi and Liebert (2006). The procedure used in this study is an alternative approach for estimating the maintenance requirements for nitrogen and amino acids because the values obtained from the traditional method, which uses
the inevitable losses from the body protein in birds fed nitrogen-free diets, are underestimated (Samadi and Li-ebert, 2006). As an example of this, the total loss of en-dogenous nitrogen by growing broilers, estimated at 180 mg BW0.75 kg–1 day–1 by Leeson and Summers (2001), is
far below the values determined in this study when they are expressed in BW0.75 (approximately 28 % for both
males and females).
The procedure adopted here assumes that endog-enous catabolism is largely or completely suppressed when the animal is receiving protein in the feed (Mitch-el, 1924). The proportion of the maintenance require-ment in relation to the total requirerequire-ment increases with the age of the bird, and this element must be factored into the estimates. The NMR values obtained in this study are in accordance with the values estimated by Samadi and Liebert (2007) of 220, 260 and 273 mg BW0.67
kg–1 day–1 for males and 223, 275 and 264 mg BW0.67 kg–1
day–1 for females during periods I (10-25 days), II (30-45
days) and III (50-65 days), respectively.
As the maintenance requirements of the broilers become a larger proportion of the total requirement with increasing age, the nitrogen requirements to maximize protein deposition decrease. Due to differences among animals in their maintenance requirements and growth potentials, the response of the study population was cur-vilinear. In a curvilinear response, the utilization of a nutrient is characterized by (i) a linear phase at a subop-timal level, (ii) a curvilinear stage, and (iii) a decrease to the point at which the maximum response is obtained (Baker, 1986). In the curvilinear response obtained in this study (Figure 2), the NDmaxT represents the physi-ological limit of nitrogen deposition that is specific to the genotype.
The threshold values (NDmaxT) observed decreased as age increased and were close to the results reported in the studies of Samadi and Liebert, (2007) for males (3,746 mg vs. 3,676 mg in age period I; 3,137 mg vs. 2,843 mg in age period II; 2,204 mg vs. 1,864 mg in age period III) and females (3,620 mg vs. 3,582 mg in age period I; 3,038 mg vs. 2,697 mg in age period II; 2,048 mg vs. 1,708 mg in age period III) fed diets that were first limiting in lysine.
The results from the simulation data (Table 5) indi-cate that there is still a capacity for retention that could be exploited by geneticists and nutritionists because the potentials for nitrogen retention currently represent only 65, 72, and 79 % (average value of 72 %) of the NRmaxT for males and 65, 71, and 78 % (average value of 71 %) of the NRmaxT for females during periods I, II, and III, respectively.
feeding conditions in which the physiological limit is not expressed.
The characterization of the growth patterns of this strain for protein deposition and the efficiency of utili-zation allows us to establish the appropriate levels for protein and amino acids to reach the desired potential tailored to the limiting conditions. Using the model pa-rameters and the data obtained in this study, it is pos-sible to establish an optimal lysine intake based on the targeted nitrogen retention (as a % age of the NRmaxT) es-timated from the actual Cobb500 recommendation (Ta-ble 6). The simulation indicated that to meet 65 % of the NRmaxT (period I), the concentration of digestible Lys in the diet should be 10.6 g kg–1 for males and 9.3 g kg–1 for
females to obtain values close to the recommendations from the literature if a daily feed intake of 10 grams less than the recommended (Cobb, 2012) is considered. This recommendation is similar to that made by Goulart et al. (2008) of 10.6 g kg–1 (580 mg day–1) for the initial 8-21
days phase for males.
Zaghari et al. (2002) reported that the digestible Lys requirement for maximum body weight gain from 6-21 days of age was 10.75 and 10.49 g kg–1 for males
and females, respectively. The recommendation for fe-males by these authors is higher than the recommenda-tion in this study, but for males, the recommendarecommenda-tions are very consistent. Han and Baker (1994) obtained a digestible lysine requirement estimate of 10.7 g kg–1 for
males, and this recommendation is also similar. The val-ues from these authors for maximum body weight gain can be compared to the estimated digestible lysine rec-ommendation in this study due to the direct relationship between the Lys concentration in the diet and the in-crease in body weight and protein deposition (Mahdavi et al., 2012).
To meet 71 % of the NRmaxT for males and 72 % of the NRmaxT for females in period II, the concentra-tion of digestible Lys in the diet should be 9.4 g kg–1 for
males and 9.7 g kg–1 for females to obtain values close
to the recommendations from the literature if a daily feed intake of 10 grams less than recommended (Cobb, 2012) for these periods is considered (Table 6). These val-ues are close to the recommendations of Han and Baker (1994) of 9.9 g kg–1 for males and 9.1 g kg–1 for females
to maximize weight gain during 3 to 6 wks of age. Simi-lar recommendations for male broilers were made by Goulart et al. (2008) of 9.98 g kg–1 for the growth (22-42
d) phase to obtain the maximal performance. The esti-mated digestible lysine requirements in this study for periods I and II corresponded to approximately 93 % of the recommendations in the Brazilian Tables of 11.5 g kg–1 (10.7 g kg–1) and 10.1 g kg–1 (9.4 g kg–1) of digestible
lysine at ages 8 to 21 days and 30 to 42 days for male broilers, respectively.
To meet 79 % of the NRmaxT for males and 78 % of the NRmaxT for females in period III, the concentra-tion of digestible Lys in the diet should be 9.2 g kg–1 for
males and 8.5 g kg–1 for females if the mean daily feed
intake recommended for this period is considered (Table 6). Mahdavi et al. (2012) determined that the digestible Lys requirement for maximum body weight was 9.3 g kg–1 for both males and females for broilers between 35
and 49 days of age. Compared with the recommenda-tion in this study, the estimate for males is very close, but that for females is higher. However, Mahdavi et al. (2012) concluded that high-yield broilers should be fed a minimum of 8.5 g kg–1 digestible Lys from 35 to 49 days
of age, and this value is similar to the estimate made for female Cobb 500 broilers in this study.
The digestible lysine requirements estimated in this study are slightly below the calculations for 60 % of the theoretical potential for nitrogen retention (10-25 days: 11.0 g kg–1 lysine, 60 g daily feed intake; 30-45
days: 10.3 g kg–1 lysine, 140 g daily feed intake; 50-65
days: 9.6 g kg–1 lysine, 170 g daily feed intake) used in
the study by Samadi and Liebert (2007) for the Cobb500 genotype. Urdanneta-Rincon et al. (2005) reported that both protein synthesis and breakdown increased when the levels of dietary Lys and crude protein were above those required for maximum growth. In this way, using the maximum potential for deposition as a reference for modeling the digestible lysine requirement allows for optimal digestible Lys levels to be supplied, result-ing in a decrease in nitrogen excretion and a reduction in the feed costs, because protein is an expensive nutri-ent.
Conclusion
The model used to describe the maximum poten-tial for N deposition in birds allows for estimates of the digestible lysine requirements in the diet. The flexibility of the model enables the requirements to be modeled while considering the potential for deposition and the feed intake of the birds within the range of practical per-formance data. The digestible lysine requirements were estimated at 10.6, 9.4, and 9.2 g kg–1 for males and 9.3,
9.7, and 8.5 g kg–1 for females during 6-21 days (period
I), 22-37 days (period II), and 38-53 days (period III), re-spectively.
Acknowledgements
The authors gratefully acknowledge the São Paulo Research Foundation (FAPESP) for the financial support, Ajinomoto Ltd. for the amino acid analysis and the re-searchers of Georg-August University of Goettingen (Germany) for their contributions to this study.
References
Association of Official Analytical Chemists [AOAC]. 2005. Official Methods of Analysis. 18ed. AOAC, Gaithersburg, MD, USA. Baker, D.H. 1986. Problems and pitfalls in animal experiments
Emmert, J.L.; Baker, D.H. 1997. Use of the ideal protein concept for precision formulation of amino acid levels in broiler diets. The Journal of Applied Poultry Research 6: 462-470.
Cobb Vantress. 2008. Cobb Broiler Management Guide. Cobb-Vantress, Siloam Springs, AR, USA.
Cobb Vantress. 2012. Cobb Broiler Management Guide. Cobb-Vantress, Siloam Springs, AR, USA.
Curnow, R.N. 1973. A smooth population response curve based on an abrupt threshold and plateau model for individuals. Biometrics 29: 1-10.
Fisher, C.; Morris, T.R. 1970. The determination of the methionine requirement of laying pullets by a diet dilution technique. British Poultry Science 11: 67-82.
Goulart, C.C.; Costa, F.G.P.; Neto, R.C.L.; Souza, J.G.; Silva, J.H.V.; Givisiez, P.E.N. 2008. Digestible lysine requirements for male broilers from 1 to 42 days old. Revista Brasileira de Zootecnia 37: 876-882 (in Portuguese, with abstract in English). Han, Y.; Baker, D.H. 1994. Digestible lysine requirement of male and female broiler chicks during the period three to six weeks posthatching. Poultry Science 73: 1739-1745.
Leeson, S.; Summers, J.D. 2001. Nutrition of the Chicken. 4ed. University Books, Guelph, Canadá.
Mahdavi, A.; Shivazad, M.; Alemi, F.; Zaghari, M.; Moravej, H.; Darabighane, B. 2012. Digestible lysine requirement of broilers based on practical diet. Italian Journal of Animal Science 11: e13.
Mitchel, H.H. 1924. A method of determining the biological value of protein. The Journal of Biological Chemistry 58: 873-903. Rosa, A.P.; Pesti, G.M.; Edwards Jr, H.M.; Bakalli, R. 2001.
Tryptophan requirements of different broiler genotypes. Poultry Science 80: 1718-1722.
Rostagno, H.S.; Albino, L.F.T.; Donzele, J.L.; Gomes, P.C.; Oliveira, R.F.; Lopes, D.C.; Ferreira, A.S.; Barreto, S.L.T.; Euclides, R.F. 2011. Brazilian Tables for Poultry and Swine: Composition of Feedstuffs and Nutritional Requirements = Tabelas Brasileiras para Aves e Suínos: Composição de Alimentos e Exigências Nutricionais. 3ed. Editora UFV, Viçosa, MG, Brazil (in Portuguese).
Samadi, F.; Liebert, F. 2006. Estimation of nitrogen maintenance requirements and potential for nitrogen deposition in fast-growing chickens depending on age and sex. Poultry Science 85: 1421-1429.
Samadi, F.; Liebert, F. 2007. Lysine requirement of fast growing chickens : effects of age, sex, level of protein deposition and dietary lysine efficiency. The Journal of Poultry Science 44: 63-72.
Samadi, F.; Liebert, F. 2008. Modelling the optimal lysine to threonine ratio in growing chickens depending on age and efficiency of dietary amino acid utilizasation. British Poultry Science 49: 45-54.
Smith, E.R.; Pesti, G.M. 1998. Influence of broiler strain cross and dietary protein on the performance of broilers. Poultry Science 77: 276-281.
Urdanneta-Rincon, M.; Lang, K. ; Pena-Ortega, L.; Leeson, S. 2005. Lysine requirements of young broiler chickens are affected by level of dietary crude protein. Canadian Journal of Animal Science 85: 195-204.
Zaghari, M.; Shivazad, M.; Kamyab, A.; Nikkhah, A. 2002. Digestible lysine requirement of arian male and female broiler chicks during the 6-21 days of age. Journal of Agricultural Science and Technology 4: 111-117.