Charge Dynamics in Electron-Irradiated Polymers
G. M. Sessler andG. M. YangUniversity of Technology, D-64283 Darmstadt, Germany
Received 23 June, 1998
Recent studies of charge trapping and charge transport in polymer lms irradiated and charged with monoenergetic electrons of range smaller than the sample thickness and thereafter stored or annealed under various conditions are discussed. An analytical model used to describe the phenomena takes the following parameters into consideration: Charge and energy deposition proles, charge drift due to a shallow-trap-modulated mobility, deep trapping without release, trap lling due to a nite trap density, and ohmic relaxation due to a radiation-induced conductivity during irradiation and its delayed component after irradiation. The model calculations show the eect of various parameters on the shape of the initial charge distribution and on its evolution with annealing time. - Experiments with the laser-induced pressure-pulse (LIPP) method on 12 and 25mthick uorocarbon and polyimide lms, charged with 10 or 20keV electron beams, respectively, yield the charge distributions after irradiation and the changes of the distributions due to annealing of the samples at 120C for various times. A comparison of experimental and analytical results reveals
the trapping kinetics and permits to estimate the deep-trap density and the -product, where
is the trap-modulated mobility and is the trapping time.
I Introduction
The understanding of charge trapping and charge trans-port in electron-irradiated polymers has greatly bene-tted from the work of Bernhard Gross. In particular, his investigations of the eects of ionizing radiation on such phenomena as charge buildup [1], charge dynamics [2,3], radiation-induced conductivity [4,5], space-charge limited currents [6], and electron transmission [7] are milestones in this eld. The insights gained from these studies have been the foundation for much of the work on charging phenomena in irradiated dielectrics during the last two or three decades.
Interest in electron-irrdiated dielectrics, particularly polymers, was at least in part due to space applications of these materials, for example as thermal blankets for spacecraft, which are exposed to low-energy electrons. Apart from this, electron irradiation experiments allow one to study charge dynamics in the bulk of insulators under conditions where surface eects can often be ne-glected [8].
The work of Gross on charge dynamics in irradiated dielectrics made it particularly desirable to study, with relatively high resolution, the charge distributions in such substances. Appropriate experimental methods, based on acoustic or thermal excitation of the samples,
were developed over the past 10 to 15 years and are now capable of a resolution of about 1 m. Such mea-surements have resulted in a vast amount of data on charge distributions and charge dynamics in thin poly-mer lms and other dielectrics [9]-[11] (and references therein).
In the present paper, charge trapping and charge transport in 12 and 25 m thick uorocarbon (FEP) and polyimide (PI) lms, charged at room temperature with monoenergetic electron beams and annealed there-after, is studied both numerically and experimentally. The results yield information about charge-transport processes in these polymers.
II Simulation of charge
trans-port
II.a Model for charging
Corresponding to the experimental procedure, a two-stage process of charge transport is assumed, con-sisting of a room-temperature charging period and an elevated-temperature annealing period, as shown in Fig. 1.
Thus, the dielectric is electron-beam charged at room temperature from time t = 0 to t = tb.
ing this time, there is considerable charge rearrange-ment due to drift and radiation-induced conductivity (RIC); in addition, there is some deep trapping. Fol-lowing this period, the dielectric is stored fromt =tb to t=t
0 at room temperature to allow for some more charge motion due to drift and the delayed component of the RIC [2, 5] and eventual deep trapping of all charges. Thereafter, the sample is quickly heated to an elevated temperature (120
Cin the experiment) where there is complete detrapping and drift of the charges in their own eld until they are deeply trapped again. As seen in Fig. 1, the sample is kept at the annealing temperature for a time periodta; thereafter, its charge distribution is determined.
Figure 1. Temperature cycle and time scales of the experi-ments.
The charging process, depicted in Fig. 2, and the room-temperature storage can be described by the equation of continuity, the Poisson equation, and the rate equation. These are respectively given by
"
@E(x;t) @t
+[f(x;t)+g(x;t)]E(x;t)+I(x) =I 0
; (1)
"
@E(x;t) @x
=(x;t); (2)
@t(x;t) @t
= f(x;t)
1,
t(x;t) m
: (3)
In these equations, E(x,t) is the electric eld,I 0and I(x) are the current densities of the incident electron beam and the electron beam at depth x in the dielec-tric, respectively, f(x;t) and t(x;t) are the charge densities of mobile and trapped charges, respectively, (x;t) equals f(x;t) +t(x;t); is the shallow-trap-modulated mobility of the mobile charges, g(x;t) and
" are the RIC and the dielectric permittivity, respec-tively, and is the trapping time. In the rate equa-tion (3) it is assumed that the electrons are captured in deep traps of densitym and no release is possible. The use of Eqs. (1) to (3) for analyzing the charging pro-cess and the proper choice of parameters, including the radiation-induced conductivity, have been discussed in detail in [10].
Figure 2. Open-circuit electron-beam charging of dielec-tric.
II.b Model for annealing
In the case of fast retrapping during annealing, as encountered in FEP at 120
C(see below), charge trans-port can also be explained with Eqs. (1) to (3) by set-tingI
0and
I(x) equal to zero. Now, the charge trapped in the dielectric at room temperature is assumed to be detrapped at the elevated temperature and to undergo drift and a second deep-trapping process with values of the constants ;;g ;; and m possibly dierent from those prevailing at room temperature, as discussed in Sect. II.c.
For slow retrapping during annealing, as found in PI at 120
C (see below), a very simple model assum-ing gradual release of the trapped charges at the ele-vated temperature and subsequent drift to the sample electrode may be used. Since the number of released charges is proportional to the charge density (x;t), and the released charges remain in the sample for a negligible time, one has after the annealing timeta
(x;t) =(x;t 0)
e ,t
a= 0
for tt 0+
ta: (4) where
II.c Results of model calculations
The charge distribution at t = t0 is obtained by numerical evaluation of Eqs. (1) to (3) for the following parameters: Electron-beam current density I0 = 2 nA=cm
2; t
b = 50 s; t0 = 700 s, in all cases and electron-beam voltage 10 keV; = 2 10,11cm2=V;
m= 0:004 C=cm3for FEP and electron-beam voltage 20 keV; = 210
,10 cm2=V; m = 0:008 C=cm3 for PI, respectively. The -values are assumed to be valid at room temperature. Other quan-tities used in these calculations are given in [10].
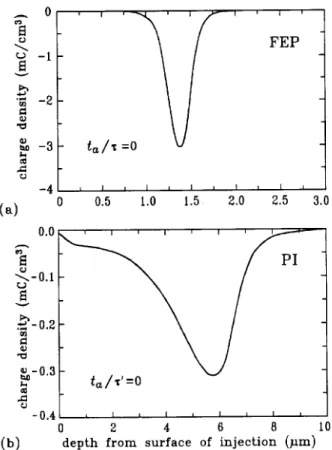
Figure 3. Distribution of total charge (equal to trapped charget) att0= 700sin FEP (part a) and PI (part b)
af-ter room temperature charging. Electron injection at depth 0m, electrode at 12m(FEP) or 25m(PI).
The distributions so obtained are depicted in Figs. 3a and 3b. They consist only of deeply-trapped charges, such that = t, since after the (long) time t0all the originally mobile carriers are deeply trapped. For the -values used, the shape of the distributions is mainly determined by the RIC and its delayed component and to a lesser extent by mobility. The distributions are therefore more or less limited to the irradiated volume of the samples [10]. These distributions are used as
the initial data for the simulation of charge transport during the annealing period.
For fast retrapping (FEP) the evolution of (x;t) during annealing is again calculated with Eqs. (1) to (3), as discussed above. In using these equations for de-scribing charge dynamics at the annealing temperature, the distribution shown in Fig. 3a is used as the initial distribution and appropriate values of ;;g;;andm are substituted as follows.
While the dielectric permitivity of FEP remains at 2.1 betwen 20 and 120C, the delayed RIC decays by about two orders of magnitude during the storage time t0
,tb and can therefore be neglected during the an-nealing cycle. The deep-trap density is not expected to be temperature dependent, thus the above value of m is used. However, the temperature dependence of and has to be considered. Since the solutions depend mainly on the -product, this parameter is adjusted for best t with the experimental results.
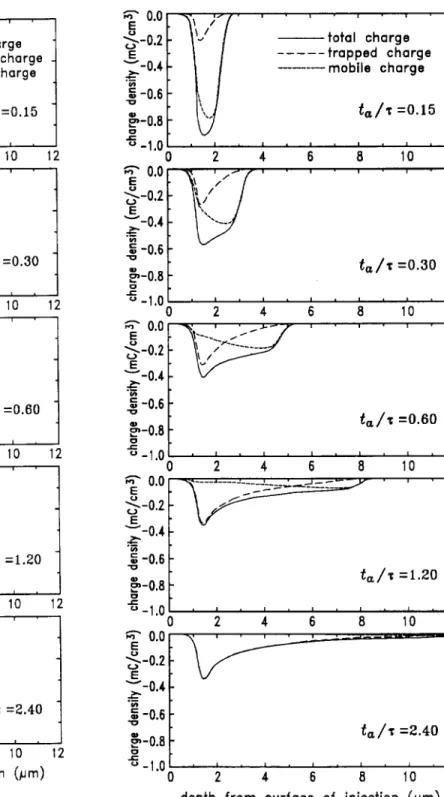
Charge distributions so obtained are shown in Figs. 4 and 5. They were calculated with the values = 510
,10cm2=V and = 10,9 cm2=V; respectively. Parameter in these gures is the normalized annealing time ta=. As seen from these plots, the deeply-trapped charge is accumulating near the location of the initial charge, while the mobile charge has a peak near the progressing charge front in the nonirradiated volume. Of interest for comparison with experimental results is the total charge (x;t), i. e. the sum of trapped and mobile charge.
Figure 4. Evolution of total charge , deeply-trapped charge t, and mobile charge f during annealing under
fast retrapping conditions: Results of model calculation for
= 510
,10 cm2=V:
Figure 5. Evolution of total charge , deeply-trapped charge t, and mobile charge f during annealing under
fast retrapping conditions: Results of model calculation for
Figure 6. Evolution of total chargeduring annealing under slow retrapping conditions: Results of model calculation.
III Experimental results
Teon (FEP) samples of 12 m tickness and Kapton (PI) samples of 25 m thickness, metalized with alu-minum on one side, are charged in vacuum through their nonmetalized surface with 10 keV or 20 keV monoenergetic electron beams, respectively, of current density 2 nA=cm2 to a charge density of 100 nC=cm2. Following the charging process, the samples are re-moved from vacuum. After room-temperature storage (typically about 10 minutes), the samples are annealed at 120C for time periods of a few minutes to a few hours. During charging and annealing, the samples are, due to the absence of a front electrode, in open circuit. The laser-induced pressure-pulse (LIPP) method is used to measure the charge distribution in the sam-ples. In these experiments, short (70 ps) and energetic (1 to 10 mJ) laser pulses from a mode-locked Nd:YAG laser are absorbed in a graphite layer deposited onto the sample electrode. The resulting stress eects generate a pressure pulse. This pulse propagates through the sam-ple with the velocity of sound c and generates a current I(t) in the measuring circuit which is proportional to the charge density at depth x = ct in the dielectric. Details of the LIPP method are given in [12, 13].
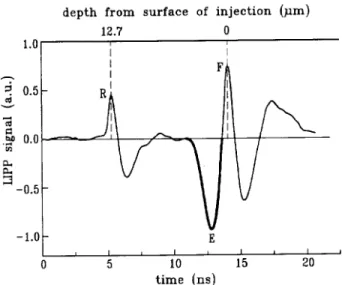
A typical LIPP-response for FEP is shown in Fig. 7. It consists of a negative peak E due to the injected elec-tron charge as well as positive peaks R and F caused by the induction charge on the electrode and by a positive surface charge due to secondary emission, respectively.
Figure 7. LIPP response for FEP, charged with 10 keV
electron beam, directly after charging. Electron injection through the nonmetalized front side F of the sample. Charge layer at E. Laser pulse absorbed at rear electrode R, where the laser-induced pressure pulse is generated.
From such responses, obtained for dierent anneal-ing periods, the sections containanneal-ing the space-charge peak (part E of the response, depicted as a heavy line) are extracted and plotted in Fig. 8. Note the opposite direction of the depth scale in Figs. 7 and 8, neces-sitated by the fact that electron injection and LIPP generation occur on opposite sample surfaces.
Figure 8. Change of the charge distribution in FEP sample after dierent annealing periods. Sample originally charged with 10 keV electron beam through front side at 0 m. Electrode at 12.7m.
responses depends on the energy of the laser pulses which varies somewhat from pulse to pulse.
Figure 9. Decay of surface potential of Teon FEP as func-tion of annealing time at 120C. Sample originally charged
with 10keV electron beam.
Figure 8 indicates that in FEP the charge motion at 120C results in a broadening of the charge peak. The broadening is in the direction toward the electrode. This fact, together with the observation that the sur-face potential decays only slightly ( 30 % for 2000 min annealing) strongly suggests that the charge decay is caused by fast retrapping of the electrons activated from the original charge layer. Similar conclusions have been reached for negative charge transport in FEP be-fore [14]-[17]. However, a datailed picture of the evo-lution of the charge distribution, as seen in Fig. 8, had not been obtained yet. The Schubweg is estimated from Fig. 8 to be about 5 m or less (see Sect. IV).
The \smearing-out" of the charge layer toward the electrode is responsible for most of the observed sur-face potential decay shown in Fig. 9. It is possible that a small part of the decay is due to hole drift to the charge layer; however, this process is believed to be mi-nor since it would not result in a broadening of the negative charge layer. Instead it would, in the absence of hole injection through the electrode [18], cause a neg-ative depletion layer in the entire region between elec-trode and charge layer, which is not observed. Thus, the predominant transport process in FEP consists in ac-tivation and fast retrapping of the originally-deposited charges.
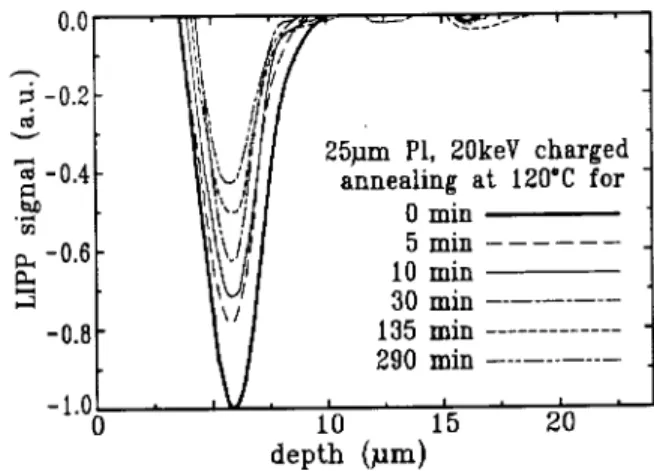
The experimental results for PI are shown in Fig. 10. The gure indicates that there is no charge accumula-tion between the original charge layer and the electrode as the charge decays. The charge peak, although
chang-ing its amplitude, does not broaden or smear out. On the contrary, it appears to narrow down during anneal-ing. Thus, the charge decay must be caused by one of the following processes: (1) Detrapping of the electron-beam deposited charge and drift in the internal eld to the electrode without deep retrapping, or (2) compen-sation of the electron-beam deposited charge by holes either injected through the electrode and drifting in the internal eld without deep trapping or coming from the free surface which is positively charged due to sec-ondary emission. The fact that the layer narrows with annealing time indicates that the second mechanism is at least partially responsible for the decay. In both cases, the charge drift is characterized by slow retrap-ping with electron or hole Schubwegs of about 20 m or more. Compensation of the original charge by in-trinsicholes is ruled out since this process would result in a negative space charge in the region which supplies the holes. A similar compensation of electron-beam de-posited charges in PI by positive carriers, resulting also in a narrowing of the charge distribution, was even ob-served at room temperature [19].
Figure 10. Change of the charge distribution in PI sample after dierent annealing periods. Sample originally charged with 20 keV electron beam through front side at 0 m. Electrode at 2/5m.
IV Comparison with model
cal-culations and discussion
well if at 120C is chosen in the region of 0:5 to 110
,9 cm2=V with
100 min. For these values, a Schubweg of s = E of 2:5 to 5 m is expected for E = 0:510
6 V=cm (this E-value corresponds to the injected charge density of 10,7 C=cm2). A Schub-weg of a few m is consistent with the results in Fig. 8. The original location of the charge peak is at 1:7 m, as compared to the predicted location at 1:4 m, and the observed and calculated nal distributions extend beyond 8 m.
For very large annealing times of the FEP sam-ples, the assumption of deep trapping without release should be somewhat modied. Eventual detrapping and retrapping of the deeply trapped charge explains the slight decrease in peak amplitude and the slow \mo-tion" of the peak toward the electrode observed at an-nealing times of 1000 and 2200 min and not expected from the theoretical results in Figs. 4 and 5.
The value of used above may be compared with elevated-temperature results obtained by other au-thors for FEP. TSC measurements at 150C to 200C yielded values of about and 10,9 cm2=V [20,21] while isothermal charge-decay experiments at 145C gave 610
,9 cm2=V [14]. The -value following from the present evaluation is thus in reasonable agreement with older data.
For PI, the experimental results in Fig. 10 also com-pare favorably with the analytical data in Fig. 6. In particular, the measured and calculated peak locations are both at 5:7 m and the observed charge penetration of about 10 m is well reproduced by theory. The ma-jor dierence is the absence of negative charge close to the free surface in the experimental data. This may be due to compensation by positive surface charges gen-erated by secondary emission during charging. These positive charges are not considered in the model calcu-lations. The contraction of the charge layer appears to be due to charge compensation by holes, as discussed above, which is also not included in the model.
Since the charge carriers are subject to slow retrap-ping in PI at 120C, the -product at this tempera-ture can not be determined; however, a lower limit of 610
,9 cm2=V follows from an estimate of the mini-mumSchubweg (20 m; see above) and the electric eld in the sample. To the knowledge of the authors, no -data for this material is available in the literature for
temperatures around 120C.
The application of analytical models to measured distribution data is a potentially powerful method for nding the mechanisms underlying charge transport in polymers. The present study is only a rst step in this direction. More rened models taking into considera-tion other phenomena aecting carrier drift and addi-tional measurements will lead to a better understanding of charge transport in disordered systems.
Acknowledgment
The authors are grateful to Dr. Tilman Motz for main-taining the laser and electron-beam systems used in the experiments.
References
[1] B. Gross, J. Dow, and S. V. Nablo, "Charge buildup in electron-irradiated dielectrics", J. Appl. Phys. 44,
2459-2463 (1973).
[2] B. Gross, G. M. Sessler, and J. E. West, "Charge dy-namics in electron-irradiated polymer-foil electrets", J. Appl. Phys.45, 2841-2851 (1974).
[3] B. Gross, and G. F. Leal Ferreira, "Analytic solution for radiation-induced charging and discharging of di-electrics", J. Appl. Phys.50, 1506-1511 (1979).
[4] B. Gross, H. von Seggern, and D. A. Berkley, "Long term behavior of radiation-induced currents in uori-nated ethylene propylene copolymer", phys. stat. sol. (a)79, 607-615 (1983).
[5] B. Gross, R. M. Faria, and G. F. Leal Ferreira, "Radiation-induced conductivity in Teon irradiated by x rays", J. Appl. Phys.52, 571-577 (1981).
[6] B. Gross and L. Nunes de Oliveira, "Transport of ex-cess charge in electron-irradiated dielectrics", J. Appl. Phys.45, 4724-4729 (1975).
[7] B. Gross, R. Gerhard-Multhaupt, K. Labonte, and A. Berraissoul, "Current transmission and charge depo-sition in polyethyleneterephtalate (PETP) irradiated with 10 - 50 keV electrons", Colloid and Polymer Sci.
262, 93-98 (1984).
[8] B. Gross, "Radiation-Induced Charge Storage and Po-larization Eects", in "Electrets" (G. M. Sessler, Ed.), 2nd Edition 1987, pp. 217-284.
[9] G. M. Sessler,"Charge Distribution and Transport in Polymers", IEEE Trans. Diel. and Electric. Insulat.4,
614 - 628 (1997).
[10] G. M. Sessler,"Charge Dynamics in Irradiated Poly-mers", IEEE Trans. Electric. Insulat. 27, 961-973
[11] G. M. Yang and G. M. Sessler, "Charge Distributions in Electron-Beam Irradiated Kapton PI and Teon FEP Films", Proceed. 8th Internat. Sympos. Electrets (IEEE, Piscataway, N.J., 1994), 248-253.
[12] G. M. Sessler, J. E. West, R. Gerhard-Multhaupt, and H. von Seggern, "Nondestructive Laser Method for Measuring Charge Proles in Irradiated Polymer Films", IEEE Trans. Nucl. Sci. NS-29, 1644-1649
(1982).
[13] R. Gerhard-Multhaupt, "Analysis of Pressure-Wave Methods for the Nondestructive Determination of Spa-tial Charge or Field Distributions in Dielectrics", Phys. Rev. B,27, 2494-2503 (1983).
[14] H. von Seggern, "A New Model of Isothermal Charge Transport for Negatively Corona-Charged Teon", J. Appl Phys.50, 7039-7043 (1979).
[15] C. Alquie, F. Chapeau, and J. Lewiner "Evolution of Charge Distributions in F.E.P.-Films Analysed by the Laser Induced Acoustic Pulse Method" in 1984 An-nual Report, Conference on Electrical Insulation and Dielectric Phenomena (IEEE, 1984), pp. 488-494. [16] R. Gerhard-Multhaupt, W. Kunstler, G. Eberle, W.
Eisenmenger, and G. Yang, \High space-charge densi-ties in the bulk of uoropolymer electrets detected with
piezoelectrically generated pressure steps" in Space Charge in Solid Dielectrics; Edited by J. C. Fothergill and L. A. Dissado (The Dielectrics Society, 1998) pp. 123-132.
[17] O. N. Oliveira and G. F. Leal Ferreira, \Electron Trans-port in Corona Charged 12mTeon FEP with Sat-urable Deep Traps", Appl. Phys.A42, 213 (1987).
[18] G. F. Leal Ferreira and M. T. Figueiredo, "Corona Charging of Electrets", IEEE Trans. Electric. Insulat.
27, 719 (1992).
[19] M.-P. Cals, J.-P. Marque, and C. Alquie, \Direct Ob-servation of Space Charge Evolution in e-irradiated Kapton Films", IEEE Trans. Electric. Insulat.27, 763
(1992).
[20] R. A. Creswell, M. M. Perlman, and M. A. Kabayama, \ The Electret Properties of a Series of Corona-Charged Substituted Polyolens", inDielectric Proper-ties of Polymers, (Plenum, New York, 1972), 295-312. [21] H. von Seggern, \Thermally Stimulated Decay of