Analysis of 31 STR loci in the genetic isolate of Carloforte (Sardinia, Italy)
Renato Robledo
1, Ignazio Piras
2, William Beggs
3and Carla Calò
21
Dipartimento di Scienze e Tecnologie Biomediche, Università di Cagliari, Monserrato, Cagliari, Italy.
2Dipartimento di Biologia Sperimentale, Università di Cagliari, Monserrato, Cagliari, Italy.
3
Department of Molecular Biology, Coriell Institute for Medical Research, Camden, New Jersey, U.S.A.
Abstract
The genotypes of 31 autosomal short tandem repeat loci in the population of Carloforte were analyzed, these repre-senting a linguistic and genetic isolate located on the island of Sardinia (Italy). The markers span the entire length of chromosomes 19, 20, 21 and 22. Allele frequencies and statistical parameters were presented for all loci. Observed heterozygosity ranged from 0.279 to 0.884, and polymorphism information content from 0.552 to 0.886. All but two loci showed Hardy-Weinberg equilibrium after Bonferroni correction. The 31 short tandem repeat loci examined in the present work provide additional data on the genetic structure of the Carloforte population.
Key words:autosomal STRs, population data, genotyping, Carloforte, Sardinia. Received: November 25, 2008; Accepted: March 11, 2009.
Carloforte is the only village located on the small is-land of San Pietro, off the southwestern coast of Sardinia. The history of the Carloforte population dates back to the 16thcentury, when a number of families emigrated from Pegli, a small village in Liguria (Italy), now part of the city of Genova, to Tabarka, an island off the coast of Tunisia. During their time in Tabarka, a period of about two centu-ries, the Pegli community developed a successful business in tuna and coral fishing. At the beginning of the 18th cen-tury, due to a decline in business and worsening relation-ship with the Bey of Tunis and Algiers, the community migrated to Sardinia and settled on the deserted island of San Pietro, where they founded Carloforte in 1738 (Valle-bona, 1974). For about 10 generations, these Genovese mi-grants had very little contact with the mainland populations of both Tunisia and Sardinia, maintaining a separate cul-tural as well as genetic identity. The culcul-tural aspect is evi-dent in the Pegli dialect, which is still spoken nowadays, making the Carloforte population a linguistic isolate (Vona et al., 1996). Earlier studies based on matrimonial struc-ture, classical genetic markers and the incidence of a spe-cific disease provided evidence that Carloforte is also a genetic isolate (Vonaet al., 1996; Heathet al., 2001). In this paper, we present further data on the genetic structure of the Carloforte population by reporting on the distribution of 31 micro-satellite DNA loci. The markers employed were CA di-nucleotide repeats clustered in four linkage groups, representing chromosomes 19, 20, 21 and 22.
Historical documents list the names of the first set-tlers. Individuals selected for the present study were proven to be descendants of the village founders. Moreover, the participants were chosen for not having ancestors in com-mon, at least up to the grandparental generation. Both crite-ria were ascertained by a complete genealogical search through the detailed family information available from City Hall records (Siniscalcoet al., 1999; Heathet al., 2001).
About 10 mL of peripheral blood were collected from 50 voluntary participants, in vacuum tubes containing EDTA as anticoagulant. Permanent cultures of EBV-trans-formed B-lymphocytes were prepared and stored anony-mously in the Coriell Repository. DNA was extracted by standard laboratory procedures. The study was approved by local ethics committees and all voluntary participants read and signed an informed consent form, in accordance with Declaration of Helsinki guidelines.
Individuals were genotyped using the ABI Prism Linkage Mapping Panel, version 2. The markers were am-plified as single reactions and products pooled for analy-sis. About 50 ng of genomic DNA were amplified in a final PCR volume of 15 mL containing 1.5 mL 10x
GeneAmp PCR buffer II, 1.5mL 25 mM MgCl2, 1.5mL
2.5 mM dNTP mix, 1.0 mL Primer Mix and 0.12 mL
AmpliTaq Gold DNA Polymerase, with an ABI GeneAmp PCR System 9700 Thermal Cycler. PCR reac-tions were amplified by using the following PCR condi-tions: a 12 min hold at 95 °C was followed by 10 cycles of 15 s at 94 °C, 15 s at 55 °C, 30 s at 72 °C and 20 additional cycles of 15 s at 89 °C, 15 s at 55 °C and 30 s at 72 °C, with a final extension of 10 min at 72 °C.
www.sbg.org.br
Send correspondence to Renato Robledo. Dipartimento di Scienze e Tecnologie Biomediche, SS 554 km 4,500, Università di Cagliari, 09042 Monserrato, Cagliari, Italy. E-mail: [email protected].
The amplified PCR products were pooled at a ratio of 5mL of each FAM labeled product and 10mL of each HEX
and NED labeled one. D.I. water was added to a final vol-ume of 100 ul. The pooled PCR product was mixed with loading buffer at a 2:3 ratio for a 5mL final volume (loading
buffer contained 4.5mL formamide, 1.0mL blue dextran
and 1.5mL of S400HD-ROX as an internal size standard).
The mixture was heated at 95 °C for 3 min and cooled on ice for 3 min, before being separated on an ABI 377 Se-quencer, using a 36 cm denaturing polyacrylamide gel for resolution of di-nucleotide repeat products. Separated al-lele fragments were analyzed using ABI GeneScan and Genotyper software and genotypes scored.
Allele frequencies were estimated by gene counting. Both observed and expected heterozygosity were calcu-lated with the GENETIX program (v. 4.0). Deviation from Hardy-Weinberg equilibrium (HWE) was tested by the Markov chain, using the GENEPOP program (v. 4.0). Sta-tistical parameters of population genetics and forensic in-terest, namely polymorphism information content (PIC), power of discrimination (PD), and power of exclusion (PE), were calculated using Power Stats package v. 1.2 (Promega Corporation, USA).
To verify whether the population had incurred a re-cent bottleneck, data were analysed using the BOTTLENECK program, v 1.2 (Cornuet and Luikart, 1996). This program allows for the evaluation of observed and expected heterozygosity, and determines statistical dif-ference based on equilibrium mutation/genetic drift. This was obtained through simulating the coalescent process of ngenes under the two-phase mutation model (TPM), which was proved to better fit micro-satellite analysis (Di Rienzo et al., 1994). The TPM mainly consists of one-step muta-tions, with a small percentage (5%-10%) of multi-step changes.
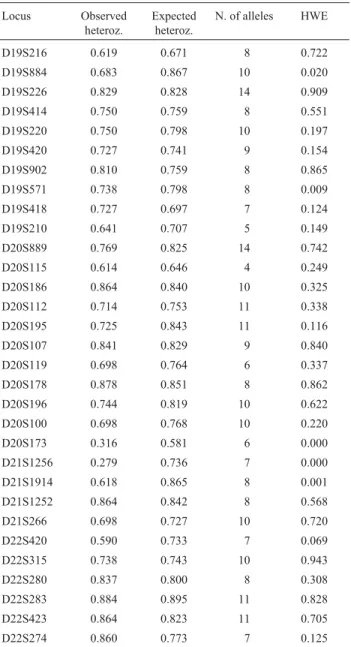
Allelic frequencies of the 31 STR loci tested in the population of Carloforte are reported in Table S1. Hardy-Weinberg equilibrium (HWE) and population pa-rameters are shown in Table 1.
The 31 loci showed a high degree of heterozygosity, varying from 27.9% for marker D21S1256 to 88.4% for marker D22S283. The exact test based on Markov chain analysis revealed that 6 out of 31 markers did not meet Hardy-Weinberg equilibrium, whereas after Bonferroni correction, only two of these, D20S173 and D21S1256, showed an excess of observed homozygotes. The high de-gree of isolation of the Carloforte population, together with the reported deviation from Hardy Weinberg expectation, prompted us to verify the possibility of a recent bottleneck in Carloforte through the BOTTLENECK program. Under the assumption of the two-phase model of mutation (TMP), the Wilcoxon test revealed non-significant heterozygosity (p = 0.459), thereby indicating that, following initial colo-nization events, there were no further contractions in the size of the Carloforte population, this being in agreement
with historical records. Moreover, the mode shape test showed an L-shaped distribution, which is also consistent with the absence of a recent bottleneck (data not shown).
The high level of heterozygosity in a genetic isolate like Carloforte, with a long history of endogamous and con-sanguineous marriages, may at first be surprising. We be-lieve that the sampling strategy accounts for the findings: differences among individuals were maximized by select-ing participants with no ancestor in common, at least up to the grandparental generation. This could be very important in association studies, where it is necessary to analyze large numbers of individuals in order to detect statistically signif-icant deviations in allelic distribution between cases and matched controls. In a previous study, on applying the sam-pling strategy as described above, we genotyped 55
indi-Robledo et al. 463
Table 1- Heterozygosity, number of alleles detected and HWE evaluation
(indicated as probability values) of 31 investigated markers in the Carloforte population.
Locus Observed
heteroz.
Expected heteroz.
N. of alleles HWE
D19S216 0.619 0.671 8 0.722
D19S884 0.683 0.867 10 0.020
D19S226 0.829 0.828 14 0.909
D19S414 0.750 0.759 8 0.551
D19S220 0.750 0.798 10 0.197
D19S420 0.727 0.741 9 0.154
D19S902 0.810 0.759 8 0.865
D19S571 0.738 0.798 8 0.009
D19S418 0.727 0.697 7 0.124
D19S210 0.641 0.707 5 0.149
D20S889 0.769 0.825 14 0.742
D20S115 0.614 0.646 4 0.249
D20S186 0.864 0.840 10 0.325
D20S112 0.714 0.753 11 0.338
D20S195 0.725 0.843 11 0.116
D20S107 0.841 0.829 9 0.840
D20S119 0.698 0.764 6 0.337
D20S178 0.878 0.851 8 0.862
D20S196 0.744 0.819 10 0.622
D20S100 0.698 0.768 10 0.220
D20S173 0.316 0.581 6 0.000
D21S1256 0.279 0.736 7 0.000
D21S1914 0.618 0.865 8 0.001
D21S1252 0.864 0.842 8 0.568
D21S266 0.698 0.727 10 0.720
D22S420 0.590 0.733 7 0.069
D22S315 0.738 0.743 10 0.943
D22S280 0.837 0.800 8 0.308
D22S283 0.884 0.895 11 0.828
D22S423 0.864 0.823 11 0.705
viduals from the Carloforte population at 5 unlinked micro-satellite loci in order to obtain an accurate descrip-tion of their genomic profile. We showed that allele fre-quencies at all loci were practically the same down to a subset of 20 individuals (Siniscalcoet al., 1999). There-fore, once a breeding unit is identified through the record-ing of marriage patterns over the last five generations, a small sampling of contemporary descendants is still repre-sentative of its founder group, provided that the individuals selected had their ancestors all born in the same breeding unit, but unrelated for, at least, the last two generations. An obvious consequence of the proposed sampling strategy is a reduction in the cost of association studies, due to a lower number of individuals having to be genotyped.
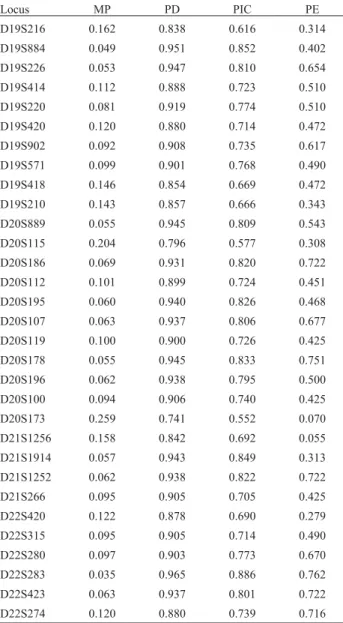
Finally, Table 2 shows parameters of forensic inter-est. The combined power of both discrimination and
exclu-sion were absolutely discriminating, their values being, respectively, 7.7 x 10⁻³³and 0.999999999918. It has been reported that genetic isolation could reduce the capacity for paternity exclusion, without significantly affecting the power of discrimination (de Pancorboet al., 2000). This could be a critical issue in forensics, for example when set-ting up a database from a small village or population. In our case, the power of exclusion was still very high, again prob-ably as a result of the sampling strategy. The combined matching probability for the 31 STRs was 0.9999999999923. Therefore, the 31 STR loci examined in the present work, specifically designed for population ge-netics studies, also turned out to be suitable for general fo-rensic applications.
Acknowledgments
We thank all the participants who made this study possible. We are also thankful to Mary Ann Groeneweg for revising the manuscript and to Ernesto D’Aloja, Roberto Mezzanotte and Giuseppe Vona for helpful discussions and criticism. This work was supported by grants from the Coriell Institute for Medical Research and from the Italian Ministry of Research, MIUR (funds ex 60% to R.R. and C.C.).
References
Cornuet JM and Luikart G (1996) Description and power analysis of two tests for detecting recent bottlenecks from allele fre-quency data. Genetics 144:2001-2014.
de Pancorbo M, Cuevas N, Bujan M, Martinez-Bouzas C, Alvarez-Alvarez M, Rodriguez-Tojo M, Sanchez P and Leiva F (2000) Micro-satellite DNA and forensic parame-ters in isolated populations. Progr Forensic Genet 8:181-183.
Di Rienzo A, Peterson AC, Garza JC, Valdes AM and Freimer NB (1994) Mutational processes of simple-sequence repeat loci in human populations. Proc Natl Acad Sci USA 91:3166-3170.
Heath S, Robledo R, Beggs W, Feola G, Parodo C, Rinaldi A, Contu L, Dana D, Stambolian D and Siniscalco M (2001) A novel approach to search for Identity by Descent in small samplings of patients and controls from the same Mendelian Breeding Unit. A pilot study on miopia. Hum Hered 52:183-190.
Siniscalco M, Robledo R, Bender P, Carcassi C, Contu L and Beck J (1999) Population genomics in Sardinia: A novel ap-proach to hunt for genomic combinations underlying com-plex traits and diseases. Cytogenet Cell Genet 86:148-152 and 87:296.
Vallebona G (1974) Storia di una Colonizzazione. Edizioni Della Torre, Cagliari, 178 pp.
Vona G, Calò CM, Lucia G, Mameli GE, Succa V, Esteban E and Moral P (1996) Genetics, geography, and culture: The popu-lation of S. Pietro Island (Sardinia, Italy). Am J Phys Anthropol 100:461-471.
Table 2- Statistical relevant data for 31 investigated markers in the
Carloforte population. MP: matching probability, PD: power of discrimi-nation, PIC: polymorphism information content, PE: power of exclusion.
Locus MP PD PIC PE
D19S216 0.162 0.838 0.616 0.314
D19S884 0.049 0.951 0.852 0.402
D19S226 0.053 0.947 0.810 0.654
D19S414 0.112 0.888 0.723 0.510
D19S220 0.081 0.919 0.774 0.510
D19S420 0.120 0.880 0.714 0.472
D19S902 0.092 0.908 0.735 0.617
D19S571 0.099 0.901 0.768 0.490
D19S418 0.146 0.854 0.669 0.472
D19S210 0.143 0.857 0.666 0.343
D20S889 0.055 0.945 0.809 0.543
D20S115 0.204 0.796 0.577 0.308
D20S186 0.069 0.931 0.820 0.722
D20S112 0.101 0.899 0.724 0.451
D20S195 0.060 0.940 0.826 0.468
D20S107 0.063 0.937 0.806 0.677
D20S119 0.100 0.900 0.726 0.425
D20S178 0.055 0.945 0.833 0.751
D20S196 0.062 0.938 0.795 0.500
D20S100 0.094 0.906 0.740 0.425
D20S173 0.259 0.741 0.552 0.070
D21S1256 0.158 0.842 0.692 0.055
D21S1914 0.057 0.943 0.849 0.313
D21S1252 0.062 0.938 0.822 0.722
D21S266 0.095 0.905 0.705 0.425
D22S420 0.122 0.878 0.690 0.279
D22S315 0.095 0.905 0.714 0.490
D22S280 0.097 0.903 0.773 0.670
D22S283 0.035 0.965 0.886 0.762
D22S423 0.063 0.937 0.801 0.722
Supplementary Material
The following online material is available for this ar-ticle:
Table S1: Allele frequencies of the 31 STR loci in the population of Carloforte
This material is available as part of the online article from http://www.scielo.br/gmb.
Associate Editor: Francisco Mauro Salzano
License information: This is an open-access article distributed under the terms of the Creative Commons Attribution License, which permits unrestricted use, distribution, and reproduction in any medium, provided the original work is properly cited.
Locus Frequency
D19S216
258 0.012
260 0.095
262 0.012
266 0.452
268 0.060
270 0.024
272 0.333
274 0.012
D19S884
95 0.085
99 0.049
101 0.183
103 0.073
105 0.037
107 0.134
109 0.073
111 0.195
113 0.024
115 0.146
D19S226
237 0.024
239 0.012
241 0.317
243 0.061
245 0.037
247 0.195
249 0.012
251 0.122
253 0.098
255 0.037
257 0.037
259 0.012
261 0.024
265 0.012
D19S414
170 0.341
172 0.011
184 0.046
186 0.102
188 0.125
190 0.307
192 0.046
194 0.023
D19S220
268 0.046
272 0.011
274 0.034
278 0.023
280 0.341
282 0.227
284 0.102
286 0.114
288 0.023
290 0.080
D19S420
94 0.023
98 0.023
102 0.046
104 0.057
108 0.171
110 0.443
112 0.136
114 0.091
120 0.011
D19S902
241 0.119
245 0.095
247 0.012
251 0.429
253 0.119
255 0.119
257 0.060
259 0.048
D19S571
288 0.202
308 0.012
310 0.179
312 0.214
314 0.274
316 0.083
318 0.024
324 0.012
D19S418
90 0.091
92 0.034
94 0.500
96 0.102
98 0.148
100 0.102
104 0.023
179 0.115
181 0.244
183 0.449
187 0.090
189 0.103
D20S889
93 0.026
95 0.180
97 0.026
99 0.013
101 0.333
103 0.090
105 0.026
107 0.051
109 0.115
111 0.039
113 0.026
115 0.013
117 0.051
119 0.013
D20S115
238 0.011
240 0.261
242 0.466
244 0.261
D20S186
119 0.136
125 0.125
127 0.011
129 0.034
131 0.216
133 0.023
135 0.239
137 0.125
139 0.023
141 0.068
D20S112
211 0.048
215 0.095
219 0.024
223 0.024
225 0.417
227 0.191
229 0.155
231 0.012
233 0.012
235 0.012
237 0.012
D20S195
131 0.038
139 0.188
141 0.025
143 0.050
145 0.263
147 0.075
149 0.163
151 0.013
153 0.075
155 0.100
161 0.013
D20S107
202 0.011
208 0.193
210 0.034
212 0.205
214 0.125
216 0.239
218 0.125
220 0.046
222 0.023
D20S119
109 0.012
113 0.163
115 0.058
117 0.256
121 0.186
123 0.326
D20S178
182 0.134
184 0.110
186 0.183
188 0.049
190 0.195
192 0.183
194 0.098
196 0.049
D20S196
265 0.198
273 0.012
277 0.023
279 0.035
285 0.047
287 0.151
295 0.023
D20S100
217 0.035
219 0.012
223 0.198
225 0.395
227 0.151
229 0.012
231 0.081
233 0.023
235 0.070
239 0.023
D20S173
129 0.145
173 0.079
175 0.066
177 0.618
179 0.066
183 0.026
D21S1256
107 0.163
109 0.349
111 0.093
113 0.023
115 0.326
117 0.023
121 0.023
D21S1914
264 0.103
266 0.132
268 0.132
270 0.177
272 0.162
274 0.147
276 0.074
278 0.074
D21S1252
148 0.011
150 0.171
156 0.205
158 0.182
162 0.046
164 0.148
166 0.091
168 0.148
D21S266
163 0.477
165 0.047
167 0.035
171 0.035
175 0.047
177 0.047
179 0.012
181 0.058
D22S420
154 0.103
156 0.013
158 0.333
160 0.346
162 0.154
164 0.026
168 0.026
D22S315
178 0.024
184 0.024
186 0.012
190 0.012
196 0.083
198 0.095
200 0.429
202 0.226
204 0.048
206 0.048
D22S280
214 0.105
216 0.163
218 0.105
220 0.221
222 0.314
224 0.023
226 0.058
228 0.012
D22S283
139 0.105
141 0.105
143 0.151
145 0.128
147 0.047
149 0.116
151 0.081
153 0.070
157 0.070
161 0.023
D22S423
288 0.023
294 0.023
296 0.273
298 0.148
300 0.023
302 0.080
304 0.057
306 0.034
308 0.250
310 0.080
316 0.011
D22S274
284 0.047
286 0.291
288 0.302
290 0.035
292 0.174
294 0.128