Rev. Caatinga
GENETIC PARAMETER ESTIMATES FOR PRODUCTION AND
REPRODUCTION TRAITS IN DAIRY BUFFALOES
1CAMILA DA COSTA BARROS2*, RÚSBEL RAUL ASPILCUETA-BORQUIS3,
ANGELINA BOSSI FRAGA4, HUMBERTO TONHATI2
ABSTRACT - The objective of this study was to determine the genetic variation in milk production, milk components, and reproductive traits in dairy buffaloes. A total of 9,318 lactation records from 3,061 cows were used to estimate the heritability of milk yield (MY), fat percentage (%F), protein percentage (%P), lactation length (LL), calving interval (CI), and age at first calving (AFC), as well as genetic and phenotypic correlations between these traits. Covariance components were estimated by Bayesian inference in a multitrait animal model using the GIBBS2F90 program. Contemporary groups and number of milkings (1 or 2) were included as fixed effects, age of dam at calving (linear and quadratic effects) as a covariate, and additive genetic, permanent environmental, and residual effects as random effects. The heritability estimates (± standard deviation) were 0.24 ± 0.02, 0.34 ± 0.05, 0.40 ± 0.05, 0.09 ± 0.01, 0.05 ± 0.01, and 0.16 ± 0.04 for MY, %F, %P, LL, CI, and AFC, respectively. The genetic correlations between MY and %F, %P, LL, CI, and AFC were -0.29, -0.18, 0.66, 0.08, and 0.24, respectively. Milk production and milk components showed sufficient genetic variation to obtain genetic gains through selection. The genetic correlations between MY and milk components were negative, and thus, undesirable because efforts to increase MY may decrease milk quality. Reproductive traits had little genetic influence, indicating that improvement of management would be sufficient to obtain better performance.
Keywords: Buffalo. Genetic correlation. Heritability. Milk yield.
ESTIMATIVAS DE PARÂMETROS GENÉTICOS PARA CARACTERÍSTICAS DE PRODUÇÃO E REPRODUÇÃO EM BÚFALOS LEITEIROS
RESUMO – Objetivou-se determinar a variação genética na produção de leite, seus constituintes e características reprodutivas. Foram utilizadas 9.318 lactações de 3.061 búfalas para estimar as herdabilidades das características produção de leite (PL), porcentagem de gordura (%G), porcentagem de proteína (%P), duração da lactação (DL), intervalo entre partos (IEP) e idade ao primeiro parto (IPP), além das correlações genéticas e fenotípicas entre as mesmas. Os componentes de covariância foram estimados por inferência Bayesiana em análises multicaracterísticas utilizando um modelo animal e o programa computacional GIBBS2F90. Foram incluídos os grupos de contemporâneos e o número de ordenhas (1 ou 2) como efeitos fixos, a idade da búfala ao parto (efeitos linear e quadrático) como covariáveis e os efeitos genético aditivo, ambiental e residual como efeitos aleatórios. As estimativas da herdabilidade e seus desvios-padrão para PL, % G, %P, DL, IEP e IPP foram 0,24±0,02; 0,34±0,05; 0,40±0,05; 0,09±0,01; 0,05±0,01 e 0,16±0,04, respectivamente. As correlações genéticas entre a PL e %G, %P, DL, IEP e IPP foram -0,29; -0,18; 0,66; 0,08 e 0,24, respectivamente. A produção de leite e seus constituintes apresentaram variação genética suficiente para obtenção de ganhos genéticos pela seleção. As correlações genéticas entre produção de leite e seus constituintes foram negativas, e portanto, os esforços para aumentar a PL pode diminuir a qualidade do leite. As reprodutivas apresentaram pouca influência genética, indicando que melhorias no manejo seriam suficientes para obter melhores desempenhos.
Palavras-chave: Búfalo. Correlação genética. Herdabilidade. Produção de leite.
_____________________ *Corresponding author
1Received for publication in 09/10/2014; accepted in 10/23/2015. Paper extracted from master dissertation of the first author.
2Faculdade de Ciências Agrárias e Veterinárias, Universidade Estadual Paulista “Júlio de Mesquita Filho”, Jaboticabal, SP, Brazil;
Rev. Caatinga
INTRODUCTION
The adaptability of buffaloes (Bubalus bubalis) to a variety of environmental conditions has led to substantial growth of the Brazilian herd. There were 1,261,922 buffaloes in Brazil in 2011, and the herd experienced a growth rate of 7.8% between 2010 and 2011, exceeding the 1.6% growth rate of the cattle herd (IBGE, 2012). The high growth rate may be associated with the increase in consumer demand for buffalo products, particularly mozzarella cheese, which is widely used in cooking because of its flavor and other organoleptic qualities.
Like milk production, reproduction is a physiological event that influences the profitability of dairy farming (LOPES et al., 2008). According to Cassiano et al. (2004), the importance of the study of reproductive traits in breeding programs lies in the relationship between these traits and rates of annual genetic gain.
Understanding the production potential of animals is essential to improving production levels. These data permit livestock managers to make necessary adjustments in animal management, as well as estimate genetic parameters for milk production and reproduction traits, which are important in the development of appropriate breeding programs.
Estimating heritability allows for the prediction of the outcome of selective breeding.
Moderate heritabilities for milk yield (MY), ranging from 0.20 to 0.25, have been reported for buffaloes (MALHADO et al., 2007; ASPILCUETA -BORQUIS et al., 2010; RODRIGUES et al., 2010; SENO et al., 2010). These results suggest there is sufficient additive genetic variation to respond to selective breeding. However, the low heritabilities obtained for reproductive traits in buffaloes indicate
that much of the variation is caused by environmental differences between individuals. In
this case, improvement of animal management is necessary to alter the traits.
The genetic correlation between two traits is indicative of the probability that the same genes influence the expression of both traits. Therefore, highly positive genetic correlation indicates that selection for one trait may result in a genetic gain in the other. In a study on Italian buffaloes, Rosati and Van Vleck (2002) observed a genetic correlation of 0.31 between the percentage of fat and protein in milk. However, the correlation between MY and the
percentage of fat and protein was -0.08 and -0.12,
respectively, demonstrating the difficulty in performing simultaneous selection for MY and milk
components. In cases where selection for antagonistic traits is required, it is possible to use a selection index that applies an appropriate weight to all traits. However, the response to selection will be smaller than that of selection for only one of the traits.
The objective of the present study was to determine the genetic variation in the production and quality of buffalo milk and reproductive traits, in order to include genetically modifiable traits in selection programs designed to improve population performance.
MATERIAL AND METHODS
Milk yield records from 3,061 crossbred Murrah buffalo cows born between 1986 and 2009 were used in this study. The animals belonged to five herds, four of which were from the state of São Paulo, while the other was from the state of Rio Grande do Norte. Lactation was truncated at 305 days because lactation lasted longer than this period in only 12% of the females. Milk yields were obtained beginning with day 5 of lactation and yields were measured until day 45 after calving. The following traits were analyzed: milk yield (MY), mean percentage of fat (%F) and protein (%P), lactation length (LL), calving interval (CI), and age at first calving (AFC).
Lactation lasting less than 90 days, AFC > 60 months, and CI > 650 days were excluded from the dataset. Cows with AFC ranging from 2 to 8 years were included. Two calving and birth seasons were defined in the Rio Grande do Norte herd—the rainy season from April to September and the dry season from October to March. Meanwhile, the rainy and dry seasons for the São Paulo herd were from October to March and from April to September, respectively. Contemporary groups for AFC were formed by herd, year of birth, and season of birth, whereas they were formed by herd, and year and season of calving for MY, fat percentage, protein percentage, LL, and CI. Contemporary groups with fewer than three animals were excluded from the analysis. A pedigree file containing 8,664 animals in the relationship matrix was used. The general data structure is shown in Table 1.
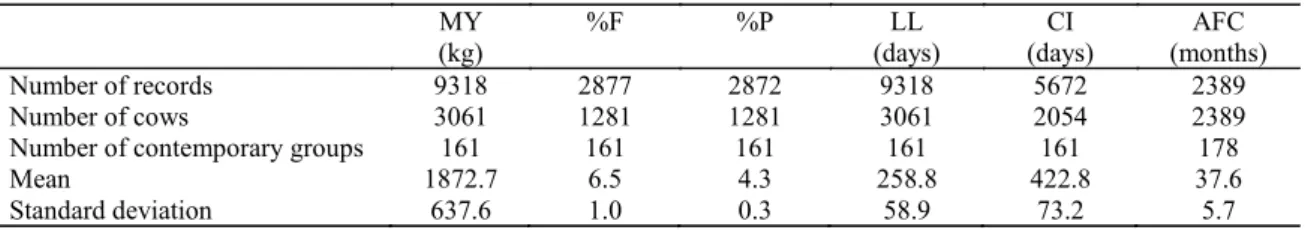
Table 1. Structure of the data and descriptive statistics for milk yield (MY), fat percentage (%F), protein percentage (%P), lactation length (LL), calving interval (CI), and age at first calving (AFC) in dairy buffaloes.
MY (kg)
%F %P LL
(days)
CI (days)
AFC (months)
Number of records 9318 2877 2872 9318 5672 2389
Number of cows 3061 1281 1281 3061 2054 2389
Number of contemporary groups 161 161 161 161 161 178
Mean 1872.7 6.5 4.3 258.8 422.8 37.6
Rev. Caatinga
Covariance components were estimated by Bayesian inference in the multitrait analysis using the program GIBBS2F90 (MISZTAL, 2007). The analysis model included the contemporary groups and number of milkings (1 or 2) as fixed effects, age of dam at calving (linear and quadratic effects) as a covariates, and additive genetic, permanent environmental, and residual effects as random effects. The animal model can be written in matrix form as:
where y is the vector of the trait observed; X is the incidence matrix of fixed effects; β is the vector of fixed effects (contemporary group, number of milkings, and age of dam at calving); Z is the incidence matrix of random additive genetic effects; a is the vector of random additive genetic effects; W is the incidence matrix of the random permanent environmental effect; p is the vector of the random permanent environmental effect, and e is the vector of residual random effects. A uniform a priori distribution (β) was defined for fixed effects. Gaussian and inverse Wishart distributions were adopted for random effects and covariance components, respectively.
where A, G, P, R, and In are the matrices of relationships, covariances of additive genetic, permanent environmental, and residual effects, and
identity, respectively; is the Kronecker product, and Sg, vp, Sp,vp, Sr,and vr are a priori values and
degrees of freedom of additive genetic, permanent environmental, and residual covariances, respectively. One million samples were generated in the analysis, with a burn-in period of 100,000 cycles and with samples taken every 100 cycles. Convergence was confirmed by visual inspection and with the Gibbanal program.
RESULTS AND DISCUSSION
Visual inspection and the results of the Gibbanal program demonstrated convergence for all parameters estimated by the model. Thus, the burn-in period was sufficient to reach convergence for parameter estimation. The effective size of the samples ranged from 489 to 42,555. These sample sizes were sufficient to estimate measures of central tendency and the highest posterior density intervals
for each parameter. The number of samples discarded during the burn-in period and serial correlation among Markov chain samples are the
main features of Bayesian analysis (RESENDE et al., 2001). In general, the burn-in period and serial correlations increase with increasing number of estimated parameters, reducing the effective size of the samples.
The heritability for MY was moderate (Table 2), suggesting sufficient additive genetic variation to respond to selection. Similar results have been reported in studies conducted in Brazil, with estimates ranging from 0.20 to 0.25 (TONHATI et al., 2000a; MALHADO et al., 2007; RODRIGUES et al., 2010; SENO et al., 2010; ASPILCUETA -BORQUIS et al., 2012). In contrast, Rosati and Van Vleck (2002), studying an Italian buffalo population, estimated a heritability of 0.14 for MY. These differences are probably caused by differences in locations, as well as genetic differences among herds.
The heritabilities for fat and protein percentages were moderate (Table 2), indicating that these two traits should respond well to selection. Moderate values for environmental variance were expected because of differences in the management of the herds studied, in addition to the fact that the herds were not being selectively bred. Aspilcueta -Borquis et al. (2010) obtained similar heritabilities for fat and protein percentages (0.32 and 0.39, respectively), whereas lower heritability estimates were reported by Tonhati et al. (2000a) and Rosati and Van Vleck (2002). The estimated heritability for LL (Table 3) was similar to that reported by Aziz et al. (2001), Malhado et al. (2009), and Rodrigues et al. (2010), which ranged from 0.08 to 0.09. The low heritability for LL indicates that this trait is influenced mainly by non-genetic factors and performance can be improved by adequate herd management.
The heritability for CI (Table 3) was low, indicating that better management and feeding procedures could be more efficient than selective breeding. This agrees with estimates reported in Brazil and Egypt (0.00 to 0.07) (AZIZ et al., 2001; CASSIANO et al., 2004; RAMOS et al., 2006; MALHADO et al., 2009). The heritability for AFC (Table 3) indicates that this trait may respond reasonably well to selective breeding because it is a reproductive trait. A lower AFC is important because females that begin their reproductive life early can reduce production costs by increasing herd productivity. A lower estimate of 0.07 was obtained by Seno et al. (2010). In contrast, higher estimates of 0.20, 0.24, and 0.41 were reported by Tonhati et al. (2000b), Cassiano et al. (2004), and Malhado et al. (2009), respectively. However, this trait is strongly influenced by the reproductive management of the herd. During implantation, it is necessary to synchronize the mounting of cows and this procedure may alter the true capacity of the animals to present early estrus.
y = Xβ + Za + Wp + e
β∝constant; a|G ~ MVN[0,(G
A)];p| P ~ MVN[0,(P
In)]; G | Sg,vg~ IW[Sg vg,vg];P | Sp,vp~ IW[Spvp,vp];
Rev. Caatinga
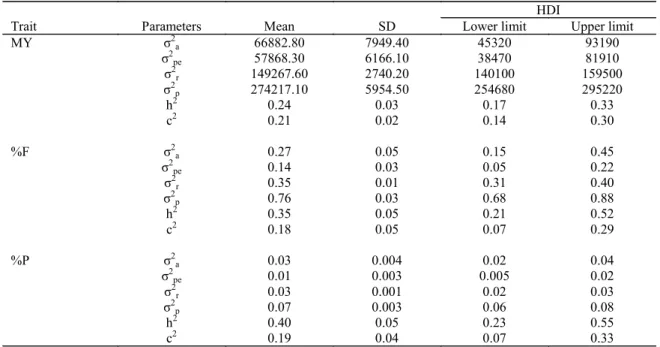
Table 2. Posterior distribution, standard deviation (SD), and 95% highest density interval (HDI) for milk yield (MY), fat percentage (%F), and protein percentage (%P) in dairy buffaloes.
HDI
Trait Parameters Mean SD Lower limit Upper limit
MY σ2a 66882.80 7949.40 45320 93190
σ2
pe 57868.30 6166.10 38470 81910
σ2
r 149267.60 2740.20 140100 159500
σ2
p 274217.10 5954.50 254680 295220
h2 0.24 0.03 0.17 0.33
c2 0.21 0.02 0.14 0.30
%F σ2a 0.27 0.05 0.15 0.45
σ2
pe 0.14 0.03 0.05 0.22
σ2
r 0.35 0.01 0.31 0.40
σ2
p 0.76 0.03 0.68 0.88
h2 0.35 0.05 0.21 0.52
c2 0.18 0.05 0.07 0.29
%P σ2a 0.03 0.004 0.02 0.04
σ2
pe 0.01 0.003 0.005 0.02
σ2
r 0.03 0.001 0.02 0.03
σ2
p 0.07 0.003 0.06 0.08
h2 0.40 0.05 0.23 0.55
c2 0.19 0.04 0.07 0.33
σ2
a = additive genetic variance; σ2ep = permanent environmental variance; σ2r = residual variance; σ2p = phenotypic variance;
h2 = heritability; c2 = permanent environmental variance as a proportion of phenotypic variance.
Table 3. Posterior distribution, standard deviation (SD), and 95% highest density interval (HDI) of lactation length (LL), calving interval (CI), and age at first calving (AFC) in dairy buffaloes.
HDI
Trait Parameter Mean SD Lower limit Upper limit
LL σ2a 251.21 50.13 117.80 454.00
σ2
pe 337.16 45.49 208.00 502.60
σ2
r 2162.85 37.31 2035.00 2300.00
σ2
p 2750.26 45.63 2571.40 2914.90
h2 0.09 0.02 0.04 0.16
c2 0.12 0.02 0.08 0.18
CI σ2
a 275.13 63.52 108.00 543.00
σ2
pe 399.01 58.76 218.90 576.70
σ2
r 4061.48 84.86 3772.00 4417.00
σ2
p 4737.83 93.03 4414.20 5100.70
h2 0.05 0.01 0.03 0.10
c2 0.08 0.01 0.05 0.12
AFC σ2a 7.75 1.13 3.18 15.06
σ2
r 16.41 1.38 12.56 20.16
σ2
p 23.97 0.75 21.57 26.49
h2 0.16 0.04 0.05 0.27
c2 0.16 0.05 0.04 0.35
The genetic correlations between MY and fat and protein percentage (Table 4) agree with those previously reported (TONHATI et al., 2000a; ROSATI and VAN VLECK, 2002). These results indicate that selection to increase MY may result in a decrease in the percentage of milk fat and protein. The genetic correlation between the percentage of fat
Rev. Caatinga
Table 4. Genetic (above the diagonal) and phenotypic (below the diagonal) correlations between milk yield (MY), fat percentage (%F), protein percentage (%P), lactation length (LL), calving interval (CI), and age at first calving (AFC) in dairy buffaloes.
MY %F %P LL CI AFC
MY - -0.29 -0.18 0.66 0.08 0.24
%F -0.16 - 0.25 0.08 0.14 -0.27
%P -0.25 0.27 - -0.18 -0.04 -0.44
LL 0.59 0.00 -0.10 - 0.75 0.42
CI 0.04 0.03 0.00 0.10 - 0.28
AFC 0.09 -0.04 -0.10 0.09 0.07 -
A high positive genetic correlation was observed between MY and LL (Table 4). A similar genetic correlation (0.89) between these two traits was reported by Malhado et al. (2009). In this case, direct selection for increased MY may result in an increase in LL. The genetic correlation between MY and CI was almost zero (Table 4), in agreement with Tonhati et al. (2000b). This indicates that selection for the two traits is independent. It is therefore possible to select for an increase in MY without interfering with the CI of the herd. Ramos et al. (2006) and Malhado et al. (2009) reported genetic correlations of -0.22 and -0.25, respectively, between these traits. These estimates suggest that selection for MY will result in genetic gains in CI. The genetic correlation between MY and AFC (Table 4) indicates that selection to increase MY may increase AFC. This effect is undesired owing to losses incurred because of older age of cows at first calving. Tonhati et al. (2000b) reported a genetic correlation of 0.63 between MY and AFC. In contrast, Malhado et al. (2009) found a genetic correlation of -0.02 between these traits.
A high positive genetic correlation was observed between LL and CI (Table 4), indicating that an increase in LL may also select for a longer CI. On the other hand, Tonhati et al. (2000b) and Aziz et al. (2001) found low genetic correlations between these traits (-0.20 and 0.09, respectively). The genetic correlation between LL and AFC was moderate (Table 4). This finding suggests that selection to reduce AFC of buffaloes is likely to result in negative alterations in LL, which must to be monitored.
The genetic correlation (0.28) between CI and AFC (Table 4) indicates that selection to reduce AFC may also reduce CI. Therefore, direct selection for either of these traits may result in genetic gains in both. However, Cassiano et al. (2004) observed negative genetic correlations between these two traits in Carabao and Mediterranean buffaloes and a correlation of zero in the Murrah breed, whereas a genetic correlation of 1 was estimated for Jafarabadi buffaloes. The authors highlighted the need to evaluate each breed separately given the variability among breeds.
The phenotypic correlations between MY and milk components were moderate and negative (Table 4), a finding confirming that selection for increased MY will have a negative effect on the percentage of
fat and protein in milk. Tonhati et al. (2000a) reported much lower phenotypic correlations between MY and the percentage of fat and protein (-0.62 and -0.59, respectively). The phenotypic correlation between MY and LL was similar to the estimate of 0.57 reported by Malhado et al. (2009), suggesting that an increase in MY may extend lactation. The phenotypic correlations between the other traits analyzed were close to zero, and thus,
increases or decreases in these traits occur independently.
CONCLUSIONS
Milk yield and milk components (percentage of fat and protein) presented sufficient genetic variation to provide genetic gains in selection programs. However, selection to increase MY may reduce the percentage of fat and protein in milk, a fact impairing simultaneous selection for the two traits. Lactation length, CI, and AFC are mainly influenced by non-genetic factors, suggesting that improvement of management conditions may be sufficient to improve performance in these traits.
ACKNOWLEDGEMENTS
The authors would like to thank the Coordination for the Improvement of Higher Personnel (CAPES) for the scholarships, as well as the Brazilian Association of Breeders of Buffaloes (ABCB) for providing the pedigree and phenotypic data.
REFERENCES
ASPILCUETA-BORQUIS, R. R et al. Genetic parameters for buffalo milk yield and milk quality traits using Bayesian inference. Journal of Dairy Scince, Champaign, v. 93, n. 5, p. 2195-2201, 2010.
Rev. Caatinga
AZIZ, M. A et al. Genetic and phenotypic variation of some reproductive traits in Egyptian buffalo. South African Journal of Animal Science, Grahamstown, v. 3, n. 31, p. 195-199, 2001.
CASSIANO, L. A. P. et al. Parâmetros genéticos das características produtivas e reprodutivas de búfalos na Amazônia Brasileira. Pesquisa Agropecuária Brasileira, Brasília, v. 39, n. 5, p. 451-457, 2004.
INSTITUTO FUNDAÇÃO BRASILEIRA DE GEOGRAFIA E ESTATÍSTICA (IBGE). Efetivos dos rebanhos em 31.12 e variação anual segundo as categorias. Avaliable at: <ftp://ftp.ibge.gov.br/ Producao_Pecuaria/
Producao_da_Pecuaria_Municipal/2011/tabelas_pdf/ tab01.pdf> Accessed in: 26 mai. 2014.
LOPES, C. R. A. et al. Eficiência reprodutiva e influências de fatores de meio e de herança sobre a variação no peso ao nascer de bubalinos no estado de Rondônia. Revista Brasileira de Zootecnia, Viçosa, v. 37, n. 9, p. 1595-1600, 2008.
MALHADO, C. H. M. et al. Parâmetros e tendências da produção de leite em bubalinos da raça Murrah no Brasil. Revista Brasileira de Zootecnia, Viçosa, v. 36, n. 2, p. 376-379, 2007.
MALHADO, C. H. M. et al. Estimativas de parâmetros genéticos para características reprodutivas e produtivas de búfalas mestiças no Brasil. Revista Brasileira de Saúde e Produção Animal, Salvador, v. 10, n. 4, p. 830-839, 2009.
MISZTAL, I. BLUPF90 family of programs (2007). Avaliable at: <http://nce.ads.uga.edu/~ignacy/ newprograms.html>. Accessed in: 26 mai. 2014.
RAMOS, A. A. et al. Caracterização fenotípica e genética da produção de leite e do intervalo entre partos em bubalinos da raça Murrah. Pesquisa Agropecuária Brasileira, Brasília, v. 41, n. 8, p. 1261-1267, 2006.
RESENDE, M. D. V. et al. Análise de modelos lineares mistos via inferência Bayesiana. Revista de matemática e estatística, Jaboticabal, v. 19, n. 1, p. 41-70, 2001.
RODRIGUES, A. E. et al. Estimação de parâmetros genéticos para características produtivas em búfalos na Amazônia Oriental. Arquivo Brasileiro de Medicina Veterinária e Zootecnia, Belo Horizonte, v. 62, n. 3, p. 712-717, 2010.
ROSATI, A.; VAN VLECK, L. D. Estimation of genetic parameters for milk, fat, protein and mozzarella cheese production for the Italian river buffalo Bubalus bubalis population. Livestock
Production Science, Nebrasca, v. 74, n. 2, p. 185 -190, 2002.
SENO, L. et al. Genetic parameters for milk yield, age at first calving and interval between first and second calving in milk Murrah buffaloes (2010).
Livestock Research for Rural Development.
Avaliable at: <http://www.lrrd.org/lrrd22/2/ seno22038.htm>. Accessed in: 26 mai. 2014.
TONHATI, H. et al. Parâmetros genéticos para a produção de leite, gordura e proteína em bubalinos. Revista Brasileira de Zootecnia, Viçosa, v. 6, n. 29, p. 2051-2056, 2000a.