Anomalous scales of
Tillandsia usneoides
(L.) L. (Bromeliaceae)
exposed in the Metropolitan Region of Campinas, SP, Brazil
as air pollution markers
Patrícia Giampaoli1,2, Natalie do Valle Capelli1, Armando Reis Tavares1, Francine Faia Fernandes1, Marisa Domingos1 e Edenise Segala Alves1
Received: 4.05.2015; accepted: 2.10.2015
ABSTRACT - (Anomalous scales of Tillandsia usneoides (L.) L. (Bromeliaceae) exposed in the Metropolitan Region of Campinas, São Paulo State, Brazil, as air pollution markers). Tillandsia usneoides is an epiphytic bromeliad that has been used as a universal bioindicator. The species accumulates metals and presents foliar scale variations when exposed to air pollutants. This study aimed to use the variations in foliar scales as microscopic markers of pollutant effects in the Metropolitan Region of Campinas (MRC), São Paulo State, Brazil. T. usneoides plants were exposed for 12 weeks during dry and wet seasons, totaling four exposures, at five sites in the MRC. Samples were selected before each exposure for initial evaluation of the plants (T0). Leaf fragments were fixed in glutaraldehyde and total scale density and anomalous scale percentage were evaluated. Plants exposed in the MRC showed anomalies and changes in number of subperipheral cells of leaf scales. When compared to T0, T. usneoides presented higher total scale density and anomalous scale percentage at disturbed sites, thus the species can be used as a pollution bioindicator for MRC.
Keywords: bromeliad, air pollutants, trichomes, bioindicator
RESUMO - (Escamas anômalas em Tillandsia usneoides (L.) L. (Bromeliaceae) expostas na Região Metropolitana de Campinas, SP, Brasil, como marcadoras da poluição aérea). A bromélia epífita Tillandsia usneoides vem sendo utilizada como bioindicadora universal por acumular altas concentrações de metais e apresentar alterações nas escamas foliares quando expostas a ambientes poluídos. Neste estudo objetivou-se utilizar alterações morfológicas nas escamas foliares como marcadores dos efeitos de poluentes aéreos na Região Metropolitana de Campinas (RMC), SP, Brasil. T. usneoides foi exposta em cinco pontos da RMC durante quatro exposições de 12 semanas, abrangendo duas exposições na estação úmida e duas na seca. Antes de cada exposição, foram selecionadas amostras para avaliação de condições iniciais das plantas (T0). Fragmentos de folhas foram fixados em glutaraldeído e avaliados quanto a densidade total de escamas e porcentagem de escamas anômalas. As plantas expostas na RMC apresentaram anomalias e alteração no número de células subperiféricas das escamas foliares. As plantas expostas em PA apresentaram maior densidade total de escamas e em PC maior porcentagem de escamas anômalas, quando comparadas às plantas T0. T. usneoides apresentou respostas relacionadas aos estresses ambientais, com maior presença de escamas anômalas e maior densidade total de escamas em plantas expostas em regiões antropizadas, portanto a espécie pode ser utlizada como bioindicadora da poluição na RMC. Palavras-chave: bromélia, poluentes atmosféricos, tricomas, bioindicador
1. Instituto de Botânica, Postal Code 68041, 0161-970 São Paulo, São Paulo State, Brazil 2. Corresponding author: patpaoli83@gmail.com
Introduction
The Metropolitan Region of Campinas (MRC) is composed of 20 cities and accounts for approximately 15% of São Paulo State total population. The region economic growth initiated in the sixties with the implementation of large urban industrial complexes (Gutjahr 2004), as the city of Paulínia, which has a significant amount of mainly chemical
and petrochemical industries (Tresmondi & Tomaz 2004). The MRC has been affected by high levels of primary air pollutants originated from road traffic and, is responsible for over 80% of CO, NOx and hydrocarbon emissions, and develops industrial activities that emit about 70% of the particulate matter present in the region (Ueda & Tomaz 2011).
are carbon monoxide (CO), sulphur dioxide (SO2), nitrogen oxides (NOx), particulate matter (PM) and ozone (O3) (CETESB 2013). Pollutants generated in the MRC and those carried by the south-southwest wind from the Metropolitan Region of São Paulo (MRSP) affect air quality in the region (Boian & Andrade 2012) and impact the existing vegetation of fragments of the seasonal semideciduous forest (Nascimento et al. 2006, Cielo-Filho & Santin 2002).
Many plant species have been identified as pollution monitors such as: Tibouchina pulchra
Cogn. (Melastomataceae) in Cubatão industrial complex (Domingos et al. 1998; Domingos et al. 2000); Psidium guajava “Paluma” in urban regions as
ozone bioindicator (Furlan et al. 2007, Sandre et al.
2014, Assis et al. 2015) and the sensitive cultivar of tobacco, Nicotiana tabacum “Bel W3”, in Europe and
Brazil as atmospheric ozone indicator (Klumpp et al. 2006; Sant’Anna et al. 2008; Esposito 2008, Pedroso
& Alves 2015). Plants of the Bromeliaceae family have also been evaluated as biomonitor, especially
Aechmea blanchetiana (Giampaoli et al. 2012), Aechmea coelestis (K. Koch) E. Morren, Nidularium
cf. inocentii (Schult. f.) L.B. Smith, Nidularium krisgreeniae Leme and Vriesea carinata Wawra (Elias et al. 2008).
Studies have shown that structural markers allow evaluating the effects of pollutants in plants (Vollenweider et al. 2003). Changes in the stellate
trichome morphology due to environmental agents have been described in the nickel-accumulating species Alyssum corsicum Rob. ex Gren. & Godr.,
when exposed to high concentrations of the metal (Babaoğlu Aydas et al. 2013). Trichomes of Ligustrum japonicum Thunb. and Olea europaea L. lost the original form when exposed to high concentrations of CO and SO2 from automobile emissions (Abdallah & Mejnum 2013).
The genus Tillandsia is found throughout
Latin America and has epiphytic habits, living independently of ground in trees or inert substrates and presenting absorbing trichomes on the entire leaf surface (Brighigna et al. 1997). Trichomes, also called
scales (Benzing et al. 1992), protect the plant from
UV radiation by reflecting most of the incoming light, absorb moisture from the air, retain dust and prevent the stomata from losing excessive water (Laboy-Nieves et al. 2010). Several studies have confirmed that Tillandsia genus plants are great bioindicators of
gaseous pollutants (Benzing et al. 1992, Figueiredo et al. 2001, 2004, 2007) and are highly capable of
accumulating many metals (Calasans & Malm 1997, Amado-Filho et al. 2002).
T. usneoides is an atmospheric epiphyte that
depends exclusively on the atmosphere for survival (Brighigna et al. 1997). It extracts mineral nutrients
and water from the rain and moisture in the air (Benzing et al. 1976), thus the species is considered
a universal accumulator (Arndt & Schweizer 1991) and is used for metal biomonitoring. However, Alves
et al. (2008) reported the presence of anomalies in T. usneoides scales exposed to polluted areas of São
Paulo city, suggesting that anomalous scales are an alternative bioindicator parameter.
The study aimed to detect changes in the scales of Tillandsia usneoides exposed to disturbed
environments, providing additional information about its use as air quality bioindicator, and generate information about the impact of air pollutants on the atmosphere of the Metropolitan Region of Campinas (MRC).
Material and methods
Study area and plant material
The MRC is located in an intertropical zone with predominantly humid subtropical climate, characterized by two distinct seasons: wet period with high temperatures and dry period with mild temperatures and less rainfall (Rolim et al. 2007).
Between seasons, exist significant differences on the intensity and direction of the winds, which are predominantly from Southeast to Northwest (Domingos et al. 2015). The local climate is defined as
prevalent Cfa (humid subtropical zone with dry winter and hot summer) according to Köppen classification (Alvarez et al. 2014) or B1rB’4a type according
to Thornthwaite’s classification, which considers topography and altitude as direct influence on climatic elements (Rolim et al. 2007).
Plants of Tillandsia usneoides (L.) L. were
obtained from a commercial producer located in Cordeirópolis, an agricultural area in the region, and held for six months in a greenhouse at the Botanical Institute of São Paulo, for acclimatization before exposures started.
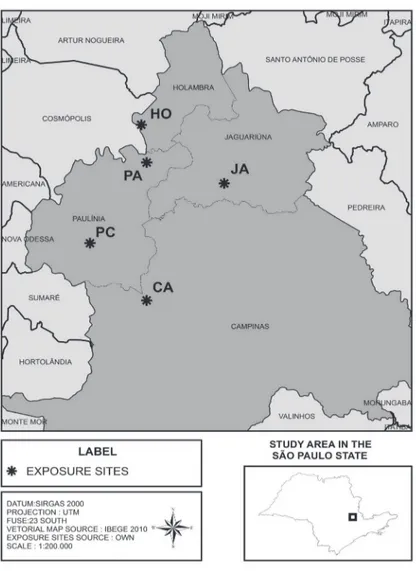
Figure 1. Map distribution of exposure sites of Tillandsia usneoides plants in Metropolitan Region of Campinas (MRC), São Paulo State, Brazil.
(PC) - 22°46'13.4"S-47°09'25.3"W. From June 2011 to April 2013, five samples of T. usneoides, weighing
approximately 50 g (fresh matter), were exposed at each sites, in four exposure periods of 12 weeks each, including two wet and two dry periods, (Expo A - 06/22/2011 to 09/14/2011; Expo B - 12/13/2011 to 02/29/2012; Expo C - 05/23/2012 to 08/14/2012; Expo D - 11/06/2012 to 01/23/2013). The samples remained suspended in strands of nylon under a PVC supporter (1.60 alt. × 1.0 w: × 2.0 m lenght) with 50% shade protection and weekly irrigation with deionized water. The plants were replaced by new ones (acclimated) after the end of each exposure. At the beginning of each exposure, three samples were selected from the acclimated plants for the evaluation of the initial state (time zero-T0).
Concentrations of O3, SO2, NO2 and PM10 and values of climatic variables were obtained from
monitoring stations of CETESB (PC-Paulínia Center and PA-Paulínia) and Center of Meteorological and Climatic Research Applied to Agriculture (Cepagri, UNICAMP). At the other study sites and in the greenhouse, passive SO2, NO2, and O3 (except in the greenhouse) samplers were used (Ogawa 2001, Machado et al. 2008, Allen et al. 2010), and evaluated
weekly (table 1).
Preparation of anatomical slides
Entire fragments of T. usneoides were submerged
lengthwise freehand with steel blades and immersed in a maceration solution of hydrogen peroxide 30 vol and glacial acetic acid 1:1, remained in an oven at 60 °C for 12 hours and subsequently washed with distilled water. The fragments were stained with 0.05% toluidine blue (Feder & O’Brien 1968) and assembled in 50% glycerin. Three blades were produced per plant sample.
Images of the scales were captured by Olympus microscope (BX53) equipped with Olympus camera Q color 5 and analyzed with the aid of Image Pro Express 6.3 software. For each exposure site and exposure period, 15 fields were assessed per blade (scales mm‑2) and the total scale density and anomalous scale percentage (number of anomalous scales in relation to the total number of scales) were estimated in 1,080 fields.
Statistical analysis
The data were submitted to analysis of variance (ANOVA on ranks) and the averages were compared according to the Kruskal-Wallis method to establish differences between sites, and the Man-Whitman method was used to establish differences between dry and wet exposure periods. For multiple comparisons between the periods and the sites, the Dunm test (p < 0.05) was applied. The Spearman correlation test (p < 0.05) determined possible associations between pollutant concentration variations and the analyzed parameters (total density of scales and percentage of anomalous scales).
Results and Discussion
The environmental data obtained in PC, when compared with those provided by other monitoring stations, showed little variation in the concentrations of pollutants and climatic parameters, with the exception of precipitation. Therefore, the monitoring station at PC appropriately characterizes the study region and can be used as a reference to the correlation analysis (table 1). Studies conducted in the region (Tresmondi & Tomaz 2004, Boian & Andrade 2012, Bulbovas et al. 2015) also showed little
spatial variation in air pollution levels in the MRC, confirming the representativeness of the monitoring station in Paulínia Center for the study area.
The surface of Tillandsia usneoides leaves is
covered with scales that, in frontal view, consist of a central disc formed by four cells surrounded by two sets of cells: the first consists of eight slender cells,
called pericentral cells, and the second has sixteen cells and is called subperipheral. Externally, there are empty, elongated, thin-walled and radially arranged peripheral cells, forming a shield that is called wing (figure 2a-f). The scale wings (figure 2a) exhibit a confluent layering, forming a space between them and the epidermal surface (Benzing et al. 1976, Souza &
Neves 1996, Proença & Sajo 2007).
The anomalies observed in the scales of plants exposed in the MRC were: change in the number of cells in the subperipheral layer, less (figure 2c) or more (figure 2d) than 16 cells and addition of cells between the subperipheral layer of the disc and the wing (figure 2e). Changes were also observed in cell shapes in different layers, resulting in fully deformed scales (figure 2f). According to Cardoso-Gustavson et al. (2015), changes in the number of
cells of T. usneoides scales exposed to pollutants are
related to occurrence of mutagenic processes. The authors found that, during the development of scales, endoreduplication cycles could occur in the nucleus without cell division, resulting in reduced number of subperipheral cells with large nucleus.
Plants exposed in PC and PA showed a significant increase in the density of total scales in the dry period and showed no significant variation in the wet period, when compared to T0 plants. The highest percentage of anomalous scales was observed in plants exposed at PC in the wet period, compared with the T0 plants and did not vary significantly in the dry period.
Total scale density and anomalous scale percentage were significantly different comparing the dry and wet exposure periods at each site. Plants exposed in PA presented higher scale density and anomalous scale percentage in the dry period. At the other sites, plants exposed in the wet period had higher scale density and anomalous scale percentage than those exposed in the dry period. The positive association of the percentage of anomalous scales with moisture is related to greater interaction of scales and pollutants in the presence of water, which facilitates diffusion of pollutants, increasing acidity in intercellular spaces (Larcher 2000) and that is intensified in T. usneoides since the
species is an atmospheric bromeliad (Benzing et al. 1976).
Alves et al. (2008) observed a significant increase
in the total density of scales in T. usneoides exposed
Table 1. Environmental data of Metropolitan Region of Campinas (MRC). Average data from CETESB monitoring stations (Paulínia Downtown and Campinas) combined with values of local passive samplers. EA and EC: dry periods; EB and ED: wet periods; PC (data from Paulínia-Downtown CETESB monitoring station).
Environmental Data PM10 NO2 O3 SO2 RAD RH TEMP. PRECIP.
Exposition (µg m‑³) W m‑2 s-1 (%) (°C) (mm)
Metropolitan Region of Campinas
EA 58.82 31.12 49.90 7.52 153.46 66.59 19.57 69.83
EB 28.72 18.36 72.44 3.91 281.25 73.17 25.49 507.02
EC 39.17 33.09 49.09 6.58 128.17 79.32 26.93 187.49
ED 26.25 22.28 36.69 5.76 171.31 91.23 23.86 460.63
Paulínia - Downtown
EA 52.30 31.21 49.37 7.34 180.40 65.40 19.43 35.9
EB 34.53 18.68 76.79 3.35 269.22 68.79 24.32 226.8
EC 37.25 36.04 59.54 6.58 ‑ 76.51 31.86 68.3
ED 24.39 18.43 58.54 6.97 ‑ 82.02 24.22 155.2
also observed higher frequency of trichomes due to increased amount of pollutants. Quercus ilex L. exposed to high CO2 concentrations presented higher trichome density (Paoletti et al. 2007); although some
authors do not consider CO2 as a pollutant (Larcher 2000).
JA, HO and CA are under greater agricultural influence, while PA and PC are highly influenced by urban and industrial pollution sources. Higher exposure to pollutants from sources such as SO2 and PM10 can justify the increase of total scale density at the sites, as well as increased anomalous scales in PC.
In this study, the total scale density and anomalous scale percentage were larger than those observed by Alves et al. (2008), and the plants exposed in plants
at PC presented twice as many anomalous scales as the authors observed in the same species.
The statistical analysis showed higher percentage of anomalous scales in plants exposed at Paulínia (PC); therefore, with the aid of the Spearman correlation test, we established the relationship between the anomalous scale percentage, total scale density of plants exposed in Paulínia and environmental parameters (table 2). The percentage of anomalous scales in plants exposed in PC correlated negatively with SO2 and PM10 concentrations and positively with relative humidity (RH), whereas, total scale density showed no significant correlation with any of the environmental parameters. These results showed that the increasing concentrations of PM10 and SO2 in the region did not influence anomalies of the scales. Cardoso-Gustavson
et al. (2015) did not observe significant correlation
between the formation of anomalous scales in plants
of T. usneoides and the presence of trace metals, such as Ba, Fe and Cu, normally present in PM10, suggesting that anomalies would be related to other air pollutants from vehicular source, as NO2 and SO2.
The plants exposed in Paulínia presented the highest percentages of anomalous scales (table 3), differing significantly from T0, but showed no significant correlation with pollutants from urban sources. However, Alves et al. (2008) observed
relationship between anomalous scale increase in
T. usneoides plants and the presence of pollutants
in places with high levels of O3 in the MRSP, when compared to the rural environment. O3 and SO2 promote little visible damage in the epiphytic bromeliads with CAM photosynthesis, when compared to C3 plants, due to the presence of thick cell walls and the crown of dead cells (wings of scale) which covers the leaf surface, protects the stomata, promotes greater tolerance to pollutants and functions as primary physical barrier (Benzing et al. 1992).
T. usneoides is a species that accumulates metals
in particulate matter, (Calasans & Malm 1997, Figueiredo et al. 2007), due to its adsorption on the
scales (Amado-Filho et al. 2002), which makes it more tolerant to PM10. This assumption has been confirmed by the results obtained in this study, considering that there was negative correlation between anomalous scales and PM10.
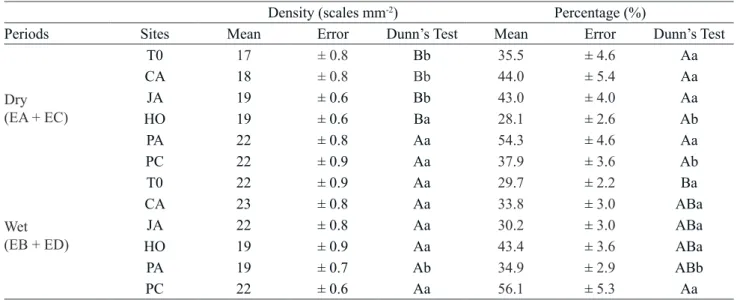
Table 3. Density and average percentage of anomalous scales in Tillandsia usneoides at different locations and exposure periods (wet or dry). T0: initial time, SP: São Paulo, CA: Campinas, JA: Jaguariúna, HO: Holambra, PA: Paulínia, PC: Paulínia Downtown.
Density (scales mm‑2) Percentage (%)
Periods Sites Mean Error Dunn’s Test Mean Error Dunn’s Test
Dry (EA + EC)
T0 17 ± 0.8 Bb 35.5 ± 4.6 Aa
CA 18 ± 0.8 Bb 44.0 ± 5.4 Aa
JA 19 ± 0.6 Bb 43.0 ± 4.0 Aa
HO 19 ± 0.6 Ba 28.1 ± 2.6 Ab
PA 22 ± 0.8 Aa 54.3 ± 4.6 Aa
PC 22 ± 0.9 Aa 37.9 ± 3.6 Ab
Wet (EB + ED)
T0 22 ± 0.9 Aa 29.7 ± 2.2 Ba
CA 23 ± 0.8 Aa 33.8 ± 3.0 ABa
JA 22 ± 0.8 Aa 30.2 ± 3.0 ABa
HO 19 ± 0.9 Aa 43.4 ± 3.6 ABa
PA 19 ± 0.7 Ab 34.9 ± 2.9 ABb
PC 22 ± 0.6 Aa 56.1 ± 5.3 Aa
Capital letters compare locations and lowercase exposure periods (dry or wet)
Table 2. Correlation among pollutant concentrations and environmental data provided by CETESB station-Paulínia Downtown and anomalous scales in leaves of Tillandsia usneoides at PC (Paulínia Downtown).
MP10 (µg m‑³)
NO2 (µg m‑³)
O3 (µg m‑³)
SO2 (µg m‑³)
Temp.
(°C) Precip. (mm) R.U. (%)
Scales density R2 0.0197 -0.11 -0.233 0.233 -0.245 -0.121 -0.0313
p 0.881 0.402 0.0728 0.0728 0.0593 0.357 0.812
Percentage of anomalous scales R2 -0.585 -0.413 -0.0552 0.0552 0.0942 0.153 0.734
p < 0.01 < 0.01 0.708 0.708 0.522 0.298 < 0.01
R2 – correlation coeficient; p – statistical significance
closest points to the industrial complex region. In the study of Alves et al. (2008), T. usneoides plants
were exposed continuously for 8, 16 and 24 weeks; changes in the scales became visible after 8 weeks of exposure. In the present study, the plants were exposed for 12 weeks and no direct relationship between O3 concentrations and percentage of anomalies was observed. The studied region encompasses different sources of air pollutants and climatic regime comparing with the sites studied by Alves et al. (2008)
in the city of São Paulo. The difference among dry and wet periods is more pronounced in the MRC than in São Paulo (Alvarez et al. 2014), suggesting that the
variations in density of the scales and occurrence of anomalies can be induced not only by pollutants, but by weather conditions as well.
Studies carried out with T. usneoides in the same
cities of the MRC showed low or no impact of air
pollutants on physiological (as chlorophyll contents and plant mass loss) or biochemical (antioxidant) activities (Giampaoli et al. unpublished data),
indicating that the tolerance of the species is related to the primary barrier represented by trichomes, as observed in the density variation and/or structure changes in other species (Moura 2013).
T. usneoides responded to environmental stress
with high presence of anomalous scales and total scale density in plants exposed in disturbed regions, mainly at PC and PA.
Acknowledgment
Literature cited
Abdallah, Y.N. & Mejnun, G.E. 2013. Change of the
morpho-anatomical structure of leaves of Ligustrum japonicum and Olea europea caused by heavy metal pollution. Caspian Journal of Applied Sciences Research 2: 59-67.
Allen, A.G., Cardoso, A.A., Wiatr, A.G., Machado, C.M.D., Paterlini, W.C. & Baker, J. 2010. Influence
of intensive agriculture on dry deposition of aerosol nutrients. Journal of Brazilian Chemistry Society 21: 87-97.
Alvares, C.A., Stapez, J.L., Sentelhas, P.C., Gonçalves
J.L.M. & Sparovek G. 2014. Köppen’s climate
classification map for Brazil. Meteorologische Zeitschrift 22: 711-728.
Alves, E.S., Moura, B.B. & Domingos, M. 2008.
Structural analysis of Tillandsia usneoides L. exposed to air pollutants in São Paulo City-Brazil. Water, Air and, Soil Pollution 189: 61-68.
Amado-Filho, G.M., Andrade, L.R., Farina, M. & Malm, O. 2002. Hg localization in Tillandsia usneoides L. (Bromeliaceae), an atmospheric biomonitor. Atmospheric Environment 36: 881-887.
Arndt, U. & Schweizer, B. 1991. The use of bioindicators
for environmental monitoring in tropical and subtropical countries. . In: H. Ellenberg, U. Arndt, R. Bretthauer, B. Ruthsatz & L. Steubing (eds.). Biological Monitoring Signals from the Environment. Vieweg, Berlin, pp. 199-259.
Assis, P.I., Alonso, R., Meirelles, S.T. & Moraes, R.M. 2015. DO3SE model applicability and O3 flux
performance compared to AOT40 for an O3-sensitive tropical tree species (Psidium guajava L. ‘Paluma’). Environmental Science and Pollution Research 22: 10873-10881.
Babaoğlu Aydas, S.S., Açik, L., Leduc, D., Adigüzel, N., Ellialtioğlu, S.S, Suludere, Z. & Kadioğlu, Y.K.
2013. Localization and distribution of nickel and other elements in in-vitro grown Alyssum corsicum exhibiting morphological changes in trichomes: initial insights into molecular mechanisms of nickel hyperaccumulation. Turkish Journal of Botany 37: 1115-1124.
Benzing, D.H., Arditti, J., Nyman, L.P. & Temple, P.J.
1992. Effects of ozone and sulfur dioxide on four epiphytic bromeliads. Environmental Experimental Botany 32: 25-32.
Benzing, D.H., Henderson, K., Kessel, B. & Sulak, S.
1976. The absorptive capacities of bromeliad thichomes. American Journal of Botany 63: 330-348.
Boian, C. & Andrade, M.F. 2012. Characterization of
ozone transport among Metropolitan Regions. Revista Brasileira de Meteorologia 27: 229-242.
Brighigna, L., Ravanelli, M., Minelli, A. & Ercoli, L.
1997. The use of an epiphyte (Tillandsia capuy-medusae Morren) as bioindicator of air pollution in Costa Rica. The Science of the Total Environment 198: 175-180.
Bulbovas, P., Camargo, C.Z.S. & Domingos, M. 2015. Ryegrass cv. Lema and guava cv. Paluma biomonitoring suitability for estimating nutritional contamination risks under seasonal climate in Southeastern Brazil. Ecotoxicology and Environmental Safety 118: 149-157.
Calasans, C.F. & Malm, O. 1997. Elemental mercury
contamination survey in a chlor-alkali plant by the use of transplanted Spanish moss Tillandsia usneoides (L). The Science of the Total Environment 208: 165-177.
Cardoso-Gustavson, P., Fernandes, F.F., Alves, E.S., Victorio, M.P., Moura, B.B., Domingos, M., Rodrigues, C.A., Ribeiro, A.P., Nievola, C.C. &
Figueiredo, A.M.G. 2015. Tillandsia usneoides: a
successful alternative for biomonitoring changes in air quality due to a new highway in São Paulo, Brazil. Environmental Science and Pollution Research DOI 10.1007/s11356-015-5449-8.
CETESB - Companhia de Tecnologia de Saneamento Ambiental. 2013. Relatório da qualidade do ar no
estado de São Paulo. Série Relatório. Secretaria do Meio Ambiente, São Paulo.
Cielo-Filho R.C. & Santin D.A. 2002. Estudo florístico
e fitossociológico de um fragmento florestal urbano - Bosque dos Alemães, Campinas, SP. Revista Brasileira de Botânica 25: 291-301.
Domingos, M., Bulbovas, P., Camargo, C.Z.S, Aguiar-Silva, C., Brandão, S.E., Dafré- Martinelli, Dia, A.P., Engela, M.R.G.S, Gagliano, J., Moura, B.B., Alves. E.S., Rinaldi, M.C.S., Gomes, E.P.C., Furlan, C.M. & Figueiredo, A.M.G. 2015. Searching for native tree
species and respective potential biomarkers for future assessment of pollution effects on the higly diverse Atlantic Forest in SE-Brazil. Environmental Pollution 202: 85-95.
Domingos, M., Klumpp, A. & Klumpp, G. 1998. Air
pollution impact on the Atlantic Forest at the Cubatão region, Brazil. Ciência e Cultura 50: 215-234.
Domingos, M., Lopes, M.I.S. & Struffaldi-De Vuono, Y.
2000. Nutrient cycling disturbance in Atlantic Forest sites affected by air pollution coming from the industrial complex of Cubatão, Southeast Brazil. Brazilian Journal of Botany 23: 77-85.
Elias, C., Fernandes, E.A.N., França, E.J., Bacchi, M.A. & Tagliaferro, F.S. 2008 Native bromeliads
as biomonitors of airborne chemical elements in a Brazilian Restinga forest. Journal of Radioanalytical and Nuclear Chemistry 278: 423-427.
Esposito, M.P. 2008. Estudo da relação entre necroses
Feder, N. & O’Brien, T.P. 1968. Plant microtechnique:
some principles and new methods. American Journal of Botany 55: 123-142.
Figueiredo, A.M.G., Alcalá, A.L., Ticianelli, R.B., Domingos, M. & Saiki. M. 2004. The use of Tillandsia usneoides L. as bioindicator of air pollution in São Paulo. Brazilian Journal of Radioanalitical Nuclear Chemistry 259: 59-63.
Figueiredo, A.M.G., Nogueira C.A., Saiki, M. &
Domingos, M. 2007. Assessment of atmospheric
metallic pollution in the metropolitan region of São Paulo, Brazil, employing Tillandsia usneoides L. as biomonitor. Environmental Pollution 145: 279-292.
Figueiredo, A.M.G., Saiki. M., Ticianelli, R.B.,
Domingos, M., Alves, E.S. & Market, B. 2001.
Determination of elements in Tillandsia usneoides by neutron activation analysis for environmental biomonitoring. Brazilian Journal of Radioanalytical and Nuclear Chemistry 249: 391-395.
Furlan, C.M., Moraes, R.M., Bulbovas, P., Domingos, M., Salatino, A. & Sanz, M.J. 2007. Psidium guajava ‘Paluma’ (the guava plant) as a new bio-indicator of ozone in the tropics. Environmental Pollution 147: 691-695.
Giampaoli, P., Tresmondi, F., Lima, G.P.P., Kanashiro, S., Alves, E.S., Domingos, M. & Tavares, A.R. 2012.
Analysis of tolerance to copper and zinc in Aechmea blanchetiana grown in vitro. Biologia Plantarum 56: 83-88.
Gutjahr, M. 2004. Avaliação da qualidade do ar em
Paulínia-SP. Boletim Goiano de Geografia 24: 55-68.
Klumpp, A., Ansel, W., Klumpp, G., Vergne, P., Sifakis, N., Sanz, M.J., Rasmussen, S., Ro-Poulsen, H., Ribas, A, Peñuelas, J., Kambezidis, H., He, S., Garrec, J.P. & Calatayud, V. 2006. Ozone pollution and ozone
biomonitoring in European cities Part II. Ozone-induced plant injury and its relationship with descriptors of ozone pollution. Atmospheric Environment 40: 7437-7448.
Laboy-Nieves, E.N, Goosen M.F.A. & Emmanuel, E. 2010 Environmental and Human Health–Risk
Management in Developing Countries. Taylor & Francis Group, London.
Larcher, W. 2000. Ecofisiologia Vegetal. RiMa, São Carlos.
Machado, C.M.D., Cardoso, A.A. & Allen, A.G. 2008.
Atmospheric emission of reactive nitrogen during biofuel ethanol production. Environmental. Science Technology 42: 381-385.
Moura, B.B. 2013.Análises estruturais e ultraestruturais
em folhas de espécies nativas sob influência de poluentes aéreos. Tese de Doutorado, Instituto de Botânica, São Paulo.
Nascimento, L.F.C., Pereira, L.A.A., Braga, A.L.F., Módolo, M.C.C. & Carvalho Jr, J.A. 2006. Efeitos
da poluição atmosférica na saúde infantil em São José dos Campos, SP. Revista de Saúde Pública 40: 77-82.
Ogawa. 2001 Protocol for ozone measurement using the
ozone passive sampler badge. Disponível em http:// ogawausa.com/wp-content/uploads/2014/04/proozone. pdf (acesso em 12-II-2011).
Paoletti, E., Seufert, G., Rocca, G.D. & Thomsen, H.
2007. Photosynthetic responses to elevated CO2 and
O3 in Quercus ilex leaves at a natural CO2 spring.
Environmental Pollution 147: 516-524.
Pedroso, A.N.V. & Alves, E.S. 2015.Temporal dynamics
of the cellular events in tobacco leaves exposed in São Paulo, Brazil, indicate oxidative stress by ozone. Environmental Science Pollution Research 22: 6535-6545.
Proença, S.L. & Sajo, M.D.G. 2007. Anatomia foliar de
bromélias ocorrentes em áreas de cerrado do Estado de São Paulo, Brasil. Acta Botanica Brasilica 21: 657-673.
Rolim, G.S., Camargo, M.B.P., Lania, D.G. & Moraes,
J.F.L. 2007. Classificação climática de Köppen e de
Thornthwaite e sua aplicabilidade na determinação de zonas climáticas para o estado de São Paulo. Bragantia 66: 711-720.
Sandre, A.A., Pina, J.M., Moraes, R.M. & Furlan, C.M. 2014. Anthocyanins and tannins: is the urban air
pollution an elicitor factor? Brazilian Journal of Botany 37: 9-18.
Sant’Anna, S.M., Esposito, M.P., Domingos, M. &
Souza, S.R. 2008. Suitability of Nicotiana tabacum
‘Bel W3’for biomonitoring ozone in São Paulo, Brazil. Environmental Pollution 151: 389-394.
Sharma, G.K., Chandler, C. & Salemi, L. 1980. Environmental pollution and leaf cuticular variation in Kudzu (Pueraria lobata Willd.). Annals of Botany 45: 77-80.
Souza, R.C.O.S. & Neves, L.J. 1996. Anatomia foliar de
quatro espécies de Tillandsia. Bromélia 3: 28-39.
Tresmondi, A.C.C.D.L. & Tomaz, E. 2004. Air pollution
and the influence of sources on Paulinia (Brazil) and surroundings. International Journal of Environment and Pollution 22: 490-506.
Ueda, A.C. & Tomaz, E. 2011. Inventário de emissão de
fontes veiculares da Região Metropolitana de Campinas, São Paulo. Química Nova 34: 1496-1500.
Vollenweider, P., Ottiger, M. & Günthardt-Goerg, M.S.