Abstract
In many engineering structures different energy absorption sys-tems may be used to improve crashworthiness capability of the system and to control damages that may occur in a system during an accident. Therefore, extensive research has been done on the energy-absorbing cells. In this paper, energy absorption in tapered thick walled tubes has been investigated. As a practical case, studies have been focused on the crush element of Siemens ER24PC locomotive. To investigate performance of this part at collision time, it has been modeled in Abaqus software and its collision characteristics have been evaluated. Considering that the crash element is folded at time of collision, an analytical approach has been presented for calculation of instantaneous folding force under axial load. Basis of this method is definition and analysis of main folding mechanism and calculation of average folding force. This method has been used for validation of the results of numeri-cal solution. Since sheet thickness of the crash element is high and may be ruptured at time of collision, some damage models have been used for numerical simulations. One of the three damage models used in this paper is available in the software and coding has been done for two other damage models and desirable damage model has been specified by comparing results of numerical solu-tion with results of laboratory test. In addisolu-tion, authenticity of the desirable damage model has been studied through ECE R 66 standard. To improve crashworthiness characteristic some at-tempts, such as use of metal foam and creation of trigger in suita-ble situations to reduce maximum force resulting from collision, have been performed. Finally though different simulation optimal crush element has been introduced and its performance and effi-ciency have been evaluated.
Keywords
Energy absorption, crush element, damage model, locomotive.
Studying energy absorption in tapered thick walled tubes
P. Hosseini Tehrani a I. Ferestadeh b
a Center of excellence in railway transporta-tion, School of Railway Engineering, Iran University of Science and Technology, Tehran, Iran
b Center of excellence in railway
transporta-tion, School of Railway Engineering, Iran University of Science and Technology, Tehran, Iran
http://dx.doi.org/10.1590/1679-78251433
Latin American Journal of Solids and Structures 12 (2015) 173-204 1 INTRODUCTION
One of the ways of energy absorption during an impact is the use of energy absorbents. These ab-sorbents show different deformations dependent on geometry and loading conditions but plastic deformations in all of them cause kinetic energy dissipation resulting from impact. Dynamic pro-gressive buckling is one of the common energy absorption methods in thin-walled energy absorbents under impact.
Phenomenon of dynamic progressive buckling for a thin-walled energy absorbent with square cross-section is shown in Figure 1.
Figure 1: Dynamic Progressive Buckling in a thin-walled energy absorbent, Abramowicz (2003).
As observed above, folding starts from one end and progresses due to low thickness of energy ab-sorbent. For this reason, this phenomenon is called progressive buckling, Jones (2011).
In thick-walled energy absorbents which ratio of thickness (h) to medium level radius (R) is higher than 0.05, the structure damage is resulted by folding and sheet rupture, Ugural (1999). The reason is high thickness of sheet in these absorbents. Increase of sheet thickness enhances resistance
of ener–y absorbent and p—enomenon of pro–ressive bucklin– doesn’t occur in t—ese absorbents.
Wang and Lu (2002) placed thick-walled circular energy absorbents under dynamic loading and found that what destroys these absorbents is rupture of their sheet under impact. So, these absor-bents are deformed as mushrooming after impact of these absorabsor-bents (Figure 2).
Considering that dimensions of the crash element of Siemens ER24PC locomotive are such that it is regarded as thick-walled energy absorbent. Therefore, rupture of the sheet causes destruction during collision. Then, it is necessary to use damage models for prediction of rupture for accurate modeling of destruction process of this crash element under impact.
Latin American Journal of Solids and Structures 12 (2015) 173-204 and so forth. Rousselier (1987 and 2001) published the damage model later based on continuum mechanics t—eory. T—e recent researc—es on Rousselier’s models show that this model can estimate failure mode of tensile notched bar.
Figure 2: Rupture of sheet in a thick-walled energy absorbent, Wang and Lu (2002).
In this Paper, three damage models i.e. Johnson Cook, GTN and Modified Rousselier damage models have been examined for estimation of damage in testing collision of crush element of Siemens ER24PC locomotive. First, the beginning of damage (for each one of these models) is described and then the necessary information for entering these damage criteria in Abaqus software is explained. By comparing results of modeling with different damage criteria with results of laboratory test, suitable damage criteria has been specified. In the final section, some methods have been presented to increase energy absorption of crush element of the Siemens locomotive.
2 INTRODUCING ER24PC LOCOMOTIVE AND ITS ENERGY ABSORPTION SYSTEM
Siemens ER24PC locomotive has box-shaped structure (closed round) and is equipped with a loco-motive driving cabin. In this locoloco-motive, energy resulting from impact may be absorbed with a structure which has been embedded at the front end of locomotive. This action is performed in some stages and includes reversible components in buffers (behind which are crush elements) and other components of locomotive which are deformed at time of collision.
Latin American Journal of Solids and Structures 12 (2015) 173-204
Figure 3: Equipment in Siemens locomotive for absorption of impact energy.
3 MODELING AND SOLVING WITH FINITE ELEMENT METHOD
The crushing element of Siemens locomotive has been modeled with Abaqus software. The crush element is conical with rectangular side. dimensions of the smaller base are 400mm×430 mm and dimensions of the larger base are 480 mm×800 mm. Length of the crash element is 830 mm and its thickness is 15 mm. since its thickness is not low compared with its dimensions, Solid element was used for modeling. Young's modulus for the desired steel is 200, Poisson coefficient is 0.3 and densi-ty is equal to 7800 kg m⁄ . Crush element is connected to a rigid base on the one side. A rigid sheet has been used as impactor in modeling. The centralized mass of 100 tons has been applied in center of this rigid sheet which is equivalent to mass of the train.
Surface to surface algorithm has been used for contact of rigid impactor and crush element and general contact algorithm has been used for contact of different parts of the crush element with each other at time of impact. In both cases, friction coefficient has been considered equal to 0.3 which is the friction coefficient for steel to steel contact. The crush element is completely bound on the side of its base and the rigid sheet collides with it from the other side at the speed of 120 � /ℎ . This speed is motion speed of Siemens locomotive in Iran lines. Figure 4 shows modeling of the crush element of Siemens locomotive in Abaqus software.
Latin American Journal of Solids and Structures 12 (2015) 173-204 The crush element of Siemens locomotive has been made from S355J2G3 steel which is mostly ap-plied in rail industries. Since strain rate is very important in issues relating to collision and should be applied in modeling, stress-strain plot of S355J2G3 steel in different strain rates is given in Fig-ure 5, Wall (2002).
Figure 5: Stress-strain plot of S355J2G3 steel in different strain rates, Wall (2002).
3.1 Meshing
C3D8R element has been used to mesh the crush element. Based on thickness of the desired part, 4
elements were used so t—at effects of linearization based on t—ickness don’t affect t—e results. To
ensure that the obtained results are independent of the number of element, mesh sensitivity analysis was done. In this analysis, when the number of nodes was increased or elements became finer, value of a quantity was recorded in a node. It was observed that when the number of nodes increased excessively or the elements became excessively finer, there will be errors in the obtained answers. At the end, the best meshing in which results become almost independent of the number of elements is found as 218358 nodes and 17228 elements. In this area, the plot will become almost horizontal and it means that results are independent of the number of nodes. Figure 6 shows meshing of the crush element.
Latin American Journal of Solids and Structures 12 (2015) 173-204
4 ANALYTICAL SOLUTION FOR CALCULATION OF FOLDING FORCE
Considering that the crash element is folded at the beginning of collision, the following analytical solution has been presented to estimate instantaneous folding force. The presented analytical solu-tion has been used to validate results of numerical solusolu-tion of the previous secsolu-tion.
4.1 Essential folding mechanism
Hayduk and Wierzbicki (1984) and Wierzbicki and Abramowicz (1983) elaborated essential folding mechanism based on two types of elements a and b. any folding including symmetrical folding, asymmetrical folding, expanded folding, cross folding and so forth, can be modeled by combining these two elements. These two elements are shown in Figure 7.
Figure 7: Base elements for essential folding mechanism, Hayduk and Wierzbicki (1984).
Basis of theoretical work of Hayduk and Wierzbicki (1984) and Wierzbicki and Abramowicz (1983) is, concept of work and energy for estimation of folding force. For this purpose, the dissipated ener-gies rate is calculated based on the defined essential folding mechanism and folding force is calculat-ed by equalizing the dissipatcalculat-ed energies to the work performcalculat-ed by the external force. As shown in Figure 8, the first folding created during collision is the expanded folding in crush element of Sie-mens locomotive. Therefore, four elements of type b should be used to model this type of folding.
Latin American Journal of Solids and Structures 12 (2015) 173-204 4.2 Calculating dissipated energy rate
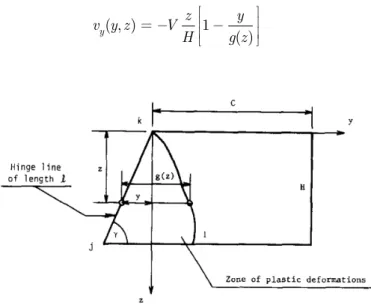
Hayduk and Wierzbicki (1984) defined essential folding mechanism according to Figure 9. A rectan-gular element was considered which is transformed into trapezoid. It was also assumed that dis-placement vector has only one component (� ) and also plastic deformation has been limited to jkl quasi-triangle area. Hayduk and Wierzbicki (1984) assumed border between plastic area and area without deformation as a desirable function of z. By approximating a linear velocity change, speed in direction of y, that is a function of y and z, is:
( , ) 1
( )
y
z y
v y z V
H g z (1)
Figure 9: Rectangular deformation to trapezoid element due to plastic deformation, Hayduk and Wierzbicki (1984).
Non-zero components of strain rate tensor is calculated as follows:
( )
y
V z
H g z (2)
( )
y z y
yz
v v v y d z V
V
z y z H dz g z H (3)
Where:
2
H V
sin (4)
At the end, energy dissipation rate resulting from plastic bending of the adjacent plates around the hinge axis is calculated as follows:
(z)
1
0 0
( )
H g
y y yz yz
Latin American Journal of Solids and Structures 12 (2015) 173-204
By substituting Relations 2 and 3 in Relation 5 and neglecting shear strain rate, energy dissipation rate resulting from plastic work is as follows, Hayduk and Wierzbicki (1984):
2
1 2 0 2
sin
H
E M
h (6)
Where, h is thickness of the plate which has been folded and M is plastic bending moment which is equal to the following value for a rectangular beam or cross section:
2
0 0
1 4
M h (7)
As it is evident in Figures 7 and 9, α= and γ= 9 at time of folding. When folding starts, angle
α becomes large and angle γ becomes small. At time of folding, angle γ is obtained as follows in terms of α, Wierzbicki and Abramowicz (1983):
1 tan
sin (8)
The dissipated energy rate obtained from plastic work around fixed hinge with length of C is equal to, Hayduk and Wierzbicki (1984):
2 0
E M C (9)
Finally, dissipated energy rate obtained from transverse plastic hinge is equal to, Hayduk and Wierzbicki (1984):
3 0
sin
H
E M (10)
is crossing angle of plates (shown in Figure 7) and is associated with the following Relation with :
2
cos sin (11)
4.3 Calculating instantaneous folding force
To calculate instantaneous folding force, sum of internal dissipated energies rate in essential folding mechanism is calculated as follows:
1 2 3
int
E E E E (12)
Where Ė ،Ė and Ė are the same as Relations 6, 9 and 10.
The work performed by external force P for compressing essential folding mechanism is equal to multiplication of force by compactness distance.
.
ext
Latin American Journal of Solids and Structures 12 (2015) 173-204 Where � shows reduction of distance between the upper edge and lower edge of the essential folding mechanism and is calculated according to Figure 10 as follows:
Figure 10: half wavelength of folding
2 (1H cos ) (14)
2H, known as the folding wavelength, is length of a part of column or essential folding mechanism in which a full fold is formed.
Considering Relations 13 and 14, work rate performed by external force is equal to:
. 2 . .
ext
E P PH sin (15)
Therefore, considering this Relation:
ext int
E E (16)
The external work rate performed for compaction of essential folding mechanism is equal to internal dissipated energy rate and the following relation is obtained.
1 2 3
2PH sin. . E E E (17)
Considering that part of folding in crush element of Siemens locomotive can be assumed as a unicel-lular rectangular column (Figure 8), this geometry can be created by connecting four folding ele-ments as shown in Figure 7. In this case, length of each side is equal to 2C. Therefore, based on Figure 9, energy value of ̇ and ̇ should be sixteen fold and ̇ value should be eightfold to cre-ate four similar elements as shown in Figure 7 (because ̇ is dissipated energy resulting from plas-tic work around transverse plasplas-tic hinge and this boundary between upper and lower elements is common). On the other hand, the calculated ̇ in Relation 9 is bending around horizontal fixed hinges in case edges of each essential folding element is simple support. These horizontal edges are fixed for the crush element of Siemens locomotive. Therefore, energy of ̇ should considered two fold. As a result, Relation 17 is corrected as follows:
1 2 3
2PH sin. . 16E 32E 8E (18)
Now, Ė ،Ė and Ė have been rewritten as follows in terms of angle of :
Latin American Journal of Solids and Structures 12 (2015) 173-204
2 2
1 2 0 2 2 0 cos .
sin
H H
E M M
h h (19)
̇ is expressed in terms of angle of and should not be rewritten.
2 0
E M C (20)
̇ can be rewritten in terms of considering Relations 8, 10 and 11:
2 0
3 0 4
2 cos sin 1 sin
sin 1 sin
M H H
E M (21)
By substituting Relations 19, 20 and 21 in Relation 18, the following Relation is obtained:
2 2
0
0 0 4
16 cos sin 1 sin
2 . . 32 cos . 32
1 sin
M H H
PH sin M M C
h (22)
In case two sides of Relation 22 are divided by . � . ̇, the following Relation is obtained in terms of angle for instantaneous folding force.
2
0 0
0 4
16 8 cos 1 sin
16 co
sin 1 sin
M C M
H
P M t
h H (23)
Average folding force is obtained by integrating the above relation based on angle from 0 to � and according to work ofAbramowicz and Jones (1984), it is equal to:
1 2 0 36.83 10.39 m P c
M h (24)
In equation (24) an effective crushing distance of 0.77 is used. The obtained force is instantaneous folding force in quasistatic state. In order to obtain instantaneous folding force in dynamic state, effect of strain rate should be also considered.
4.4 Sensitivity to strain rate
Effect of strain rate on metal rectangular absorbents which have been subjected to dynamic loading is given in work of Abramowicz and Jones (1986). Details of this relations are given in Abramowicz and Jones (1986). Finally, ratio of average impact force of dynamic loading to average impact force of quasistatic loading for steel is as follows:
1
1 0.25
d p m s m P V cD P (25)
Latin American Journal of Solids and Structures 12 (2015) 173-204 4.5 Calculating average and instantaneous folding forces in crush element of Siemens
locomotive and comparison with numerical solution
Numerical simulations were performed with Abaqus software. During this term, 0.49 m of length of crush element is crippled. A limited simulation time of 0.015s was taken to prevent the bottom out effect. Force diagram in terms of displacement is shown in Figure 11.
Figure 11: Diagram of folding force in terms of displacement resulting from numerical solution.
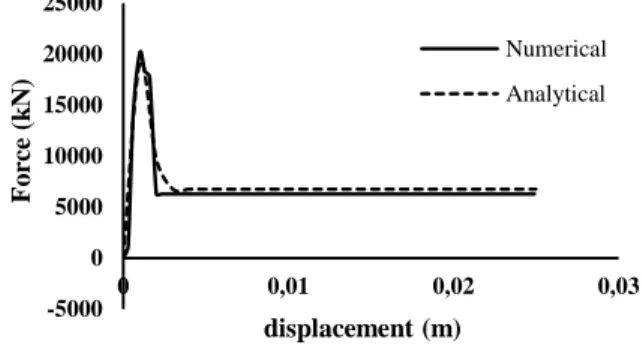
Considering Relations 23, 24 and 25, instantaneous and average folding force has been calculated and the results have been compared with the numerical solution results (Figure 11). For the crush element of Siemens locomotive, parameters c, h and σ were considered as ℎ = , � = � and � = . (considering material and geometry of the first fold (Figure 8)). Figure 12 and Table 1 show acceptable agreement of the results of numerical and analytical solution.
Figure 12: Diagram of instantaneous and average folding force in terms of folding distance from numerical and analytical methods.
maxim um force (kN ) average force (kN )
Analytical solution 19172.7 6765.8
Numerical solution 20149 6288.4
Error percent 4.85 7.6
Table 1: Comparing results of numerical and analytical solution.
-5000 0 5000 10000 15000 20000 25000 0 ,0 0 0 ,0 4 0 ,0 8 0 ,1 2 0 ,1 5 0 ,1 9 0 ,2 3 0 ,2 7 0 ,3 1 0 ,3 4 0 ,3 8 0 ,4 2 0 ,4 6 displacement (m) Fo rc e (k N) -5000 0 5000 10000 15000 20000 25000
0 0,01 0,02 0,03
Latin American Journal of Solids and Structures 12 (2015) 173-204
By comparing the slope of two diagrams, it is observed that the analytical solution anticipates with a good precision the change of crushing force versus the folding distance in the first fold.
The under estimation of analytical solution compared to the numerical values is due to the fact that the mechanisms which dissipate energy in structure (appearing in Relation 23) include only expansion and bending deformations. On the other hand, considering that two answers are close to each other, the assumed deformation mechanisms in calculations can be regarded reasonable and suitable despite their low difference.
Once results of the simulation were authenticated, damage models have been used to solve the related problem more accurately and take more agreement between the simulated problem and reality.
5 USING DAMAGE MODELS IN SIMULATION
For this purpose, three Johnson Cook, GTN and Modified Rousselier damage models have been used. First, the beginning of damage (for each one of these models) is described and then the nec-essary information for entering these damage criteria in Abaqus software is explained. By compar-ing results of modelcompar-ing with different damage criteria with results of laboratory test, suitable dam-age criteria has been finally specified.
Damage models can be classified into two general classes: continuous macroscopic damage mod-els (damage modmod-els in Abaqus software) and microstructural damage modmod-els. The use of continuous damage models is simple in finite element software but there is need for laboratory information to calculate damage parameters. In microstructural damage models which describe effect of triaxial stress on damage behavior while damage parameters are independent of geometry of the part.
5.1 Continuous damage models
These models have been created based on macroscopic state variables. Such state variables can be a component of stress tensor, strain tensor, their changes and sometimes temperature and strain rate. Different tests have shown that damage process which leads to sudden fracture of object is related to history of loading. Therefore, some of these damage variables have been used for determination of effect of loading history.
Such models are simpler than the microstructural damage models. In these models, soft metal is idealized as a pore-less continuous substance. In continuous damage models, damage acts as a sepa-rate variable which is independent of t—e material’s stren–t—. In t—ese models w—ic— are also known as cumulative damage strain models, it is assumed that history of plastic deformation of substance leads to damage. When the damage variable is more than its critical value, fracture will occur. Crit-ical value of damage variable for each substance depends on its weight function and this weight function is a function of stress, temperature, strain rate and so forth. In other words, cumulative damage strain model is written as follows:
0
( , , , )
c
p
D f T d (26)
Latin American Journal of Solids and Structures 12 (2015) 173-204
5.1.1 Johnson – Cook damage model
Johnson and Cook expanded their primary model by considering a model for fracture based on cu-mulative damage. Execution of Johnson and Cook model in Abacus requires other parameters. Johnson - Cook model based on cumulative damage is as follows:
1 2exp 3 (1 4ln )(1 5 )
F
H eff
P
D D D D D T (27)
Where = ∑����� and fracture occurs when = .
σ is effective stress and P is effective pressure.
This model is similar to the yield strength model in which effects of triaxial stress, strain rate and local temperature have been included in it. This Johnson Cook damage model requires five constants of matter.
Based on work of Mirza et al. (1996), the information obtained from numerical tests and simu-lations in different strain rate and different triaxial stress levels has been used for obtaining con-stants in Johnson Cook damage model. To use this model, only limited number of concon-stants is necessary while more constants are required for use of fracture models of soft metals, Seaman et al. (1987) and Needleman and Tvergaard (1984). The results which are mentioned later relate to mild steel which is highly similar to S355J2G3 steel in terms of mechanical characteristics. Based on results of Mirza et al. (1996), it is specified that fracture strain is highly dependent on triaxial stress of ��
� w—ile it doesn’t c—an–e considerably in different strain rates. Tests —ave been performed at room temperature. Therefore, constant in Equation 27 is equal to 0 under these conditions. The first term in Equation 27 which follows the term presented by Hancock and Mackenzie (1976) shows that strain exponentially decreases with increasing triaxial stress. In the absence of infor-mation more than 2.5 for ��
� and small value of fracture strain for average ��
� , it can be assumed that value is zero for mild steel. Two constants of and have been calculated by passing curve through the information obtained from test. Constant can be calculated considering refer-ence strain rate. Finally, the required constants for Johnson Cook criterion are given in Table 2.
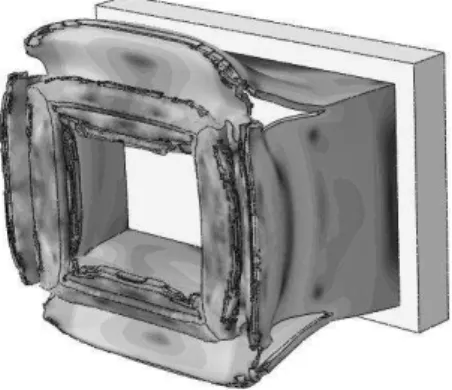
Simulation was done in 0.015 s. The information in Table 2 was used for Johnson Cook crite-rion in Abaqus software. Stress contour is shown in Figure 13. It is observed that the crash element is ruptured from the corners and this rupture is expanded to other parts.
Reference strain rate transition
temperature melting
point
0.02 0
0 0
-0.132
2.5 8.54
0
Latin American Journal of Solids and Structures 12 (2015) 173-204
Figure 13: stress contour for Johnson Cook model.
5.2 Microstructural damage models
Microstructure of metals is complex and includes grains, secondary phase parties, deposits and pores. Unlike hypotheses of macroscopic damage models, substance is assumed as a set of heteroge-neous cells in damage models. Cumulative damage process which leads to Ductile Fracture is very complex in these damage models. Metallurgical observations show that fracture of ductile metals fracture almost start with nucleation, growth and formation of micropores under uniform tensile stresses. Therefore, substances are structurally regarded porous.
Two GTN and corrected Rousselier microstructure damage models are introduced later.
5.2.1 GTN damage model
In Continuum Mechanics, a model was presented for plasticity of porous metals by Gurson (1977) and its initial yield surface was later corrected by Tvergaard (1982) and Tvergaard and Needleman (1984). This Equation is known as Gurson- Tvergaard and Needleman model or GTN which is pre-sented as follows:
2
* 2 *2
1 3
2 1 0
2
eq q f cosh q m q f (28)
In this relation, �� is Von- Mises equivalent stress, � is hydrostatic stress, � is stress flow for material matrix, and f is growth of pores. Parameters of , , are the parameters introduced by Tvergaard (1982). �∗ is a function which shows damage resulting from formation of pores when pore volume reaches critical value of �.
*
c
c c c
f for f f
f
Latin American Journal of Solids and Structures 12 (2015) 173-204 *
U c
F c
f f
k
f f
According to this Equation, when � reaches critical value of ��, crack will appear and the material will lose stress tolerability when � reaches��∗ (��∗=�1) as final enlargement of pore volume. Consid-ering that GTN damage model is not available among the damage models of Abaqus software, sub-routine has been used to apply this damage model in the software. The subsub-routine used here is Vumat subroutine which is used for definition of the complex models of materials and also the mod-els which are not available in graphic medium of software. In Vumat, elastic characteristics are defined for material matrix, then yield and plastic characteristics of material are defined and finally it is mentioned for software that if stress value is higher than the permissible value, it will start deleting the desired elements.
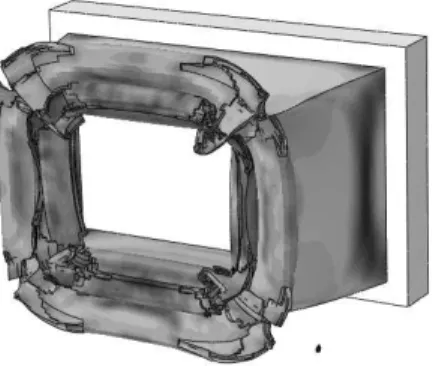
As evident in Equation 28, there is need for some input parameters for definition of this damage model, which relate to material of the desired substance. Here, information in work of Tu et al. (2010) has been used to include input parameters for GTN damage model for the crash element of Siemens locomotive. The available information has been given in Table 3 from Tu et al. (2010).
Simulation was done within 0.015 s. in this case, time of solution in the program increased due to the presence of subroutine. At the end, stress contour is shown in Figure 14.
q q q εn sn fn fc f
1.5 5 2.25 0.2 0.1 0.01 0.05 0.2
Table 3: Input information for use of GTN damage model.
Figure 14: stress contour for GTN damage model.
5.2.2 Modified Rousselier damage model
Latin American Journal of Solids and Structures 12 (2015) 173-204
which is called damage variable. Rousselier damage model includes yield potential, stress-strain relation and changes of damage variable. Yield potential function which has been shown in Equa-tion 30 is a relaEqua-tion which relates damage growth rate to hydrostatic stress.
1
1
( ) 0
eq R p Df exp m
(30)
In this Relation, � = � + � is Cauchy stress tensor, � is deviatoric stress, � is hydrostatic stress , is the second order unit tensor, �� is Von Mises equivalent stress, � = − � ⁄ − � is relative density , f is damage variable or enlargement of pore volume , � is initial pore volume in material , � is material hardness function , ، is equivalent plastic strain and and � are ma-terial constants for Rousselier Relation. Usually = (Li et al. (2011), Rousselier (1987) and Rousselier (2001)).
The damage variable for modified Rousselier damage model is obtained as follows:
0
( ( ))
0 0
( ( ))
( ( ) ) w
w
D k p
w
D k f
f
D k Df e Df (31)
Where
2 3 3 27
2 eq
J
(32)
To use the modified Rousselier damage model, coding should be done in the related model. Consid-ering that the modified Rousselier damage model is not among the damage models in ABAQUS software, Vumat subroutine should be used to enter it in the model. Work of Guo et al. (2013) has been used to write equations and solve them numerically. To obtain parameter of the material ( and �), from work of Rousselier (1987) has been used in which Rousselier damage model has been used for steel material and mechanical characteristics of steel have acceptable agreement with me-chanical characteristics of steel applied in crash element of Siemens locomotive. Considering work of Rousselier (1987), values of � = 9 � � and = have been used in numerical simulations.
Like the previous damage models, simulation was done in 0.015 s. at the same time, time of so-lution completeness in software was elongated due to the presence of subroutine. At the end, stress contour is shown in Figure 15.
5.3 Comparing different damage models
Latin American Journal of Solids and Structures 12 (2015) 173-204 Figure 15: Stress contour for the modified Rousselier damage model.
Model E(MJ) � (kN) Reduction of initial peak of force displacement diagram (%)
Reduction of ener-gy absorption (%)
Johnson Cook 2.81 19624 31 3.5
GTN 2.53 19475 38 4.3
modified
Rousselier 2.62 16917 36 16.9
Table 4: Comparing characteristics of collision in simulation with different damage models.
Considering results of Table, it is found that use of damage models reduces maximum force. The reason is rupture of object at time of collision which causes the object to show less resistance against initial deformation. Of course, this subject reduces energy absorption as well. Now, it should be determine what damage model can show collision behavior of the crash element of Siemens lo-comotive truly.
5.4 Determining suitable damage model
To determine suitable damage model, results of simulation with different damage models should be compared with laboratory results. Therefore testing information of an almost similar crush element has been used to select the suitable damage model. Work on this crush element has been performed
Latin American Journal of Solids and Structures 12 (2015) 173-204
Figure 16: Designed model based on information of İnce and Türkmen (2011).
Figure 17: Diagram of force in terms of time for three damage models and laboratory results.
5.4.1 Interpretation of results
These diagrams can be studied from different perspectives. The first point which attracts attention is that the non-dama–e criterion doesn’t show correct results. As shown in Figure 17, the curve which relates to results of simulation irrespective of damage criterion has the highest difference from the curve relating to laboratory results. Since thickness of the crash element is high, buckling and folding mechanisms are created less in structure during collision. Therefore, the event which occurs during collision is rupture of structure. Therefore, simulation of testing collision of the part of which thickness is high gives false results irrespective of damage criterion. Another point which is observed is that diagram of continuous damage model (Johnson Cook model) has higher error than the dia-grams of microstructure damage models (GTN and modified Rousselier damage model). The reason is that the continuous damage models consider the object continuously and without pore. This fea-ture causes to consider damage process to be independent of plastic behavior of the materials in these damage models. In other words, when damage is expanded in the material, plastic
characteris-tics of materials remain unc—an–ed in t—ese dama–e models. T—erefore, dama–e doesn’t affect
me-chanical characteristics of material gradually but occurs as a sudden loss in stress-strain diagram of material and this simplification makes fracture behavior of material far from reality. In
microstruc--50 0 50 100 150 200 250 300 350
0 10 20 30 40 50
Fo
rc
e(
k
N
)
Time(ms)
Experimental No damage Johnson-Cook GTN
Latin American Journal of Solids and Structures 12 (2015) 173-204 ture damage models such as material are considered as porous while damage gradually affects me-chanical characteristics of material due to growth of pores, their formation and formation of larger pores. This point caused sudden loss in diagram relating to Johnson Cook model while in GTN damage model and the modified Rousselier damage model, the curve is not suddenly dropped like laboratory results and gradually decreases. The reason for success of microstructural models is that a new yield function is introduced in these models which relates plasticity to cumulative damage and damages gradually shows its effect on mechanical characteristics of material.
It is also observed that among the microstructure damage models, GTN damage model has higher deviation from laboratory results than the modified Rousselier damage model. The reason for this deviation is that no sentence has been considered for fracture resulting from shear in GTN model. As shown in Equation 28, growth of pores in this model is related to only hydrostatic stress. Therefore, shear deformation cannot be shown considering this damage model while fracture result-ing from shear force is one of the damage mechanisms which GTN cannot show durresult-ing collision. But in the modified Rousselier damage model, it was mentioned that a sentence has been consid-ered for considering fracture resulting from shear. Therefore, as shown in Figure 17, the modified Rousselier damage model has the best agreement with laboratory results. Therefore, the best model for estimation of impact conditions of the crash element of Siemens locomotive should be the modi-fied Rousselier damage model.
5.5 Comparing energy absorption rate with energy absorption standard
Considering the previous sections, it was specified that among the mentioned damage models, the modified Rousselier damage model estimate conditions of testing collision of the crash element of Siemens locomotive well. In this Section, results of simulation with considering the modified Rousse-lier damage model have been compared with the conditions mentioned in ECE R 66 standard. Con-sidering this standard, computer modeling is correct when the following two conditions are estab-lished concurrently:
1- Hourglass energy value should be less than 5% of total energy. 2- Energy ratio parameter should not exceed 1±0.05.
Figure 18 shows total energy and hourglass energy in a diagram. Considering this Figure, it is clear that hourglass energy value is standard in the mentioned limit because maximum hourglass energy (0.39 MJ) is equivalent to 0.7% of total energy (55.93 MJ). Therefore, the first standard condition is established.
Figure 19 shows energy ratio parameter in terms of time. In this Figure, the second standard condition has been established because energy ratio parameter varies from 0.99994 to 1.00003 which
is in t—e determined standard limit and doesn’t exceed t—e limits referred in t—e standard.
Latin American Journal of Solids and Structures 12 (2015) 173-204
Figure 18: Diagram of energy in terms of time.
Figure 19: Diagram of energy ratio in terms of time.
6 IMPROVING CHARACTERISTICS OF COLLISION OF THE CRASH ELEMENT
To improve characteristics of collision, the following two actions have been taken:
1- Use of foam as energy absorbent for increase of the absorbed energy 2- Creation of trigger to reduce maximum force
Effect of use of each case has been studied with different simulations.
6.1 Use of foam for increase of the absorbed energy
There are different methods to improve energy absorption of the crash element. One of the best methods is use of foams for absorption of more energy during impact. Hanssen et al. (1999), Hanssen et al. (2000) and Hanssen et al. (2001) studied thin-walled tubes filled with aluminum foam through laboratory and numerical solution to show role of aluminum foam in energy abrosption. His studies show that use of aluminum foam as energy absorbent in applications relat-ing to impact increases energy absorption but it increases force resultrelat-ing from impact on the other hand.
-10 0 10 20 30 40 50 60
0 0,005 0,01 0,015 0,02
Energ
y
(M
J
)
Time(s)
hourglass energy
Total energy
0,99992 0,99994 0,99996 0,99998 1 1,00002 1,00004
0 0,005 0,01 0,015 0,02
Energ
y
ra
ti
o
Latin American Journal of Solids and Structures 12 (2015) 173-204 Here, aluminum foam has been used as energy absorbent. The aluminum foam which has been considered here is produced with continuous casting process and is recognized as Hydro Aluminum AS. Density of this foam is 340 kg m⁄ , its Young's modulus is 0.948 and its Poisson coefficient is 0.325. Geometrical dimensions of the desired foam are such that empty volume of the crash element is completely filled by putting it inside the crash element. Mass of the aluminum foam with the mentioned geometrical dimensions is 68.34 kg and mass of the component increases by 11.3% by putting it inside the crash element. Hanssen et al. (2002) described characteristics of strain harden-ing characteristics of aluminum foam with a simple equation (Equation 33). The followharden-ing strain hardening characteristics have been suggested for uniaxial and hydrostatic loading conditions.
1
1
p D
D
e ln
e e
e
(33)
0
1 f
D
f
e
The first term of σp indicates the initial surface of the wide area which indicates uniaxial stress or hydrostatic pressure after passing through the initial elastic area. It is found that this term is inde-pendent of strain e. The second term relates to linear strain hardening and slope of strain curve with strain hardening constant is shown. The last term indicates nonlinear strain hardening which has been described with constant (proportion coefficient) and (shape factor).
Hanssen et al. (2002) optimized the presented model based on uniaxial tests on the aluminum foam sample. At the end, as shown in Figure 20, it was specified that the presented model is able to es-timate all measured stress-strain curves with good precision.
Equation 33 along with the optimized information in Table 5 gives complete description of strain hardening characteristics of aluminum foam for use in numerical simulations.
Latin American Journal of Solids and Structures 12 (2015) 173-204
Model description: [��, , ⁄ , , ��] = � + � ���� �
Factor σp ⁄ γ Ep
C 0 0 0.105 0 0
C 1720 240 9.85 159 2
n 2.89 1 3 1.77 3.33
Table 5: Coefficients used in strain hardening model of the aluminum foam, Hanssen and Hopperstad (2002).
6.1.1 Results of simulation
Simulation was done with the modified Rousselier damage model and by putting aluminum foam material with the specifications which were mentioned in the previous section inside the crash ele-ment of the Siemens locomotive. Stress contour at time of 0.013 s is shown in Figure 21. Diagram of energy absorption for the empty crash element and crash element filled with foam is shown in Fig-ure 22 and it is found that energy absorption increases by 24% in the presence of foam while maxi-mum force grows only by 0.2% (Figure 23).
Effect of foam filling may be studied using energy-absorbing effectiveness factor which is rec-ommended by Jones (2010). Following relation is suggested to consider foam filling effect in tubes:
2 0 0 3
8 f r( s f f)
GV
A A (34)
Which G is mass of striker, � is initial impact velocity, f is nal crushing displacement of the
composite, r is rupture strain, and f are mean ow stress of t—e metal S—ell and foam and � ,
� are the mean cross-sectional area of the Shell and foam.
According to Equation 34, energy-absorbing effectiveness factor in crush element of ER24PC locomotive with foam filling is about 1.67 times more than empty case.
Latin American Journal of Solids and Structures 12 (2015) 173-204 Figure 22: Diagram of Energy absorption in terms of displacement
for the empty crash element and crash element filled with foam.
Figure 23: Diagram of force in terms of displacement for the empty crash element and crash element filled with foam.
6.2 Putting trigger for reduction of maximum force
Creation of trigger in tubes and crash elements can improve their impact properties. Effect of trig-ger in the desired geometry depends on place of trigtrig-ger in the part, shape, depth and dimensions. Langseth et al. (1994) showed that prebuckling in tubes reduced their decomposition force. In this case they created prebuckling in tubes by applying preload and found that deformation force in-creases. El-Hage et al. (2005) conducted a numerical study on effect of creation of trigger and crea-tion of a triangular pore near loading area in tube. They concluded that the initial force for creacrea-tion of fold can be considerably controlled with trigger. In this Section, considering the damage model specified in the previous sections, attempt has been made to improve collision characteristics by creating trigger in crash element of Siemens locomotive. For this purpose, dimensions, shape and location of trigger were specified with different simulations and then results have been compared with the results in the absence of trigger.
-0,5 0 0,5 1 1,5 2 2,5 3 3,5
0 0,1 0,2 0,3 0,4 0,5 0,6
a
b
so
rbed
energ
y
(M
J
)
displacement(m)
empty
foam
-5000 0 5000 10000 15000 20000
0 0,1 0,2 0,3 0,4 0,5 0,6
Fo
rc
e
(k
N
)
displacement(m)
empty
Latin American Journal of Solids and Structures 12 (2015) 173-204 6.2.1 Specifications of trigger
For this purpose, diagram of force in terms of displacement shows that peak a diagram has been created at time of 0.00475 s. To find creation of trigger in the crash element, stress contour is stud-ied at time of 0.00475 s and location of trigger in the crash element is specifstud-ied. The related idea is that location of trigger is exactly the place which there is the highest stress. As shown in figure 24 specified trigger is rectangular with length, width and depth of 18.32 cm, 1.49 cm and, 11 mm re-spectively. In the next section it is shown that trigger with these specifications has the best charac-teristic.
Figure 24: Studying stress contour to estimate primary location of trigger.
6.2.2 Simulation results
Totally 18 models with different triggers were simulated to determine optimal length of 5 models, optimal width of 3 models, optimal depth of 7 models and optimal shape of 3 models. Results of simulation are given in Tables 6-9. Values inserted in Table for the crash elements without trigger have been calculated. In Table 6, the width, depth and shape of the trigger are fixed and its length is varied (the width and depth are 1.49 cm, and 3.5 mm, and the shape is rectangular). In Table 7, the length, depth and shape of the trigger is fixed and its width is varied (the length according to the best result of table 6 is chosen 18.32 cm, depth is 3.5 mm and shape is rectangular). In Table 8, the length, width and depth of the trigger are fixed and its shape is varied (the length is 18.32 cm, width using result of table 7 is 1.49 cm and depth is 3.5 mm). Finally in table 9, the length, width and shape of the trigger are fixed and its depth is varied (the length is 18.32 cm, width is 1.49 cm
Latin American Journal of Solids and Structures 12 (2015) 173-204 M odel
R eduction of initial peak of force displacement diagram
(% )
R eduction of energy absorption (% )
Without trigger -
-Trigger with length of
18.32 cm 0.42 5.11
Trigger with length of
36.64 cm 1.91 8
Trigger with length of
27.48 cm 1 7.44
Trigger with length of
9.16 cm -0.4 6.43
Trigger with length of
13.74 cm 0.07 6.04
Table 6: Trigger with different lengths.
M odel
R eduction of initial peak of force displacement diagram
(% )
R eduction of energy absorption (% )
Without trigger -
-Trigger with width of 1.49
cm 0.42 5.11
Trigger with width of 2.98
cm 0.46 6.02
Trigger with width of 0.75
cm 0.14 7.94
Table 7: Trigger with different widths.
M odel
R eduction of initial peak of force displacement diagram
(% )
R eduction of energy absorption (% )
Without trigger - -
Rectangular trigger 0.42 5.11
Trigger with sharp edges 0.21 5.86
Elliptical trigger 0.29 11.58
Latin American Journal of Solids and Structures 12 (2015) 173-204 M odel
R eduction of initial peak of force displacement diagram
(% )
R eduction of energy absorption (% )
Without trigger - -
trigger with depth of 2 mm -0.45 4.19
trigger with depth of 5 mm -0.02 6.15
trigger with depth of 7 mm 0.41 4.87
trigger with depth of 10 mm 2.35 5.65
trigger with depth of 11 mm 4.49 5.74
trigger with depth of 11.5
mm 4.36 6.42
trigger with depth of 12.5
mm 6.26 8.5
Table 9: Trigger with different depths.
The presented Tables show that rectangular trigger with length of 18.32 cm, width of 1.49 cm, and depth of 11 mm has the best performance in terms of increase of energy absorption and reduction of maximum force.
The similar trend has been performed for two other sides of the crash element. The difference is that location of maximum stress is not specified for creation of trigger for these two sides. For this reason, location of trigger should be first specified and then its dimensions and shape should be optimized. To determine location of trigger, 5 models have been considered as shown in Figure 25. Results of simulation are given in Table 10.
Latin American Journal of Solids and Structures 12 (2015) 173-204 M odel
R eduction of initial peak of force displacement diagram
(% )
R eduction of energy absorption (% )
Without trigger -
-1 0.75 2.86
2 1 3.67
3 0.62 4.38
4 0.94 4.88
5 0.90 1.31
Table 10: Different locations of trigger in crash element.
As shown in Table 10, model 4 has the best performance.
12 different models have been considered for determination of optimal dimensions of these two sides of the crash element of Siemens locomotive and results of simulation are given in Table 11-14.
M odel
R eduction of initial peak of force displacement diagram
(% )
R eduction of energy absorption (% )
Without trigger -
-Trigger with length of
24.16 cm 0.90 1.31
Trigger with length of
36.24 cm 1.8 1.89
Trigger with length of
18.12 cm 0.49 1.5
Trigger with length of
12.08 cm -0.01 0.95
Latin American Journal of Solids and Structures 12 (2015) 173-204 M odel
R eduction of initial peak of force displacement diagram
(% )
R eduction of ener-gy absorption (% )
Without trigger - -
Trigger with width of 1.45 cm 0.9 1.31
Trigger with width of 2.9 cm 2.19 4.18
Trigger with width of 0.73 cm 1.12 3.63
Trigger with width of 2.18 cm 2.46 4.53
Trigger with width of 4.35 cm 2.29 4.39
Table 12: Trigger with different widths.
M odel
R eduction of initial peak of force displacement diagram
(% )
R eduction of energy absorption (% )
Without trigger -
-Rectangular trigger 1.8 1.89
Trigger with sharp edges 7.05 6.72
Elliptical trigger 1.99 13.41
Table 13: Trigger with different shapes.
M odel R eduction of initial peak of force displacement diagram
(% )
R eduction of energy absorption (% )
Without trigger - -
trigger with depth of 2 mm 0.38 3.89
trigger with depth of 5 mm 3.17 3.52
trigger with depth of 7 mm 7.05 6.72
trigger with depth of 10 mm 15.45 8.27
trigger with depth of 11 mm 18 8.91
trigger with depth of 11.5 mm 19.12 10.36
trigger with depth of 12.5 mm 21.21 11.32
Latin American Journal of Solids and Structures 12 (2015) 173-204 The presented Tables show that the trigger with sharp edges with length of 36.24 cm, width of 1.45 cm and depth of 11 mm has the best performance in terms of increase of energy absorption and reduction of maximum force.
6.3 Conclusion
Considering results of the previous sections and optimizations for length, width, shape and depths of trigger in all four sides of the crash element, results of the previous section were used and per-formance of the optimal triggers was studied on each side and results have been compared with the model without trigger and model which all four sides have trigger. For simplicity, we name the model without trigger as model A, the model of which two sides have rectangular trigger as model B, the model of which two sides have trigger with sharp edges as Model C and model of which all four sides have trigger as model D. at the end, the model which has the best performance has been selected as desirable model.
M odel R eduction of initial peak of force displacement diagram
(% )
R eduction of energy absorption (% )
A - -
B 4.49 5.74
C 18 8.91
D 24.05 20.49
Table 15: Comparing four models A, B, C and D.
Results of Table 15 show that trigger with depth of 11 mm (sharp edge of model C) has the best performance. Use of this trigger with the given specifications reduces the initial peak of force displacement diagram by 18% while energy absorption is reduced only by 8.91%.
6.4 Selecting optimal model
Latin American Journal of Solids and Structures 12 (2015) 173-204 6.4.1 Results of simulation
Simulation has been done in 0.015 s like the previous sections. Results are shown in Table 16. Val-ues inserted in Table have been calculated based on reference model (model 1).
M odel
R eduction of initial peak Force displacement diagram
(% )
Energy absorption increase (% )
without trigger and foam (model 1)
- -
with foam(model 2) -0.2 24
with trigger(model 3) 18 -8.91
with foam and trigger (model 4) 16 -0.6
Table 16: Comparing four models for recognition of optimal model.
Results of Table show that models 2 and 4 are optimal models. In case the goal is to increase ener-gy absorption, it is better to use model 2. It means that the crash element which contains foam absorbs 24% more energy while maximum force increases only by 0.2%. Model 4 can be used in case reduction of maximum force is in priority of the design. With this model, maximum force is reduced by 16% while energy absorption is reduced only by 0.6%.
7 CONCLUSION
In this paper, collision performance of a tapered thick walled tube, and as a case study crush ele-ment in Siemens ER24PC locomotive, was studied. This was done with numerical solution and Abaqus software. During this simulation, two parameters of maximum force and absorbed energy which are two important factors in studies of collision performance of parts were studied.
At the end, the following results were achieved:
1- Comparison of software results with results of analytical solution showed that precision of model-ing results in Abaqus software is acceptable.
2- Because thickness of plate of the crash element of the Siemens locomotive is high and is ruptured
durin– collision, simulation doesn’t s—ow correct results wit—out considerin– dama–e criterion.
3- Dama–e models of Abaqus software doesn’t s—ow fracture be—avior correctly because t—ey con-sider material continuously and without pores while microstructural damage models concon-sider mate-rial porous.
Latin American Journal of Solids and Structures 12 (2015) 173-204 5- To validate simulations with the modified Rousselier damage model, ECE R 66 standard was used and it was shown that the performed simulations satisfy conditions mentioned in ECE R 66
standard well.
6- Use of aluminum foam increases energy absorption by 24% while maximum force grows only by 0.2%. Therefore, aluminum foam can be used inside the crash element of Siemens locomotive to increase energy absorption.
7- By creating trigger in different levels of the crash element and different simulations, it was speci-fied that trigger with sharp edges with the mentioned dimensions reduces initial peak of the force diagram by 18% while energy absorption decreases only by 8.91%.
8- At the end, two optimal models were introduced for the crash element of Siemens locomotive and it was shown that one of two proposed optimal models can be used considering design priori-ties.
References
Abramowicz, W. and Jones, N. (1984): Dynamic axial crushing of square tubes, International Journal of Impact Engineering, Vol. 2, pp. 179-208.
Abramowicz, W. and Jones, N. (1986): Dynamic progressive buckling of circular and square tubes, International Journal of Impact Engineering, Vol. 4, pp. 243-270.
Abramowicz, W. (2003): Thin-walled structures as impact energy absorbers, Thin-Walled Structures, Vol. 41, pp. 91-107.
El-Hage, H., Mallick, P. and Zamani, N. (2005): A numerical study on the quasi-static axial crush characteristics of square aluminum tubes with chamfering and other triggering mechanisms, International Journal of Crashworthiness, Vol. 10, pp. 183-196.
Guo, J., Zhao, S., Murakami, R.-i. and Zang, S. (2013): Experimental and numerical investigation for ductile fracture of Al-alloy 5052 using modified Rousselier model, Computational Materials Science, Vol. 71, pp. 115-123.
Gurson, A. L. (1977): Continuum theory of ductile rupture by void nucleation and growth: Part I Yield criteria and flow rules for porous ductile media, Journal of engineering materials and technology, Vol. 99, pp. 2-15.
Hancock, J. and Mackenzie, A. (1976): On the mechanisms of ductile failure in high-strength steels subjected to multi-axial stress-states, Journal of the Mechanics and Physics of Solids, Vol. 24, pp. 147-160.
Hanssen, A., Langseth, M. and Hopperstad, O. (1999): Static crushing of square aluminium extrusions with alumini-um foam filler, International Journal of Mechanical Sciences, Vol. 41, pp. 967-993.
Hanssen, A., Hopperstad, O. and Langseth, M. (2000): Bending of square aluminium extrusions with aluminium foam filler, Acta Mechanica, Vol. 142, pp. 13-31.
Hanssen, A., Hopperstad, O. and Langseth, M. (2001): Design of aluminium foam-filled crash boxes of square and circular cross-sections, International Journal of Crashworthiness, Vol. 6, pp. 177-188.
Hanssen, A., Hopperstad, O., Langseth, M. and Ilstad, H. (2002): Validation of constitutive models applicable to aluminium foams, International journal of mechanical sciences, Vol. 44, pp. 359-406.
Hayduk, R. J. and Wierzbicki, T. (1984): Extensional collapse modes of structural members, Computers and struc-tures, Vol. 18, pp. 447-458.
İnce, F., Türkmen, H., Mecitoğlu, Z. Et al. (2011): A numerical and experimental study on the impact behavior of box structures, Procedia Engineering, Vol. 10, pp. 1736-1741.
Latin American Journal of Solids and Structures 12 (2015) 173-204 Jones, N. (2011): Structural impact: Cambridge University Press.
Langseth, M., Berstad, T., Hopperstad, O. and Clausen, A. (1994): Energy absorption in axially loaded square thin-walled aluminium extrusions, pp. 401-410.
Li, H., Fu, M., Lu, J. and Yang, H. (2011): Ductile fracture: experiments and computations, International Journal of Plasticity, Vol. 27, pp. 147-180.
Lorentz, E., Besson, J. and Cano, V. (2008): Numerical simulation of ductile fracture with the Rousselier constitutive law, Computer Methods in Applied Mechanics and Engineering, Vol. 197, pp. 1965-1982.
Mirza, M., Barton, D. and Church, P. (1996): The effect of stress triaxiality and strain-rate on the fracture charac-teristics of ductile metals, Journal of materials science, Vol. 31, pp. 453-461.
Nahshon, K. and Hutchinson, J. (2008): Modification of the Gurson model for shear failure, European Journal of Mechanics-A/Solids, Vol. 27, pp. 1-17.
Needleman, A. and Tvergaard, V. (1984): An analysis of ductile rupture in notched bars, Journal of the Mechanics and Physics of Solids, Vol. 32, pp. 461-490.
Peirs, J., Verleysen, P., Van Paepegem, W. and Degrieck, J. (2011): Determining the stress strain behaviour at large strainfrom high strain rate tensile and shear experiments, International Journal of Impact Engineering, Vol. 38, pp. 406-415.
Ostby, E., Thaulow, C. and Zhang, Z. (2007): Numerical simulations of specimen size and mismatch effects in ductile crack growth Part I: Tearing resistance and crack growth paths, Engineering fracture mechanics, Vol. 74, pp. 1770-1792.
Ostby, E., Thaulow, C. and Zhang, Z. (2007): Numerical simulations of specimen size and mismatch effects in ductile crack growth Part II: Near-tip stress fields, Engineering fracture mechanics, Vol. 74, pp. 1793-1809.
Rousselier, G. (1987): Ductile fracture models and their potential in local approach of fracture, Nuclear engineering and design, Vol. 105, pp. 97-111.
Rousselier, G. (2001): Dissipation in porous metal plasticity and ductile fracture, Journal of the Mechanics and Phys-ics of Solids, Vol. 49, pp. 1727-1746.
Seaman, L., Curran, D., Aidun, J. and Cooper, T. (1987): A microstatistical model for ductile fracture with rate effects, Nuclear engineering and design, Vol. 105, pp. 35-42.
Tvergaard, V. (1982): Influence of void nucleation on ductile shear fracture at a free surface, Journal of the Mechan-ics and PhysMechan-ics of Solids, Vol. 30, pp. 399-425.
Tvergaard, V. (1982): On localization in ductile materials containing spherical voids, International Journal of Frac-ture, Vol. 18, pp. 237-252.
Tvergaard, V. and Needleman, A. (1984): Analysis of the cup-cone fracture in a round tensile bar, Acta metallurgica, Vol. 32, pp. 157-169.
Tu, H., Rudnik, Y., Schmauder, S., Weber, U. and Ploshikhin, V. (2010): Numerical simulation of crack propagation in electron beam welded joints, Paper presented at the Proceeding of the 18th European conference on fracture. ECF, Dresden.
Ugural, A. (1999): Stresses in plates and shells: McGraw-Hill.
Wall, O. (2002): Dynamic crack propagation in large steel specimens, Engineering fracture mechanics, Vol. 69, pp. 835-849.
Wang, B. and Lu, G. (2002): Mushrooming of circular tubes under dynamic axial loading, Thin-walled structures, Vol. 40, pp. 167-182.