www.ann-geophys.net/31/817/2013/ doi:10.5194/angeo-31-817-2013
© Author(s) 2013. CC Attribution 3.0 License.
Annales
Geophysicae
Geoscientiic
Geoscientiic
Geoscientiic
Geoscientiic
Comparative magnetotail flapping: an overview of selected events at
Earth, Jupiter and Saturn
M. Volwerk1, N. Andr´e2,3, C. S. Arridge4,5, C. M. Jackman6,5, X. Jia7, S. E. Milan8, A. Radioti9, M. F. Vogt10,
A. P. Walsh4,*, R. Nakamura1, A. Masters11, and C. Forsyth4 1Space Research Institute, Austrian Academy of Sciences, Graz, Austria
2Centre d’ ´Etude Spatiale des Rayonnements, Universit´e de Toulouse, UPS, Toulouse, France 3CNRS, UMR 5187, Toulouse, France
4Mullard Space Science Laboratory, University College London, Holmbury St. Mary, UK 5Centre for Planetary Sciences at UCL/Birkbeck, London, WC1E 6BT, UK
6Department of Physics and Astronomy, University College London, Gower Place, London, WC1E 6BT, UK 7Dept. of Atmospheric, Oceanic and Space Sciences, University of Michigan, Ann Arbor, USA
8Department of Physics and Astronomy, University of Leicester, Leicester, UK
9Laboratoire de Physique Atmosph´erique et Plan´etaire, Institut d’Astrophysique et de G´eophysique, Universit´e de Li`ege,
Li`ege, Belgium
10Department of Physics and Astronomy, University of Leicester, Leicester, UK 11Institute of Space and Astronautical Science, JAXA, Sagamihara, Japan
*now at: Science and Robotic Exploration Directorate, ESA/ESTEC, Noordwijk, the Netherlands
Correspondence to:M. Volwerk ([email protected])
Received: 14 August 2012 – Revised: 22 March 2013 – Accepted: 12 April 2013 – Published: 6 May 2013
Abstract. A comparison of magnetotail flapping (the up-and-down wavy motion) between the Earth and the two giant planets Jupiter and Saturn has been performed through inves-tigation of the current sheet normal of the magnetotail. Mag-netotail flapping is commonly observed in the Earth’s magne-totail. Due to single spacecraft missions at the giant planets, the normal is determined through minimum variance analy-sis of magnetometer data during multiple intervals when the spacecraft crossed through the current sheet. It is shown that indeed a case can be made that magnetotail flapping also oc-curs at Jupiter and Saturn. Calculations of the wave period using generic magnetotail models show that the observed pe-riods are much shorter than their theoretical estimates, and that this discrepancy can be caused by unknown input param-eters for the tail models (e.g., current sheet thickness) and by possible Doppler shifting of the waves in the spacecraft frame through the fast rotation of the giant planets.
Keywords. Magnetospheric physics (Magnetotail; MHD
waves and instabilities)
1 Introduction
Magnetotail flapping, the up-and-down wavy motion of the current sheet is now a well-established phenomenon in the Earth’s magnetotail (see e.g., Sergeev et al., 1998; Zhang et al., 2002; Sergeev et al., 2003; Runov et al., 2005), identi-fied in spacecraft data as multiple crossings of the current sheet. It has been shown that the waves, with periods of several minutes travel from the centre of the magnetotail to the flanks and that storm and substorm activity can excite and constrain the motion of the current sheet (Davey et al., 2012). During the passage of these waves the current sheet can be very strongly tilted in the YZ-plane by these flapping waves. Similar observations of multiple current sheet cross-ings have been presented from Jupiter (Israelevich and Er-shkovich, 2006; Israelevich et al., 2007), but until now there have been no reported observations of this phenomenon at Saturn.
Toichi and Miyazaki, 1976; Lui et al., 1978). Although vari-ous ideas were suggested to account for these observations, it was generally considered that these observations were due to the current sheet flapping in an up-and-down motion over the spacecraft. The multi-spacecraft Cluster mission later con-firmed this by unambiguously determining the local velocity of the current sheet (Zhang et al., 2002; Sergeev et al., 2004). These observations presented a new view of the current sheet. Cluster’s unique view of the current sheet offered new in-sights into current sheet flapping. Zhang et al. (2002) showed that during the flapping the current sheet gets very warped (see their Figs. 3 and 5 and Fig. 4 in this paper), and the nor-mal of the current sheet for the neutral sheet crossings was often tilted away from theZGSM-axis over more than 90◦in
theY ZGSM-plane. Sergeev et al. (2004) performed a
statisti-cal study of magnetotail flapping events in 2001 using Clus-ter. Using timing analysis (Harvey, 1998) they found that the normal direction of the current sheet in the GSM XY-plane was always pointing away from the midnight meridian, indi-cating that the waves are travelling towards the flanks. Typi-cally the y-component of the normal was largest and the av-erage propagation velocity of the waves was 57 km s−1 for more quiet current sheets and 145 km s−1for active ones.
The studies of current sheet flapping discussed above pre-sented observations from a narrow range of distances along the tail for each individual study, either from a single space-craft location or relatively closely separated (i.e.,∼1000 km) multi-spacecraft observations by Cluster. On 5 August 2004 both Cluster and Double Star TC1, which were separated by∼5RE observed a flapping magnetotail. Using the four
spacecraft Cluster data, timing analysis (Harvey, 1998) was performed on theBx=0 crossings to obtain the normal
di-rection of the current sheet. This timing analysis showed that the current sheet was again very warped (see Fig. 3 in Zhang et al., 2005) during the flapping, with an oscillation period of∼10 min. The time difference between the Cluster space-craft and TC1 showed that the flapping of the tail takes place over at least a distance of 5RE along the tail, and that the
waves are travelling at a slight angle with respect to the GSM Y-direction (Volwerk et al., 2005).
Theoretical models have investigated those inherent in-stabilities of the Earth’s magnetotail that are driven by the magnetic field and plasma gradients along and across the tail. These models delivered the dispersion relation for these types of large-scale waves in the Earth’s magnetotail and have been presented by Golovchanskaya and Maltsev (2005) and Erkaev et al. (2008, 2010). Lately, Forsyth et al. (2009) showed that the so-called “double gradient model” in which the flapping waves arise through the combination of the mag-netic field gradients ∂Bx/∂z and ∂Bz/∂x, as presented by
Erkaev et al. (2008), best fit the observations made by Clus-ter of a flapping current sheet in 2001.
The flapping motion of the current sheet has enabled de-tailed studies of the vertical structure of the current sheet to be made, given that the observing spacecraft can pass
through the current sheet on relatively short timescales. Sergeev et al. (1998) used three months of magnetic field and plasma data from the AMPTE/IRM satellite, to study the flapping motion of the Earth’s magnetotail and the structure of the current sheet. They found that there was a correlation to the plasma velocity perpendicular to the plane of the cur-rent sheet (VZ,GSM) and thedBX,GSM/dt. A linear regression
was made between the velocity and the magnetic field time derivative:
Vz=A0+A1
dBx
dt . (1)
For the cases in which a strong correlation was found, an es-timate for the scale heighthof the current sheet could be ob-tained when a planar current sheet is assumed (which holds whenBz≪Bx):
h=qBLA1
1+k21
, (2)
wherek1is the regression coefficient betweenByandBx, and
BL is the lobe magnetic field. This leads to current density
estimate of: j≈ 800
(A1(1+k1))
, (3)
with the current in nA/m2. From the AMPTE/IRM data it was concluded that during flapping events the current den-sity was more intense (j ∼10–20 nA m−2) and the current sheet thinner (h∼0.2–1RE) than was expected from
magne-tospheric models for quiescent magnetotails (j≤5 nA m−2, h≥1RE, see e.g., Zhang et al., 2006). A recent statistical
study by Davey et al. (2012) showed observations of mag-netotail flapping events also have a similar occurrence distri-bution across the magnetotail to fast magnetospheric flows, suggesting a link with substorm activity.
At Jupiter some investigations on “flapping” current sheets were done by Israelevich and Ershkovich (2006) and Israele-vich et al. (2007) using multiple Voyager 2 and Galileo cross-ings of the Jovian current sheet in order to find if its structure is Harris-like or bifurcated. In a Harris current sheet (Harris, 1962) between two regions of oppositely directed magnetic fields, there is pressure balance between the plasma and the magnetic field and the magnetic field can be described by a hyperbolic tangent with a specific scale heightH:
Bx(z)=B0tanh
n z
H
o
. (4)
This model has maximum current density in the centre of the current sheet described by:
Jy(z)=
B0
Hsech
2nz
H
o
. (5)
current density atz=0 which is flanked by two maxima at z= ±z0(see e.g., Hesse and Schindler, 1986; Runov et al.,
2003).
It should be understood that “flapping” in Israelevich and Ershkovich (2006) and Israelevich et al. (2007) refers to multiple crossings ofBx=0, but these crossings need not
show the characteristics of the Earth’s magnetotail flapping. These papers showed a number of profiles of∂BX/∂tagainst
Bx, taken to be indicative of the current density profiles
of the current sheets. Their observations included 14 bifur-cated sheets within the period from 13 September 1996 un-til 26 December 1998. They concluded that bifurcation is not a common feature of the Jovian current sheet. When present, the bifurcation is possibly generated by the ion pres-sure anisotropy in the plane perpendicular to the magnetic field. They present a model for the Jovian current sheet us-ing Vlasov and Maxwell’s equations and introduce a strong anisotropy in the ion pressure. They obtain a current density for the Jovian current sheet depending on the vector potential A(z)of the magnetic field (withB=dA/dz):
˜
j=
q
˜
A20−ln(1− ˜B2)exp{ ˜A2
0−ln(1− ˜B
2)}.
(6) where,A,˜ B˜are the dimensionless vector potential and mag-netic field. The profile of this Jovian current density fits well with that of the Earth for bifurcated current sheets.
In the Kronian magnetotail there are various periodicities related to the rotational period of Saturn, as discussed in Arridge et al. (2011); Andrews et al. (2012); Provan et al. (2012). It was found that the current sheet in the Kronian magnetosphere is hinged, similar to those at the Earth and Jupiter, and that it is located above the rotational equator and adopts a bowl shape over the midnight-dawn-noon local time sectors (Arridge et al., 2008).
Cassini data have also shown that reconnection happens in Saturn’s magnetotail (see e.g., Jackman et al., 2007, 2008; Masters et al., 2011), showing the presence of plasmoids (Hones et al., 1984) and return flows, and indicating that the recurrence rate of these events may be in the region of
∼2.4 days (Jackman et al., 2011). However, there have not been any studies with respect to possible magnetotail flap-ping as have been done at Earth and Jupiter.
In this paper, we try to find whether the magnetotails of Jupiter and Saturn show a similar flapping behaviour as the Earth’s magnetotail, which was not done in the Jupiter pa-pers discussed above. There is strong evidence that substorm-like processes occur in the magnetotails of the giant planets, where stored energy is released through reconnection events as shown by e.g., Jackman et al. (2007); Masters et al. (2011); Vogt et al. (2010), which may then be able to drive the flap-ping motion of the magnetotail. However, for the six events that we will be investigating in this paper at these two giant planets plasma velocity vectors are not routinely available. Therefore, we first examine the characteristics of the flapping motions at the Earth using magnetometer data from Cluster
and Double Star in Sect. 2.1. These results are then compared with data from Cassini at Saturn in Sect. 2.2 and Galileo at Jupiter in Sect. 2.3. A comparison with theoretical models is presented in Sect. 3, the possible current sheet bifurcation is discussed in Sect. 4, and we end with a discussion in Sect. 5. In this paper, at the Earth, we will use the Geocentric So-lar Magnetospheric system (GSM) which has its x-axis from the Earth to the Sun. The y-axis is defined to be perpendicu-lar to the Earth’s magnetic dipole so that the XZ-plane con-tains the dipole axis. The positive z-axis is chosen to be in the same sense as the northern magnetic pole. This is the preferred coordinate system for the Earth’s magnetotail, as e.g., for magnetotail flapping the rocking of the current sheet normal only displays its characteristic motion in this system. Therefore, at the giant planets we will use the planetocen-tric Solar Magnetospheric (pSM) coordinate system which is similarly defined with the specific planet as the origin.
2 Magnetotail flapping at Earth, Saturn and Jupiter
In Fig. 1 we show the relative location within their respec-tive magnetospheres of all events discussed in this paper. The event from Cluster is labelled Cl, the events from Jupiter are labelled 141, 171 and 173 and the events from Saturn are la-belled 144, 249 and 265. Also shown are the approximate locations of the magnetopause for the Earth (polynomial val-ues in Table 2 of Fairfield, 1971), Jupiter (Joy et al., 2002, with solar wind dynamic pressurePdyn≈0.2 nPa) and
Sat-urn (Arridge et al., 2006, withPdyn≈0.01 nPa) in planetary
radii. This gives an impression of where the events roughly take place inside the planetary magnetosphere.
In this paper, we will use data from the fluxgate magne-tometer on Cluster (Balogh et al., 2001) from 2004, Cassini magnetic field data (Dougherty et al., 2004) at 1 s and 1 min resolution and the plasma data (Young et al., 2004) from 2006 and Galileo magnetometer data (Kivelson et al., 1992) at 27 s resolution from the G8 orbit of Galileo in 1997.
2.1 Observations at Earth
On 5 August 2004 both Cluster and Double Star TC1 ob-served a flapping magnetotail as discussed by Zhang et al. (2005) and Volwerk et al. (2005). In Fig. 2, the magnetic field components and magnitude are shown for the four (black, red, green, blue) Cluster spacecraft (Balogh et al., 2001) and (magenta) Double Star TC1 (Carr et al., 2005). The yellow shaded area in the figure shows the interval of magnetotail flapping.
Using the Cluster four-spacecraft data, timing analysis (Harvey, 1998) was performed on the Bx=0 crossings to
-100 -50
0 50
100 -100
-80
-60
-40
-20
0
20
40
60
80
100
144 249 265
141 173171
Cl
XpSM Y pSM
Earth Jupiter Saturn
Fig. 1.The location of the flapping events in the planetary magne-totails. Shown are the magnetopauses of the Earth (blue), Jupiter (green) and Saturn (red) and the events in the same colours all in relative planetary radii in planetary Solar Magnetic (pSM) coordi-nates.
that the flapping of the tail takes place over at least a distance of 5RE along the tail, and that the waves are travelling at a
slight angle with respect to theY-direction (see Zhang et al., 2005; Volwerk et al., 2005), a schematic view of which is shown in Fig. 3.
As the Galileo and Cassini missions at Jupiter and Sat-urn, respectively, are single spacecraft missions, timing anal-ysis is not possible there. However, the normal of the cur-rent sheet can also be determined through Mininum Variance Analysis (MVA, Sonnerup and Cahill, 1967; Sonnerup and Scheible, 1998) over intervals that contain theBx=0
cross-ing. Also, the data resolution is lower at the outer planets for the events that we are looking at: for Galileo the data sampling rate is 24 s, whereas for Cassini the sampling rate used here is 1 min (down sampled from 1 s), compared to the 22 Hz data from Cluster. Because MVA gives better results on smoothed datasets, we have performed the MVA on spin-resolution (4 s, which is a higher spin-resolution than will be used at Jupiter and Saturn) Cluster data and compare the results of the MVA normals with the timing normals in Table 1. In order to get an error estimate of the minimum variance di-rection we also calculate the error cone around the minimum variance direction, i.e., the angles of this cone in the inter-mediate and maximum variance directions (for the equations see, e.g., Sonnerup and Scheible, 1998).
For a wave travelling from the centre of the tail towards the flanks, one expects that the x-component of the normal is mi-nor and the y- and z-components to oscillate between equal
-40 -20 0 20 40
Bx
-40 -20 0 20 40
By
-40 -20 0 20 40
Bz
11 12 13 14 15 16 17
0 50
Btot
UT
Fig. 2.The Cluster (black, red, green blue) and Double Star TC1 (magenta) magnetic field data for 5 August 2004. From top to bot-tom are shown the field components Bx, By, Bz and the magni-tudeBtot. The Cluster spacecraft were located∼15RE and TC1
∼10REdown the tail, both at a local time of∼02:00 LT. The multi-pleBx=0 crossings were identified as magnetotail flapping (Zhang et al., 2005).
signs for both components and opposite signs as shown in Sergeev et al. (2004). It is clear that the directions of the cur-rent sheet normal for both methods (timing and MVA) are not the same as listed in Table 1, however, the pattern of the y-and z-components are quite similar with respect to the signs of both components, except for crossing #5 for which the ratio of the intermediate and minimum eigenvalue is rather small, λmed/λmin=3. We note that in their comparison of
MVA and timing analysis, Sergeev et al. (2006b) showed that the minimum variance direction of a flapping current sheet was within 20–30 degrees of the timing vector for values of λmed/λmin>4. A graphical interpretation of the current
sheet normals in the YZ-plane is given in Fig. 4. Here we plot the normal direction as a solid arrow and the error cone around this direction, obtained from the MVA analysis, as dotted lines around the arrow. In the top part of Fig. 4 we have taken the timing normals and drawn an artist’s impres-sion of the warping of the current sheet as indicated by the normal directions in the YZ-plane. The current sheet should be at right angles to the arrows that represent the normals.
Although the absolute direction of the current sheet nor-mal may not be correct using MVA on low-resolution data, as compared to multi-spacecraft timing analysis, its general behaviour is well captured and we can use this method to investigate possible magnetotail flapping at the giant planets.
2.2 Observations at Saturn
Table 1.Current sheet normals using timing analysis (Zhang et al., 2005) and MVA for 5 August 2004. Shown are the timing normal vector, the MVA normal vector, the ratio of minimum and intermediate eigenvalue, the error cone around the minimum variance direction in the intermediate and maximum variance directions1φ12and1φ13(in degrees).
Crossing Time Normal MVA λmed/λmin 1φ12 1φ13
1 13:34 (−0.283,−0.677,−0.679) (0.24,−0.26,−0.93) 2 1.7 9.7
2 13:38 (0.091,−0.895,−0.436) (0.32,−0.72,−0.60) 8 0.6 1.7
3 13:47 (0.128,−0.931, 0.342) (0.50,−0.87, 0.04) 9 0.2 2.3
4 13:57 (0.483,−0.624,−0.614) (0.67,−0.69,−0.24) 10 0.2 2.3
5 14:07 (0.545,−0.754, 0.368) (0.63,−0.76,−0.01) 3 0.6 2.3
6 14:14 (0.205,−0.302,−0.931) (0.42,−0.60,−0.67) 9 0.2 1.7
7 14:32 (0.512,−0.742, 0.433) (0.52,−0.85, 0.01) 3 0.2 2.9
8 15:00 (0.509,−0.608,−0.610)
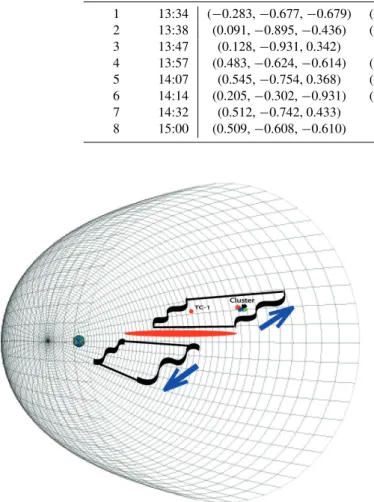
Fig. 3.A schematic view of the kink-like flapping wave emitted from the central part of the magnetotail in an equatorial view. This wave propagates towards the flanks of the magnetotail. Double Star TC-1 and Cluster were located∼5REapart at same local time and both observed this wave. The cone-shaped mesh represents the mag-netopause.
tail and remained well within the centre of the tail, i.e., the orbit was located within the region of−20≤YKSM≤20.
We have searched for half-hour intervals where there are multiple crossings of the current sheet and selected events for this case study on DOY 144, 249 and 265. Although the description of tail dynamics may be best described in the spherical KRTP coordinate system (see e.g., Jackman et al., 2009), in order to perform the analysis of the cur-rent sheet normal using MVA we need a Cartesian coordi-nate system. Also, we prefer to use the same coordicoordi-nate sys-tem as at Earth, for reasons mentioned above, and for eas-ier comparison between planets. The data have been trans-formed to the KSM (Kronian-Solar-Magnetospheric)
coordi-Fig. 4.Graphical representation of the current sheet normals y- and z-components for the Earth, Saturn DOY 249, 334 and 144 and Jupiter DOY 141, 173, 171. The top panel shows the timing nor-mals for the Earth with superposed an artist’s impression of the shape of the current sheet deduced from the normals. The bottom panel shows for the Earth both the timing (dotted) and MVA nor-mals are plotted. The dashed lines forming cones around the solid arrows are the maximum error cones for the normal direction as de-termined from MVA. The horizontal axis functions as both theNy direction and the time axis.
nate system. This transformation has the following effect that Br≈ −Bx,Bθ≈ −BzandBφ≈ −Byfor DOY 249 and 265,
−2 0 2
Bx
−2 0 2
By
−2 0 2
Bz
00000 0500 1000 1500 2000 2
4 6
Btot
UT
−2 0 2
Bx
−2 0 2
By
−2 0 2
Bz
0345 0400 0415 0430 0445 0500 0 2
4 6
Btot
UT
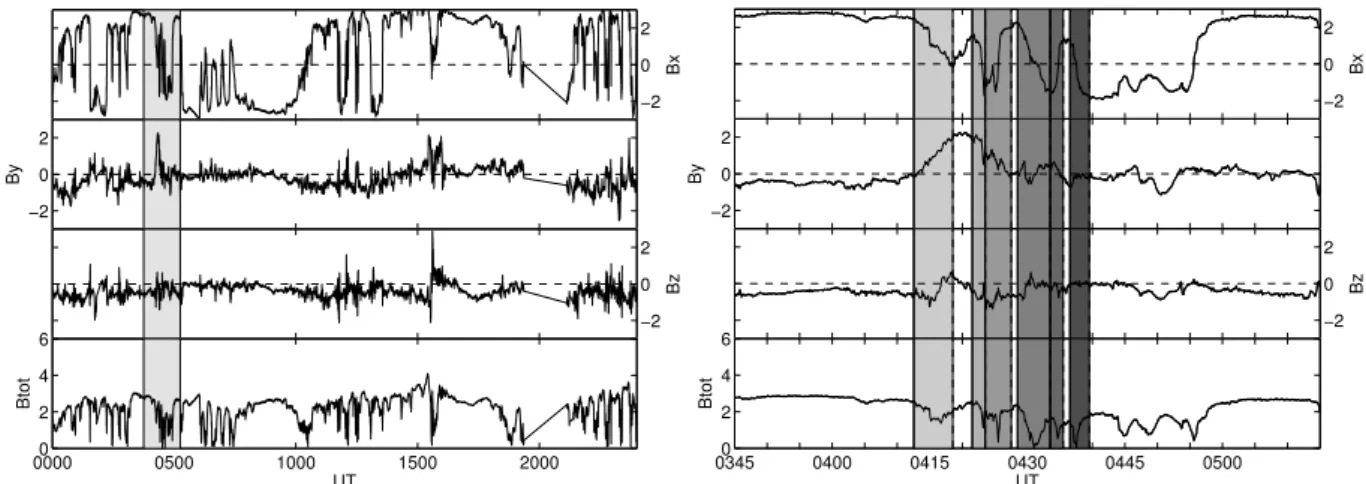
Fig. 5.Saturn flapping event on DOY 249. The left panel shows one full day of magnetic field data in KSM coordinates. The right panel shows a zoom in on the yellow shaded part in the left panel, showing the flapping event. The intervals for the MVA analysis are marked with filled areas of different shades of gray.
because of spacecraft location andBr≈By,Bθ≈ −Bz and
Bφ≈Bx.
2.2.1 Saturn DOY 249
The magnetic field data for DOY 249 (6 September 2006) and the interval 03:45–05:15 UT are shown in Fig. 5. It is clear thatBx crosses zero several times during the interval
04:06–04:42 UT. We define six intervals of strongly chang-ingBx, where the last five are alternating decreases and
in-creases ofBxwith zero crossings. The intervals are marked
with filled areas of different shades of gray in Fig. 5. Mini-mum variance analysis has been performed on these intervals and the results are given in Table 2 and graphically in Fig. 4. The quasi-period for this oscillation is∼5 min.
The results of the MVA show that the x-component of each minimum variance direction is relatively small com-pared to the y- or z-component and is always positive. The y-component was always negative, but the z-component switched signs on each crossing between the second and fourth crossings. This is consistent with the observations of flapping current sheets in the Earth’s magnetotail as pre-sented by Sergeev et al. (2004) and in the Earth example above. The normal directions in the YZ-plane are shown in Fig. 4. The eigenvalue ratio for each vector was above 6 and was for most of the events was above 100, indicating that the minimum variance direction was well defined. Based on the MVA results, this event will be considered as a detection of magnetotail flapping at a period ofT ∼5 min.
2.2.2 Saturn DOY 144
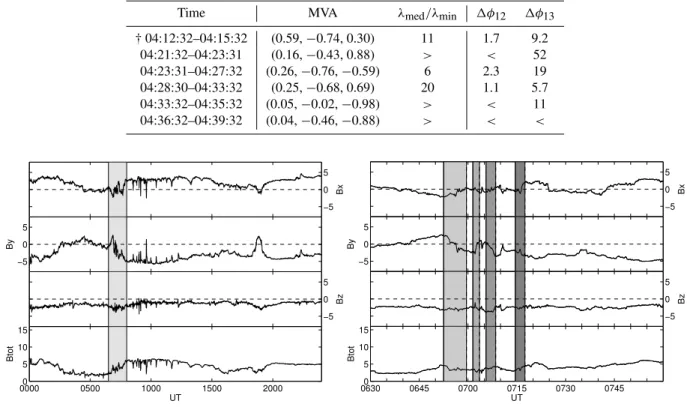
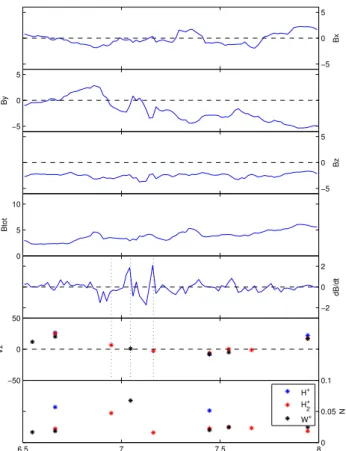
One special event happened on DOY 144 (24 May 2006) during the interval 06:30–08:00 UT. The data are shown in Fig. 6, and it is clear that during this event the main
oscilla-tion of the magnetic field is inByinstead ofBx. Also, there
is a significant constantBz≈ −3 nT during this interval.
The MVA performed on the four intervals, shown in Ta-ble 3 and graphically in Fig. 4 does not show the expected direction change of the normal, which would be in the XZ-plane as the flapping seems to take place in the By
-component. This can have two reasons: (1) Only the first in-terval has a well definedBx=0 crossing; (2) there is a strong
Bzduring this event. The quasi-period for this oscillation is
∼9 min.
For this event there are plasma data available with the cor-rect pointing of the spacecraft (i.e., corotational flow enters the plasma instrument), that are shown in Fig. 7. We have plotted theVzcomponent of the ion velocity and the density
for H+, H+2 and W+. As the flapping motion seems to be in theBycomponent, we have also plotteddBy/dt(in contrast
todBx/dtin e.g., Sergeev et al., 2004). During the flapping
period there seems to be some indication that at 06:57 UT fordBy/dt <0 one finds for H+2 a positive velocity, whereas
at 07:10 UT fordBy/dt >0 one finds for H+2 a negative
ve-locity, showing the up-and-down motion of the current sheet over the spacecraft. However, due to relatively low count rates the velocity estimate has a rather large error, with other estimates than shown in this paper givingVz=0±10 km s−1
for this event (R. Wilson, personal communication, 2012). This makes it difficult to assign the flapping label to this event, as the MVA result is negative and the plasma data are inconclusive.
2.2.3 Saturn DOY 265
Table 2.MVA analysis for the intervals during the Saturn DOY 249 flapping event. The lines starting with † mean that there was noBx=0 crossing during the interval. The current sheet normal is given by the eigen vector of the smallest eigenvalue and is chosen such that the x-component is positive and the y-x-component negative. For a flapping event the z-x-component should alternate between a positive and negative value in alternatingBx=0 crossings. Also the ratio of the minimumλ1and intermediateλ2eigenvalues is given and the error estimates. A symbol>forλ2/λ1means a greater than 100 ratio and a symbol<in the error estimates means a value less than 0.001.
Time MVA λmed/λmin 1φ12 1φ13
† 04:12:32–04:15:32 (0.59,−0.74, 0.30) 11 1.7 9.2
04:21:32–04:23:31 (0.16,−0.43, 0.88) > < 52
04:23:31–04:27:32 (0.26,−0.76,−0.59) 6 2.3 19
04:28:30–04:33:32 (0.25,−0.68, 0.69) 20 1.1 5.7
04:33:32–04:35:32 (0.05,−0.02,−0.98) > < 11
04:36:32–04:39:32 (0.04,−0.46,−0.88) > < <
−5 0 5
Bx
−5 0 5
By
−5 0 5
Bz
00000 0500 1000 1500 2000 5
10 15
Btot
UT
−5 0 5
Bx
−5 0 5
By
−5 0 5
Bz
0630 0645 0700 0715 0730 0745 0 5
10 15
Btot
UT
Fig. 6.Saturn flapping event on DOY 144. Format as in Fig. 5.
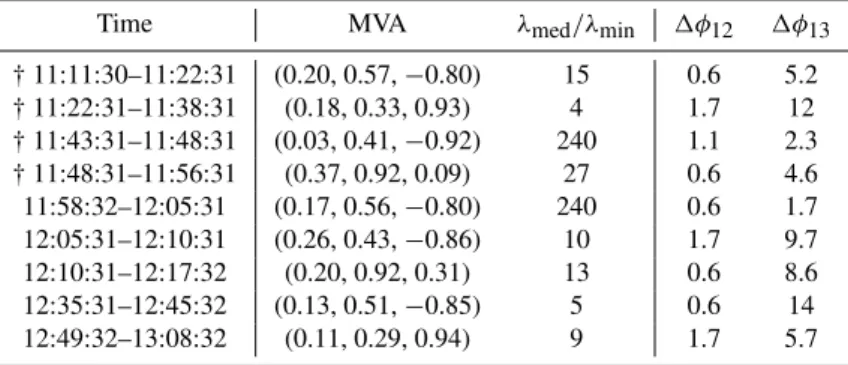
in Table 4 and graphically in Fig. 4. The quasi-period of this event was∼15 min.
Similar to the event on DOY 249 the minimum variance direction showed a pattern of small x-component, an alter-natingly changing sign of the z-component and constant sign for the the x- and y-components. The eigenvalue ratios were all above 4, suggesting the minimum variance direction was correct to within 20–30 degrees (Sergeev et al., 2006a, b), but were somewhat smaller than from DOY 249, with only two crossings with eigenvalue ratios greater than 200. Inter-estingly, there seems to be a skip at the sixth interval, which looks like a sharp change in the motion of the current sheet from the data shown in Fig. 8 right panel. There then is a rather large time gap, almost 1 period, before the next cur-rent sheet crossings and Cassini’s ultimate crossing from the southern to the Northern Hemisphere. We will identify this event as magnetotail flapping.
2.3 Observations at Jupiter
At Jupiter, we use the Galileo magnetometer data (Kivelson et al., 1992) from the G8 orbit (i.e., the eighth orbit of Galileo around Jupiter, and the target flyby moon was Ganymede),
where the spacecraft is partly traversing the central part of the tail outbound from Jupiter and traversing the dusk-side tail during the inbound part of the orbit. Unfortunately, the plasma data available from this mission are too sparse to help with this investigation. The cruise data for the magnetic field were sampled at 24 s resolution.
We will discuss three events on DOY 141, 171 and 173 of 1997 in the following sections. The rotational (system III) period of Jupiter of 9 h 55′ 29.71′′ (see e.g., Dessler, 1983) is apparent in the data. The tilted Jovian dipole (∼9.6◦, see e.g., Bagenal et al., 2004) sweeps the current sheet up and down over the spacecraft in roughly 5 h intervals because Galileo’s orbit remains near the Jovian equator. We searched these current sheet sweeps for flapping events.
2.3.1 Jupiter DOY 141
Table 3.MVA analysis for the intervals during the Saturn DOY 144 flapping event. Format as in Table 2.
Time MVA λmed/λmin 1φ12 1φ13
06:52:30–06:59:32 (0.23,−0.63, 0.74) 7 5.7 11
07:01:30–07:03:32 (0.35,−0.12, 0.92) > < <
07:05:31–07:08:31 (0.19,−0.02, 0.98) > < <
† 07:14:31–07:17:31 (0.70,−0.41,−0.57) > < <
Table 4.MVA analysis for the intervals during the Saturn DOY 265 flapping event. Format as in Table 2.
Time MVA λmed/λmin 1φ12 1φ13
† 11:11:30–11:22:31 (0.20, 0.57,−0.80) 15 0.6 5.2
† 11:22:31–11:38:31 (0.18, 0.33, 0.93) 4 1.7 12
† 11:43:31–11:48:31 (0.03, 0.41,−0.92) 240 1.1 2.3
† 11:48:31–11:56:31 (0.37, 0.92, 0.09) 27 0.6 4.6
11:58:32–12:05:31 (0.17, 0.56,−0.80) 240 0.6 1.7
12:05:31–12:10:31 (0.26, 0.43,−0.86) 10 1.7 9.7
12:10:31–12:17:32 (0.20, 0.92, 0.31) 13 0.6 8.6
12:35:31–12:45:32 (0.13, 0.51,−0.85) 5 0.6 14
12:49:32–13:08:32 (0.11, 0.29, 0.94) 9 1.7 5.7
performed MVA analysis on the current sheet crossings, and the result is shown in Table 5 and graphically in Fig. 4.
The minimum variance directions show a similar pattern as for the Earth and Saturn, a small x-component, and an oscillating z-component at constant sign of the x- and y-component, indicative of a flapping event, a wave travelling from the centre of the magnetotail towards the flanks. In-deed, for the first five MVA directions we find this pattern, however, for the last twoBx=0 crossings there seems to be
a skip in the alternation. We note that the eigenvalue ratios for these MVAs were much lower than for the Saturn and Earth events, with only three events with an eigenvalue ratio greater than 4. However, based on the behaviour of the cur-rent sheet normal, which is as expected for a travelling wave, we identify this event as magnetotail flapping in the centre of the Jovian magnetotail. The quasi-period for this oscillation is∼4 min.
2.3.2 Jupiter DOY 173
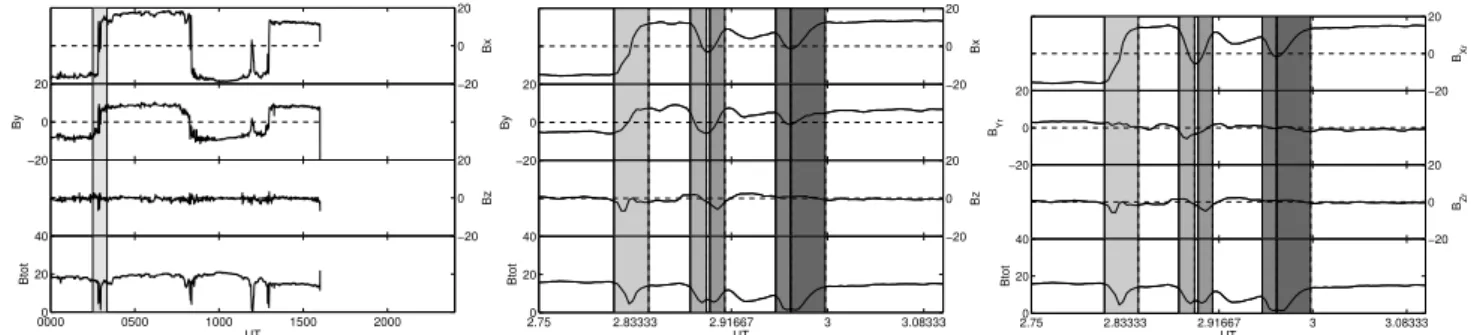
The magnetic field data for DOY 173 (22 June 1997) and the interval 02:30–03:20 UT are shown in Fig. 10. There are sev-eralBx=0 crossings as well asBy=0. Galileo is located
in the dawn flank of the Jovian magnetotail, where the mag-netic field is influenced by flaring (see e.g., Huddleston et al., 1998; Belenkaya et al., 2005). The field lines are no longer mainly in the x-direction, as they are near the centre of the magnetotail, but obtain a significant y-component. We, there-fore, transform the data by rotating over−30◦around the z-axis, whereby the main variation of the magnetic field is in the rotatedXr-component.
The MVA analysis is now performed on the rotated dataset and the results are shown in Table 6 and graphically in Fig. 4. The minimum variance directions for theBXr=0 crossings
are all very well defined, with all the eigenvalue ratios greater than 10. The directional pattern showing up in the current sheet normals shows a strong oscillation in amplitude be-tweenYrandZr. The third crossing does not conform to this,
with a negative z-component when we would expect a posi-tive z-component, however, this component was very small. There seems to be a skip in the last 2 crossings, which were not continuous with the first three, as can be seen in Fig. 10 (oneBXr-dip does not cross zero). The quasi-period of these
oscillations is∼3 min.
2.3.3 Jupiter DOY 171
The data for DOY 171 (20 June 1997) and for the interval 14:30–15:30 UT are shown in Fig. 11. Again, there are mul-tipleBx=0 crossings. However, there are also oscillations
in theBycomponent as in DOY 173. As Galileo is in a
simi-lar region of the Jovian magnetotail as on DOY 173, we once more rotate the magnetic field data over −30◦ around the z-axis to account for the flaring of the tail. We perform the MVA analysis on the rotated data and the results are shown in Table 7 and graphically in Fig. 4.
The current sheet normal directions show mostly a min-imal Xr-component, a sign-changing z-component at
con-stantly negativeXr- andYr-components, which is indicative
of a flapping event, where a travelling wave is moving in theYrdirection. The eigenvalue ratios in this interval were
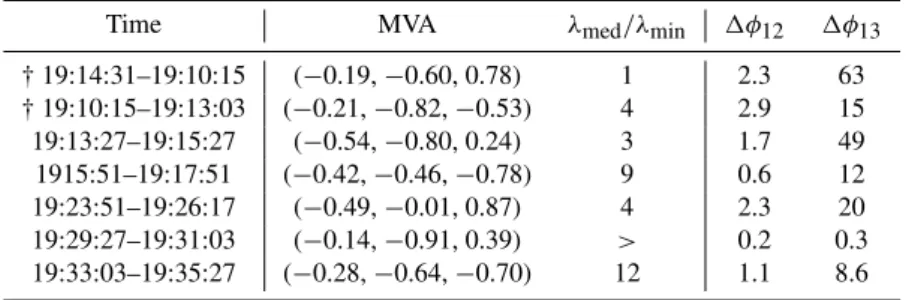
Table 5.MVA analysis for the intervals during the Jupiter DOY 141 flapping event. Format as in Table 2.
Time MVA λmed/λmin 1φ12 1φ13
† 19:14:31–19:10:15 (−0.19,−0.60, 0.78) 1 2.3 63
† 19:10:15–19:13:03 (−0.21,−0.82,−0.53) 4 2.9 15
19:13:27–19:15:27 (−0.54,−0.80, 0.24) 3 1.7 49
1915:51–19:17:51 (−0.42,−0.46,−0.78) 9 0.6 12
19:23:51–19:26:17 (−0.49,−0.01, 0.87) 4 2.3 20
19:29:27–19:31:03 (−0.14,−0.91, 0.39) > 0.2 0.3
19:33:03–19:35:27 (−0.28,−0.64,−0.70) 12 1.1 8.6
Table 6.MVA for DOY Jupiter 173.
Time MVA λmed/λmin 1φ12 1φ13
02:48:54–02:50:42 (−0.08,−0.97, 0.24) 14 0.6 5.7
02:52:52–02:53:42 (−0.16,−0.39,−0.91) 120 0.6 2.9
02:53:53–02:54:40 (−0.26,−0.96,−0.07) > 0.6 1.1
02:57:18–02:58:05 (−0.11,−0.91, 0.39) > < <
02:58:05–02:59:53 (−0.01,−0.45,−0.90) 32 0.6 4.0
Except for the last two BXr=0 crossings, where there is
again a sign skip. The quasi-period for this event is∼4 min. In summary: We examined the reliability of MVA to de-termine the true current sheet normal direction (taken to be that determined by multi-spacecraft timing analysis) for pe-riods of flapping current sheets at Earth. Using this, we have studied several dynamic current sheet crossings at Saturn and Jupiter and determined the current sheet normal for multi-pleBx=0 crossings per event. For each planet the normals
show strong oscillations, indicative of a “wavy twisted neu-tral sheet” as described by Zhang et al. (2002) (but see also Cowley, 1981). The period of the current sheet waves was 3–4 min at Jupiter and 5–15 min at Saturn, compared with 1–5 min at Earth (Sergeev et al., 2006a).
3 Comparison with theory
We have shown possible magnetotail flapping events for Jupiter and Saturn. We will now put these events into context with respect to the instability criteria discussed by Erkaev et al. (2008, 2009, 2010). Forsyth et al. (2009) showed re-cently that at Earth this model is preferred to describe the behaviour of the magnetotail during flapping. The so-called magnetic double gradient model follows from the linearised MHD equations and leads to a flapping frequency given by (SI versions taken from Forsyth et al., 2009):
ωf= s
1 µ0ρ
∂B
x
∂z
∂B
z
∂x , (7)
whereρis the current sheet density and the dispersion rela-tion is given by:
ω=q ωfk1
k212+λ2
k
, (8)
where1 is the current sheet half-thickness,k is the wave number andλkis the numerical solution to tanλk=k1/λk.
Unfortunately, there are no multi-spacecraft missions at Jupiter and Saturn, unlike at the Earth with the Cluster mis-sion, that can deliver the instantaneous half-thickness1of the current sheet and the gradients of the magnetic field that are needed in Eqs. (7) and (8). However, there have been efforts to estimate the current sheet thickness for several Cassini revolutions by Sergis et al. (2011) and for Jupiter by Khurana and Kivelson (1989) and Khurana and Schwarzl (2005). As these are not simultaneous measurements with the events discussed in this paper, we will use magnetic field models that have shown to work well with the observations by spacecraft to describe the generic magnetotails of the gi-ant planets and, therefore, predict the period of the flapping oscillations.
3.1 Saturn
Table 7.MVA for Jupiter DOY 171. lines in italics mean noBx=0 crossing.
Time MVA λmed/λmin 1φ12 1φ13
09:48:36–09:50:00 (−0.72,−0.57, 0.38) 4 4.6 22
09:50:00–09:52:12 (−0.35,−0.93, -0.11) 6 1.7 17
09:52:12–09:55:26 (−0.24,−0.22, 0.94) 3 7.4 29
09:55:26–09:57:00 (−0.14,−0.33, -0.93) > < <
10:00:14–10:02:13 (−0.11,−0.15, 0.98) 11 1.1 9.7
10:02:13–10:04:12 (−0.47,−0.77, -0.41) 6 1.1 17
10:05:49–10:07:26 (−0.34,−0.73, -0.59) 30 1.1 6.3
10:09:00–10:11:49 (−0.10,−0.34, 0.93) 15 1.1 3.4
−5 0 5
Bx
−5 0 5
By
−5 0 5
Bz
0 5 10
Btot
−2 0 2
dB/dt
−50 0 50
Vz
6.5 7 7.5 80
0.05 0.1
N
H+ H
2 +
W+
Fig. 7.Saturn flapping event on DOY 144. Shown are the magnetic field components in KSM coordinates and the total magnetic field. Then the time derivativedBy/dt, the z-component of the plasma ve-locity and the density for H+(blue), H+2 (red) and watergroup ions W+(black). The three vertical dotted lines show to whichdBy/dt the plasmaVzmap.
modified the CAN81 model to take into account the hinging of the magnetotail. This leads to a rather complicated model of the magnetic field equations, which describe the observed magnetic field well, but may be too detailed for the estimate of the flapping frequencies.
However, it has been shown by Dougherty et al. (2005) and Bunce et al. (2007) that the simple CAN81 model can rather well describe the magnetic field of the current sheet
after the internal Kronian field has been subtracted from the data. Therefore, we will use the CAN81 model to calculate the flapping frequency as given by Eq. (7). As the flapping events at Saturn are taking place atXKSM<−16RS, we use
region III of the ring current model, which has the following equations for the magnetic field:
BrIII=
µ
0I0
2
"
1
ρ(F1−F2+2D)− a2r
4 1 F13−
1 F23
!#
,(9) BzIII=
µ
0I0
2
"
2D(z2+r2)1/2−a
2
4
z−D
F13 − z+D
F23
!#
,(10)
F1= h
(z−D)2+a2i1/2, (11) F2=
h
(z+D)2+a2i1/2, (12) where, with the parameters determined by Bunce et al. (2007),µ0I0≈60.4 nT is the ring current,D≈3RS is the
half-thickness of the current sheet,a≈15.5RS is the inner
radius of the region III.
As through using magnetotail models we can only get rough estimates of the flapping frequency for generic magne-totail models; for simplicity we will assume that the space-craft is at the midnight meridian, we can setBx=Brand find
the derivatives that are needed in Eq. (7): dBx
dz = µ0I0
2 ×
"
−a
2
4
z−D
((a2+(z−D)2)3/2−
z+D ((a2+(z+D)2)3/2
+ 2D
(z2+x2)1/2
, (13)
dBz
dx =
µ0I0Dx
(z2+x2)3/2. (14)
−5 0 5
Bx
−5 0 5
By
−5 0 5
Bz
00000 0500 1000 1500 2000 5
10 15
Btot
UT
−2 0 2
Bx
−2 0 2
By
−2 0 2
Bz
1100 0 1130 1200 1230 1300 1330 2
4 6
Btot
UT
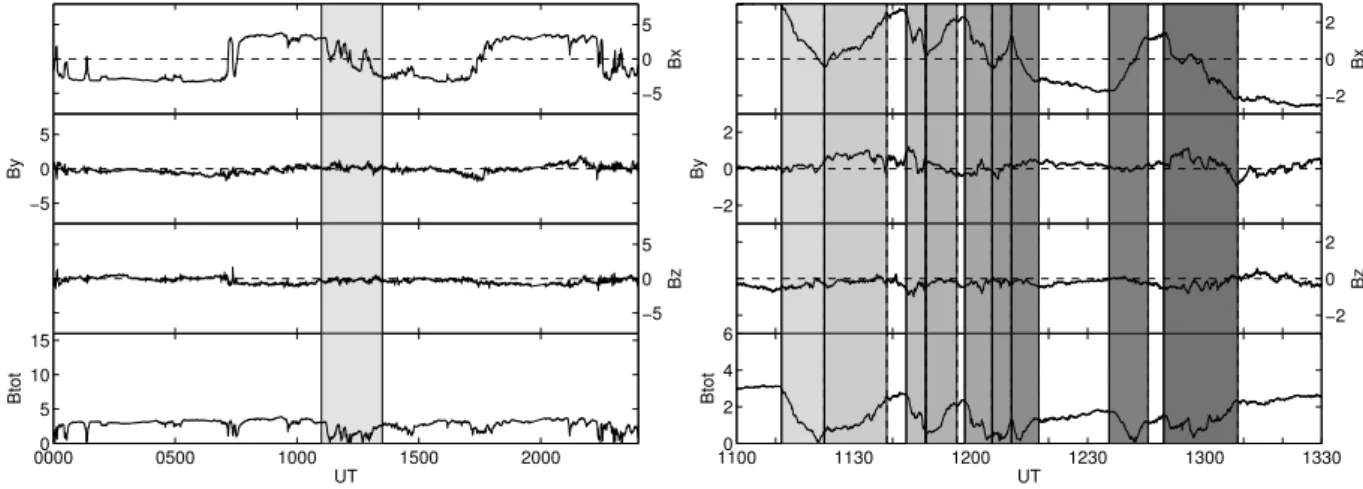
Fig. 8.Saturn flapping event on DOY 265. Format as in Fig. 5.
−10 0 10
Bx
−10 0 10
By
−10 0 10
Bz
00000 0500 1000 1500 2000 10
20
Btot
UT
−5 0 5
Bx
−5 0 5
By
−5 0 5
Bz
19000 1915 1930 1945 5
10
Btot
UT
Fig. 9.Jupiter flapping event on DOY 141. The left panel shows one full day of magnetic field data in JSM coordinates. The right panel shows a zoom in on the yellow shaded part in the left panel, showing the flapping event. The intervals for the MVA analysis are marked with filled areas of different shades of gray.
Fig. 7, and we choose an upper limit N ≤0.1 cm−3 with an average mass of ∼10 AMU. This leads to the follow-ing spread in the Kronian tail for 16≤X≤40 to flapping periods of 15.5≤T ≤49 min. This range is at longer pe-riods than measured above (5–15 min), however, this can well be due to the uncertainties put into this simple model, e.g., a current sheet thinning to half the nominal value, i.e., D⇒1.5RS reduces the period by approximately a factor
1.5. The reason for reducing the half-thickness1is that the Earth magnetotail flapping is more likely to occur when the current sheet is thin (Sergeev et al., 2006b).
3.2 Jupiter
Khurana et al. (2004) describes several models for the Jovian magnetic field, and for the region which is interesting for this paper three models for the current sheet are compared: Connerney et al. (1981) (with a comment by Edwards et al., 2001), Goertz (1976) and Khurana (1997). The qualitative
differences between the three models are shown in Fig. 24.12 in Khurana et al. (2004), and even though the model by Khu-rana (1997) seems to fit the Galileo data best, we opt here to use the model by Goertz (1976). The equations describing the magnetic field are much simpler to manipulate.
For the two important components of the magnetic field needed in Eq. (7) we find the following expressions for the field created by the current sheet:
br=
b0
ra+1tanh
z
D(r)
, (15)
bz=
aCB0D(r)
ra+2 , (16)
whereb0=10−5T,a=0.7, the current sheet half-thickness
can be estimated by D(r) <4.6/r0.3RJ for r >2 and for
variations close to the equatorC≈10 and bothrandzare expressed in Jovian radii. To this, the dipole magnetic field
BD needs to be added. The density of the current sheet is
−20 0 20 Bx −20 0 20 By −20 0 20 Bz
00000 0500 1000 1500 2000 20 40 Btot UT −20 0 20 Bx −20 0 20 By −20 0 20 Bz
2.750 2.83333 2.91667 3 3.08333 20 40 Btot UT −20 0 20 BXr −20 0 20 BYr −20 0 20 BZr
2.750 2.83333 2.91667 3 3.08333
20 40
Btot
UT
Fig. 10.Jupiter flapping event on DOY 173. Left and middle panel format as in Fig. 9. As the data need to be rotated to account for the magnetotail flaring, the right hand panel shows the data in the rotated system.
−10 0 10 Bx −10 0 10 By
0000 0500 1000 1500 2000 −10 0 10
Bz
0 5 10 15 20
0 10 20 30 Btot −10 0 10 Bx −10 0 10 By −10 0 10 Bz
09300 0945 1000 1030 10 20 30 Btot UT −10 0 10 BXr −10 0 10 BYr −10 0 10 BZr
09300 0945 1000 1030
10 20 30
Btot
UT
Fig. 11.Jupiter flapping event on DOY 171. Format as in Fig. 10.
There is no field-line bend-back in this magnetic field model (for that see e.g., Khurana, 1997), and for simplicity we assume that the spacecraft is at midnight local time, so we can saybr=bxand we will replacerwithx. The derivatives
for Eq. (7) are: dBx
dz = b0
xa+1cosh
−2
z
D(x)
D(x)−1, (17) dBz
dx =
−3BD,z
x4 −4.6aCb0(a+2.3)x
−(a+3.3), (18)
where thex variation in the dipole field is neglected. With Galileo located between 25≤x≤80RJ, we find a flapping
period for the Jovian tail of 21.5≤Tflap≤30.5 min, which is
higher than the quasi-periods found above (3–4 min). How-ever, for the current sheet thickness the upper limit is used in this model, reducing that number to one third its value reduces the periods to half their values, closer to what is ob-served, but still off.
4 Current sheet bifurcation
As described in the introduction Israelevich and Ershkovich (2006); Israelevich et al. (2007) studied the bifurcation of the Jovian current sheet during intervals with multiple current sheet crossings observed by Voyager 2 and Galileo. Their conclusion was that a bifurcated current sheet happens only seldomly at Jupiter.
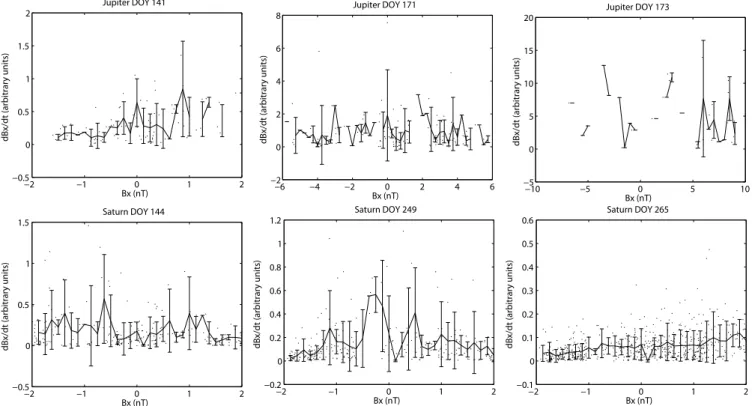
For the six events in this study we calculate the mag-netic gradient. The magmag-netic field gradient is determined be-tween consecutive points, i.e., at Galileo the1t=24 s and for Cassini 10 s (down-sampled from the 1 s resolution of the data in the Kronian magnetotail). The result for the different events are shown in Fig. 12, where the gradients are sorted with respect to the centralBxof the interval and binned with
varying bin sizes per event.
For Jupiter DOY 141 and 171 there is no evidence for a bifurcated current sheet whereas for DOY 173 there is too sparse data to make any conclusion. DOY 141 shows a maxi-mum aroundBx=0, with another maximum around Bx≈
1 which comes from the first part of the interval (19:00– 19:15 UT). DOY 171 shows an almost constant value for dBx/dt, with no indication of bifurcation. For DOY 173
there are too few points in the bins to obtain any informa-tion about the structure of the current sheet. This is in agree-ment with the observations by Israelevich et al. (2007) that bifurcation is seldomly observed in the Jovian tail.
For Saturn DOY 265 there seems little evidence for an actual bifurcated current sheet, with a rather flat curve of dBx/dt. For DOY 144 the behaviour is slightly different,
with elevated gradients aroundBx≈ ±1 nT with respect to
Bx=0. However, the error bars are rather large.
On DOY 249 there are two peaks in dBx/dt at Bx≈
−2 −1 0 1 2 −0.5
0 0.5 1 1.5 2
Bx (nT)
dBx/dt (arbitrary units)
Jupiter DOY 141
−6 −4 −2 0 2 4 6
−2 0 2 4 6 8
Bx (nT)
dBx/dt (arbitrary units)
Jupiter DOY 171
−10 −5 0 5 10
−5 0 5 10 15 20
Bx (nT)
dBx/dt (arbitrary units)
Jupiter DOY 173
−2 −1 0 1 2
−0.5 0 0.5 1 1.5
Bx (nT)
dBx/dt (arbitrary units)
Saturn DOY 144
−2 −1 0 1 2
−0.2 0 0.2 0.4 0.6 0.8 1 1.2
Bx (nT)
dBx/dt (arbitrary units)
Saturn DOY 249
−2 −1 0 1 2
−0.1 0 0.1 0.2 0.3 0.4 0.5 0.6
Bx (nT)
dBx/dt (arbitrary units)
Saturn DOY 265
Fig. 12.Magnetic field gradientsdBx/dt as a function ofBx. For each event the axes have a different ranges and the data are binned differently. Bin sizes: Jupiter DOY 141 – 0.125 nT; Jupiter DOY 171 – 0.25 nT; Jupiter DOY 173 – 0.5 nT; Saturn DOY 144 – 0.125 nT; Saturn DOY 249 – 0.125 nT; Saturn DOY 265 – 0.125 nT.
component between∼04:15 and 04:30 UT the gradient de-termination may be contaminated. Taking out this interval does not improve the result significantly.
5 Discussion
We have performed a first comparative study of magnetotail flapping, comparing the details of the flapping process that were found in the Earth’s magnetotail to the giant planets Jupiter and Saturn. Several events where there are multiple Bx=0 crossings and/or oscillations ofBxwhilst the
space-craft moves from one hemisphere of the tail to the other are studied using minimum variance analysis to obtain the cur-rent sheet normal.
At Earth it has been shown that some of these events are so-called flapping events, where a kink-mode like wave in the magnetotail moves from the centre to the flanks at a slight angle with the midnight meridian. The propagation direction can be determined for the Earth through the multi-spacecraft mission Cluster in combination with the Double Star mis-sion.
Unfortunately, at Jupiter and Saturn there are no multi-spacecraft missions and, thus, we have to identify the pos-sible flapping motion through different methods. We have chosen to look at the current sheet normal during the vari-ous crossings of the neutral sheetBx=0. In case of a wave
moving as mentioned above, the normal is expected to flip-flop in the YZ-plane and have only a minor component inX. In case that plasma data are available the up-and-down veloc-ity of the magnetotail can be determined, which should have a correlation with the time gradient of the magnetic field. Unfortunately, for various reasons plasma data for these six events down the tails of the giant planets that can be used for this kind of analysis are scarce. For three possible flapping events selected at Cassini only for one event the pointing of the spacecraft was adequate to obtain a reliable estimate of theVzcomponent. Thus, the main method for flapping
iden-tification was the current sheet normal direction.
We have shown two events at Saturn that could be identi-fied as flapping based on the current sheet normal direction (DOY 249 and 265) and one event where the MVA analy-sis was inconclusive, but the available plasma data is hard pressed to support the interpretation that the Kronian magne-totail was flapping. Therefore, DOY 144 at Saturn cannot be labelled a magnetotail flapping event.
travelling through the tail at a slight angle with respect to theXJSM-axis near the centre of the tail, propagate under a
greater angle with respect to theXJSM-axis near the flanks,
but not with respect to the rotatedXr-axis. This means that
the waves move with the direction of the magnetic field in the tail.
Estimates for the period of the flapping were obtained from the magnetic field models for Saturn and Jupiter based on the double-gradient instability model. The estimated pe-riods were above those observed, however, this can well be caused by errors in the input parameters for the magneto-plasma in both tails, like the current sheet thickness and the plasma density.
One of the differences between Jupiter, Saturn and the Earth is that the giant planets are rapid rotators, more than twice as fast as the Earth. This could have influence on the observed waves. At Earth a statistical study (Sergeev et al., 2006b) has investigated the occurrence frequency of flap-ping events as a function ofVY, GSM, which shows that,
al-though the distribution function is a narrow Gaussian, for relatively high velocities, 100≤ |VY| ≤500 km s−1, there is
a non-negligible number of events in their study. This range of values forVY, GSM contains the corotational velocities at
the giant planets. However, Sergeev et al. (2006b) do not show any data for events with strongVy, and do not indicate
the wave period for these events. For the DOY 144 event at Saturn, the corotational velocityVφ≈150 km s−1.
Investiga-tions by Runov et al. (2005) using multi-point Cluster mea-surements showed that the timing velocity of the kink-mode wave was equal to the bulk velocity of the plasma, indicat-ing that the ion flow may transport the wave mode at rela-tively small velocitiesVy≈25 km s−1. Higher bulk plasma
flow velocity transporting the kink wave could possibly lead to Doppler shifting. This may be another reason why the esti-mated flapping periods from the generic magnetotail models are higher than what is measured by the spacecraft. Indeed, at dawn the propagation direction of the waves and the corota-tion velocity are in the same direccorota-tion giving a Doppler blue shift.
At Earth it was shown that magnetotail flapping is related to storm or substorm activity in the magnetosphere (see e.g., Davey et al., 2012). We, therefore, compare the Jovian flap-ping events with the list of reconnection events presented by Vogt et al. (2010). It is found that the events of DOY 171 and 173 are during the same time interval at which reconnection was inferred, strengthening the case that in Jupiter magneto-tail flapping is caused by the same kind of driver as at Earth. There were only few flapping events in the datasets that were used in this study, for Saturn five possible events were found of which two (from three in this paper) could be clearly identified as flapping out of 157 tail crossings with multiple neutral sheet crossings. With a substorm occurrence rate of one per 2.4 days one would expect a substorm for every 5 neutral sheet crossings, which, however, need not be detected by the spacecraft if the flow channels are of limited width as
at Earth (see e.g., Nakamura et al., 2004). Also, the predispo-sition of the current sheet for the “double gradient instabil-ity” may not occur as often in the Kronian magnetosphere. Similar comments can be made for the Jovian magnetotail.
A question can arise whether a bifurcated current sheet can produce a flapping signature when the spacecraft passes through. A crossing of a bifurcated current sheet would give rise to a signature in which Bx decreases, then increases
again and then decreases, however, it will not necessarily lead toBx=0 crossings depending on the orbit of the
space-craft (see e.g., Runov et al., 2003, 2004), which were a re-quirement for the search of flapping events. Naturally, it can-not be excluded that current sheet bifurcation can play a part in the signatures that are measured, however, in this paper the study of possible bifurcation of the current sheets at Jupiter and Saturn showed that for only one event a case could be made.
Further statistical studies of magnetotail flapping at Jupiter and Saturn, using Galileo and Cassini data are planned to be performed in the near future. Some of the topics that cannot be addressed in a case study like this one are: Is magnetotail flapping dependent on local time; What is driving magneto-tail flapping (one presented case shows a connection to mag-netic reconnection); What is the occurrence rate of flapping events in comparison to that of magnetic reconnection. Some of these questions should be addressed before the arrival of Juno and JUICE at Jupiter, which then can deliver more ob-servations.
Acknowledgements. Part of the work was done for ISSI working
group number 195, “Investigating the Dynamics of Planetary Mag-netotails”, led by CMJ. MV would like to thank Hans Eichelberger for producing the Cluster and DoubleStar data, and Michelle Thom-son and Rob WilThom-son for their help with the Cassini CAPS data. CMJ’s work at UCL is supported by a Leverhulme Trust Early Ca-reer Fellowship and a Royal Astronomical Society Fellowship. AR is funded by the Belgian Fund for Scientific Research (FNRS). XJ was supported by NASA through grant NNX12AK34G and by the Cassini mission under contract JPL 1409449. APW holds an ESA Fellowship.
Topical Editor I. A. Daglis thanks four anonymous referees for their help in evaluating this paper.
References
Andrews, D. J., Cowley, S. W. H., M. K, D., Lamy, L., Provan, G., and Southwood, D. J.: Planetary period oscillations in Saturn’s magnetosphere: Evolution of magnetic oscillations from south-ern summer to post-equinox, J. Geophys. Res., 117, A04224, doi:10.1029/2011JA017444, 2012.
Arridge, C. S., Achilleos, N., Dougherty, M. K., Khurana, K. K., and Russell, C. T.: Modeling the size and shape of Saturn’s mag-netopause with variable dynamic pressure, J. Geophys. Res., 111, A11227, doi:10.1029/2005JA011574, 2006.
Leinweber, H. K.: Warping of Saturn’s magnetospheric and magnetotail current sheets, J. Geophys. Res., 113, a08217, doi:10.1029/2007JA012963, 2008.
Arridge, C. S., Andr´e, N., Khurana, K. K., Russell, C. T., Cowley, W. H., Provan, G., Andrews, D. J., Jackman, C. M., Coates, A. J., Sittler, E. C., Doughterty, M. K., and Young, D. T.: Periodic mo-tion of Saturn’s nightside plasma sheet, J. Geophys. Res., 116, A11205, doi:10.1029/2011JA016827, 2011.
Bagenal, F., Dowling, T. E., and McKinnon, W. B.: Jupiter: The planet, Satellites and Magnetosphere, Cambridge University Press, Cambridge, UK, 2004.
Balogh, A., Carr, C. M., Acu˜na, M. H., Dunlop, M. W., Beek, T. J., Brown, P., Fornacon, H., Georgescu, E., Glassmeier, K.-H., Harris, J., Musmann, G., Oddy, T., and Schwingenschuh, K.: The Cluster Magnetic Field Investigation: overview of in-flight performance and initial results, Ann. Geophys., 19, 1207–1217, doi:10.5194/angeo-19-1207-2001, 2001.
Belenkaya, E. S., Bobrovnikov, S. Y., Alexeev, I. I., Kalegaev, V. V., and Cowley, S. W. H.: A model of Jupiter’s magnetospheric mag-netic field with variable magnetopause flaring, Planet. Space Sci., 53, 863–872, 2005.
Bunce, E. J., Cowley, S. W. H., Alexeev, I. I., Arridge, C. S., Dougherty, M. K., Nichols, J. D., and Russell, C. T.: Cassini observations of the variation of Saturn’s ring current pa-rameters with system size, J. Geophys. Res., 112, A10202, doi:10.1029/2007JA012275, 2007.
Carr, C., Brown, P., Zhang, T. L., Gloag, J., Horbury, T., Lucek, E., Magnes, W., O’Brien, H., Oddy, T., Auster, U., Austin, P., Aydogar, O., Balogh, A., Baumjohann, W., Beek, T., Eichel-berger, H., Fornacon, K.-H., Georgescu, E., Glassmeier, K.-H., Ludlam, M., Nakamura, R., and Richter, I.: The Double Star magnetic field investigation: instrument design, performance and highlights of the first year’s observations, Ann. Geophys., 23, 2713–2732, doi:10.5194/angeo-23-2713-2005, 2005.
Connerney, J. E. P., Acuna, H. M., and Ness, N. F.: Modeling the jovian current sheet and inner magnetosphere, J. Geophys. Res., 87, 8370–8384, 1981.
Cowley, S. W. H.: Magnetospheric asymmetries associated with the y-component of the IMF, Planet. Space Sci., 29, 79–96, 1981. Davey, E. A., Lester, M., Milan, S. E., and Fear, R. C.: Storm and
substorm effects on magnetotail current sheet motion, J. Geo-phys. Res., 117, A02202, doi:10.1029/2011JA017112, 2012. Dessler, A. J.: Physics of the Jovian Magnetosphere, Cambridge
University Press, Cambridge, UK, 1983.
Dougherty, M. K., Kellock, S., Southwood, D. J., Balogh, A., Tsu-rutani, E. J. S. B. T., Gerlach, B., Glassmeier, K.-H., Gleim, F., Russell, C. T., Erdos, G., Neubauer, F. M., and Cowley, S. W. H.: The Cassini magnetic field investigation, Space Sci. Rev., 114, 331–383, doi:10.1007/s11214-004-1432-2, 2004.
Dougherty, M. K., Achilleos, N., Andr´e, N., Arridge, C. S., Balogh, A., Bertucci, C., Burton, M. E., Cowley, S. W. H., Erdos, G., Giampieri, G., Glassmeier, K.-H., Khurana, K. K., Leis-ner, J., Neubauer, F. M., Russell, C. T., Smith, E. J., South-wood, D. J., and Tsurutani, B. T.: Cassini magnetometer obser-vations during Saturn orbit insertion, Science, 307, 1266–1270, doi:10.1126/science.1106098, 2005.
Edwards, T. M., Bunce, E. J., and Cowley, S. W. H.: A not on the vector potential of Connerney et al.’s model of the equatorial current sheet in Jupiter’s magnetosphere, Planet. Space Sci., 49,
1115–1123, 2001.
Erkaev, N. V., Semenov, V. S., and Biernat, H. K.: Magnetic double gradient mechanism for flapping oscillations of a current sheet, Geophys. Res. Lett., 35, L02111, doi:10.1029/2007GL032277, 2008.
Erkaev, N. V., Semenov, V. S., Kubyshkin, I. V., Kubyshkina, M. V., and Biernat, H. K.: MHD model of the flapping motions in the magnetotail current sheet, J. Geophys. Res., 114, A03206, doi:10.1029/2008JA013728, 2009.
Erkaev, N. V., Semenov, V. S., and Biernat, H. K.: Hall magnetohy-drodynamic effect for current sheet flapping oscillations related to the magnetic double gradient mechanism, Phys. Plasma, 17, 060703, doi:10.1063/1.3439687, 2010.
Fairfield, D. H.: Avarage and unusual locations of the Earth’s mag-netopause and bow shock, J. Geophys. Res., 76, 6700–6716, 1971.
Forsyth, C., Lester, M., Fear, R. C., Lucek, E., Dandouras, I., Faza-kerley, A. N., Singer, H., and Yeoman, T. K.: Solar wind and substorm excitation of the wavy current sheet, Ann. Geophys., 27, 2457–2474, doi:10.5194/angeo-27-2457-2009, 2009. Goertz, C. K.: The current sheet in Jupiter’s magnetosphere, J.
Geo-phys. Res., 81, 3368–3372, 1976.
Golovchanskaya, I. V. and Maltsev, Y. P.: On the identification of plasma sheet flapping waves observed by Cluster, Geophys. Res. Lett, 32, L02102, doi:10.1029/2004GL021552, 2005.
Harris, E. G.: On a plasma sheet separating regions of oppositely directed magnetic field, Nuovo Cimento, 23, 115–121, 1962. Harvey, C. C.: Spatial gradients and volumetric tensor, in: Analysis
Methods for Multi-Spacecraft Data, edited by: Paschmann, G. and Daly, P., pp. 307–322, ESA, Noordwijk, 1998.
Hesse, M. and Schindler, K.: Bifurcation of current sheets in plas-mas, Phys. Fluids, 29, 2484–2492, 1986.
Hones, E. W., Baker, D. N., Bame, S. J., Feldman, W. C., Gosling, J. T., McComas, D. J., Zwickl, R. D., Slavin, J. A., Smith, E. J., and Tsurutani, B. T.: Structure of the magnetotail at 220REand its response to geomagnetic activity, J. Geophys. Res., 11, 5–7, 1984.
Huddleston, D. E., Russell, C. T., Kivelson, M. G., Khurana, K. K., and Bennett, L.: Location and shape of the Jovian magnetopause and bow shock, J. Geophys. Res., 103, 20075–20082, 1998. Israelevich, P. L. and Ershkovich, A. I.: Bifurcation of Jovian
magnetotail current sheet, Ann. Geophys., 24, 1479–1481, doi:10.5194/angeo-24-1479-2006, 2006.
Israelevich, P. L., Ershkovich, A. I., and Oran, R.: Bifurcation of the tail current sheet in Jovian magnetosphere, Planet. Space Sci., 55, 2261–2266, 2007.
Jackman, C. M., Russell, C. T., Southwood, D. J., Arridge, C. S., Achilleos, N., and Dougherty, M. K.: Strong rapid dipolariza-tions in Saturn’s magnetotail: In situ evidence of reconnection, Geophys. Res. Lett., 34, L11203, doi:10.1029/2007GL029764, 2007.
Jackman, C. M., Arridge, C. S., Krupp, N., Bunce, E. J., Mitchell, D. G., McAndrews, H. J., Dougherty, M. K., Russell, C. T., Achilleos, N., Jones, G. H., and Coates, A. J.: A multi-instrument view of tail reconnection at Saturn, J. Geophys. Res., 113, A11213, doi:10.1029/2008JA013592, 2008.
mag-netospheric periodicities, Geophys. Res. Lett., 36, L16101, doi:10.1029/2009GL039149, 2009.
Jackman, C. M., Slavin, J. A., and Cowley, S. W. H.: Cassini observations of plasmoid structure and dynamics: Implica-tions for the role of magnetic reconnection in magneto-spheric circulation at Saturn, J. Geophys. Res., 116, A10212, doi:10.1029/2011JA016682, 2011.
Joy, S. P., Kivelson, M. G., Walker, R. J., Khurana, K. K., Russell, C. T., and Ogino, T.: Probabilistic models of the Jovian magne-topause and bow shock locations, J. Geophys. Res., 107, 1309, doi:10.1029/2001JA009146, 2002.
Khurana, K. K.: Euler potential models of Jupiter’s magnetospheric field, J. Geophys. Res., 102, 11295–11306, 1997.
Khurana, K. K. and Kivelson, M. G.: On Jovian plasma sheet struc-ture, J. Geophys. Res., 94, 11791–11803, 1989.
Khurana, K. K. and Schwarzl, H. K.: Global structure of Jupiter’s magnetosspheric current sheet, J. Geophys. Res., 110, A07227, doi:10.1029/2004JA010757, 2005.
Khurana, K. K., Kivelson, M. G., Vasiliunas, V. M., Krupp, N., Woch, J., Lagg, A., Mauk, B. H., and Kurth, W. S.: The con-figuration of Jupiter’s magnetosphere, in: Jupiter: The Planet, Satellites and Magnetosphere, edited by: Bagenal, F., Dowling, T. E., and McKinnon, W. B., pp. 593–616, Cambridge Univer-sity Press, Cambridge, UK, 2004.
Kivelson, M. G., Khurana, K. K., Means, J. D., Russell, C. T., and Snare, R. C.: The Galileo magnetic field investigation, Space Sci. Rev., 60, 357–383, 1992.
Lui, A. T. Y., Meng, C.-I., and Akasofu, S.-I.: Wavy nature of the magnetotail neutral sheet, Geophys. Res. Lett., 5, 279–282, 1978. Masters, A., Thomsen, M. F., Badman, S. V., Arridge, C. S., Young, D. T., Coates, A. J., and Dougherty, M. K.: Supercorotating re-turn flow from reconnection in Sare-turn’s magnetotail, Geophys. Res. Lett, 38, L03103, doi:10.1029/2010GL046149, 2011. Nakamura, R., Baumjohann, W., Mouikis, C., Kistler, L. M., Runov,
A., Volwerk, M., Asano, Y., V¨or¨os, Z., Zhang, T. L., Klecker, B., R`eme, H., and Balogh, A.: Spatial scale of high-speed flows in the plasma sheet observed by Cluster, Geophys. Res. Lett., 31, L09894, doi:10.1029/2004GL019558, 2004.
Provan, G., Andrews, D. J., Arridge, C. S., Coates, A. J., Cow-ley, S. W. H., Cox, G., Dougherty, M. K., and Jackman, C. M.: Dual periodicities in planetary-period magnetic field oscillations in Saturn’s tail, J. Geophys. Res., 117, A01209, doi:10.1029/2011JA017104, 2012.
Runov, A., Nakamura, R., Baumjohann, W., Zhang, T. L., Volw-erk, M., Eichelberger, H.-U., and Balogh, A.: Cluster observa-tion of a bifurcated current sheet, Geophys. Res. Lett., 30, 1036, doi:10.1029/2002GL016136, 2003.
Runov, A., Sergeev, V., Nakamura, R., Baumjohann, W., V¨or¨os, Z., Volwerk, M., Asano, Y., Klecker, B., R`eme, H., and Balogh, A.: Properties of a bifurcated current sheet observed on 29 Au-gust 2001, Ann. Geophys., 22, 2535–2540, doi:10.5194/angeo-22-2535-2004, 2004.
Runov, A., Sergeev, V. A., Baumjohann, W., Nakamura, R., Ap-atenkov, S., Asano, Y., Volwerk, M., V¨or¨os, Z., Zhang, T. L., Petrukovich, A., Balogh, A., Sauvaud, J.-A., Klecker, B., and R`eme, H.: Electric current and magnetic field geometry in flap-ping magnetotail current sheets, Ann. Geophys., 23, 1391–1403, doi:10.5194/angeo-23-1391-2005, 2005.
Sergeev, V., Angelopulous, V., Carlson, C., and Sutcliffe, P.: Current sheet measurements within a flapping plasma sheet, J. Geophys. Res., 103, 9177–9188, 1998.
Sergeev, V., Runov, A., Baumjohann, W., Nakamura, R., Zhang, T. L., Volwerk, M., Balogh, A., R`eme, H., Sauvaud, J.-A., Andr´e, M., and Klecker, B.: Current sheet flapping motion and structure observed by Cluster, Geophys. Res. Lett., 30, 1327, doi:10.1029/2002GL016500, 2003.
Sergeev, V., Runov, A., Baumjohann, W., Nakamura, R., Zhang, T. L., Balogh, A., Louarn, P., Sauvaud, J.-A., and R`eme, H.: Ori-entation and propagation of current sheet oscillations, Geophys. Res. Lett., 31, L05807, doi:10.1029/2003GL019346, 2004. Sergeev, V. A., Rounov, A., Baumjohann, W., Nakamura, R., Zhang,
T. L., Apatenkov, S., Balogh, A., R`eme, H., and Sauvaud, J.-A.: Cluster results on the magnetotail current sheet structure and dy-namics, in: Proceedings Cluster and Double Star Symposium – 5th Anniversary of Cluster in Space, edited by: Fletcher, K., p. P9.2, ESA SP, Noordwijk, 2006a.
Sergeev, V. A., Sormakov, D. A., Apatenkov, S. V., Baumjohann, W., Nakamura, R., Runov, A. V., Mukai, T., and Nagai, T.: Sur-vey of large-amplitude flapping motions in the midtail current sheet, Ann. Geophys., 24, 2015–2024, doi:10.5194/angeo-24-2015-2006, 2006b.
Sergis, N., Arridge, C. S., Krimigis, S. M., Mitchell, D. G., Rymer, A. M., Hamilton, D. C., Krupp, N., Dougherty, M. K., and Coates, A. J.: Dynamics and seasonal variations in Saturn’s mag-netospheric plasma sheet, as measured by Cassini, J. Geophys. Res., 116, A04203, doi:10.1029/2010JA016180, 2011.
Sonnerup, B. and Cahill, L.: Magnetopause structure and attitude from Explorer 12 observations, J. Geophys. Res., 72, 171–183, 1967.
Sonnerup, B. U. ¨O. and Scheible, M.: Minimum and maximum vari-ance analysis, in: Analysis Methods for Multi-Spacecraft Data, edited by: Paschmann, G. and Daly, P., pp. 185–220, ESA, No-ordwijk, 1998.
Speiser, T. W. and Ness, N. F.: The neutral sheet in the geomagnetic tail: Its motion, equivalent currents, and field line reconnection through it, J. Geophys. Res., 72, 131–141, 1967.
Toichi, T. and Miyazaki, T.: Flapping motions of the tail plasma sheet induced by the interplanetary magnetic field variations, Planet. Space. Sci., 24, 147–159, 1976.
Vogt, M. F., Kivelson, M. G., Khurana, K. K., Joy, S. P., and Walker, R. J.: Reconnection and flows in the Jovian magnetotail as in-ferred from magnetometer observations, J. Geophys. Res., 115, A06219, doi:10.1029/2009JA015098, 2010.
Volwerk, M., Zhang, T. L., Nakamura, R., Runov, A., Baumjohann, W., Glassmeier, K.-H., Takada, T., Eichelberger, H. U., Carr, C. M., Balogh, A., Klecker, B., and R`eme, H.: Plasma flow channels with ULF waves observed by Cluster and Double Star, Ann. Geo-phys., 23, 2929–2935, doi:10.5194/angeo-23-2929-2005, 2005. Young, D. T., Berthelier, J. J., Blanc, M., Burch, J. L., Coates, A. J.,
Narheim, B. T., Nordholt, J. E., Preece, A., Rudzki, J., Ruitberg, A., Smith, K., Szalai, S., Thomsen, M. F., Viherkanto, K., Vilp-pola, J., Vollmer, T., Wahl, T. E., W¨uest, M., Ylikorpi, T., and Zinsmeyer, C.: Cassini plasma spectrometer investigation, Space Sci. Rev., 114, 1–112, doi:10.1007/s11214-004-1406-4, 2004. Zhang, T. L., Baumjohann, W., Nakamura, R., Balogh, A.,
and Glassmeier, K.-H.: A wavy twisted neutral sheet
observed by Cluster, Geophys. Res. Lett., 29, 1899,
doi:10.1029/2002GL015544, 2002.
Zhang, T. L., Nakamura, R., Volwerk, M., Runov, A., Baumjohann, W., Eichelberger, H. U., Carr, C., Balogh, A., Sergeev, V., Shi, J. K., and Fornacon, K.-H.: Double Star/Cluster observation of neutral sheet oscillations on 5 August 2004, Ann. Geophys., 23, 2909–2914, doi:10.5194/angeo-23-2909-2005, 2005.