Cadmium Transfer from Soil to Corn Grain
Hua Yang1,2, Zhaojun Li1*, Lu Lu3, Jian Long2, Yongchao Liang1
1Institute of Agricultural Resources and Regional Planning, Chinese Academy of Agricultural Sciences, Key Laboratory of Plant Nutrition and Fertilizer, Ministry of Agriculture, Beijing, China,2Guizhou Key Laboratory of Mountain Environment, Guizhou Normal University, Guiyang, China,3Graduate School of the Chinese Academy of Agricultural Sciences, Beijing, China
Abstract
Cadmium (Cd) is a highly toxic heavy metal for both plants and animals. The presence of Cd in agricultural soils is of great concern regarding its transfer in the soil-plant system. This study investigated the transfer of Cd (exogenous salts) from a wide range of Chinese soils to corn grain (Zhengdan 958). Through multiple stepwise regressions, prediction models were developed, with the combination of Cd bioconcentration factor (BCF) of Zhengdan 958 and soil pH, organic matter (OM) content, and cation exchange capacity (CEC). Moreover, these prediction models from Zhengdan 958 were applied to other non-model corn species through cross-species extrapolation approach. The results showed that the pH of the soil was the most important factor that controlled Cd uptake and lower pH was more favorable for Cd bioaccumulation in corn grain. There was no significant difference among three prediction models in the different Cd levels. When the prediction models were applied to other non-model corn species, the ratio ranges between the predicted BCF values and the measured BCF values were within an interval of 2 folds and close to the solid line of 1:1 relationship. Furthermore, these prediction models also reduced the measured BCF intra-species variability for all non-model corn species. Therefore, the prediction models established in this study can be applied to other non-model corn species and be useful for predicting the Cd bioconcentration in corn grain and assessing the ecological risk of Cd in different soils.
Citation:Yang H, Li Z, Lu L, Long J, Liang Y (2013) Cross-Species Extrapolation of Prediction Models for Cadmium Transfer from Soil to Corn Grain. PLoS ONE 8(12): e80855. doi:10.1371/journal.pone.0080855
Editor:Xianglin Shi, University of Kentucky, United States of America
ReceivedJuly 31, 2013;AcceptedOctober 9, 2013;PublishedDecember 6, 2013
Copyright:ß2013 Yang et al. This is an open-access article distributed under the terms of the Creative Commons Attribution License, which permits unrestricted use, distribution, and reproduction in any medium, provided the original author and source are credited.
Funding:This work was jointly supported by the Special Fund of Public Industry in China (Agriculture, project No. 200903015; website: http://www.most.gov.cn/) and the Natural Science Foundation of Institute of Agricultural Resources and Regional Planning, Chinese Academy of Agricultural Sciences (Project No.2013-9; website:http://www.iarrp.cn). The funders had no role in study design, data collection and analysis, decision to publish, or preparation of the manuscript.
Competing Interests:The authors have declared that no competing interests exist.
* E-mail: [email protected]
Introduction
Trace metal elements accumulation in crop of agricultural soils is of extensive concern due to its potential risks to human health and detrimental effects on soil ecosystems [1–4]. Cadmium (Cd) is one of the most dangerous trace elements because excessive dietary intake of Cd and its accumulation in human organs over a lifetime can lead to kidney malfunction [5–8].
Numerous studies have demonstrated that a number of factors affect Cd bioavailability in soils, including soil pH, organic matter (OM), cation exchange capacity (CEC), cultivars of crop plants, plant age, and so on [9–13]. Among these soil properties, the pH plays the most important role in determining metal speciation, due to its strong effects on solubility and speciation of metals in the soil and solution [14–15]. Dramatic increases in Cd desorption from soil constituents and its dissolution ability in solution have been observed with the decreasing soil pH [16–17]. The bioavailability of Cd in soil also increases when soil pH decreases [18–23]. Apart from soil pH, OM in soil is another important factor affecting heavy metal availability. It was reported that heavy metal adsorption onto soil constituents declined when organic matter content in soils decreased [24–25], and that the ability of plants to Cd uptake decreased with an increase in soil organic matter [26–27].
The influence of soil factors derived from the soil types on plant uptake of heavy metals and the difficulties in assessing the ecological risk of heavy metals in complex soil types have urged the research on prediction models that can predict trace element transfer to plant [28–30]. These models provide great opportu-nities to carry out ecological risk assessments and establish soil quality criteria for heavy metals [31–32]. However, the influences of soil factors may result in variability of ecological risk assessments in different soils and of the soil quality criteria for heavy metals [33]. Therefore, when the soil environmental quality standard is established based on the species sensitivity distributions (SSD), which are routinely used in ecological risk assessment procedures [34–35], the toxicology data from the soils with different properties need to be normalized using toxicity prediction models to eliminate the influence of soil factors [36]. The normalization of toxicology data can also improve the accuracy of the sensitivity distribution of species and environmental quality standard values [37]. Ideally, separate species-specific models should be developed for each single species. However, this is unrealistic due to the expenses and efforts involved. Thus, for practical reason, the cross-species extrapolation of biological toxicity model was applied in some cases of pollutants risk assessment. For example, Deleebeeck et al. [38–39] have applied biotic bigand model (BLM) from O.
developed for the cladocera such asDaphnia magnaandCeriodaphnia dubia to predict chronic toxicity of nickel to three other invertebrates including snail (Lymnaea stagnalis), insect (Chironomus tentans), and rotifer (Brachionus calyciflorus). However, little effort has been devoted to establishing models to describe the relationship between Cd uptake of corn grain and soil properties. In addition, the cross-species extrapolation approach has rarely been applied to terrestrial ecosystem. The objectives of this study are: 1) to develop the models for predicting Cd accumulation in corn grain on seventeen soils with greatly different properties, 2) to assess the feasibility of applying these models to other non-model corn species, and 3) to investigate their accuracy in predicting accumulation of Cd in non-model corn species.
Materials and Methods
None of these 17 soil samples were collected from national parks or other protected areas. It is confirmed that no specific permissions were required for the soils sampling activities in the 17 locations in China. It is also can be confirmed that the field studies did not involve endangered or protected species. No tested corn species are under first- or second-class state protection, and they are not listed in the Inventory of Rare and Endangered Plants
of China (http://zrbhq.forestry.gov.cn/portal/zrbh/s/3053/ content-457748.html), or the Key Protected Inventory of Wild Plants of China (http://zrbhq.forestry.gov.cn/uploadfile/zrbh/ 2010-10/file/2010-10-14-bb296addeaa047798d6b6c476aaa1da9. doc). These corn species were used for only scientific research as permitted by the Ministry of Agriculture of China.
Soil samples
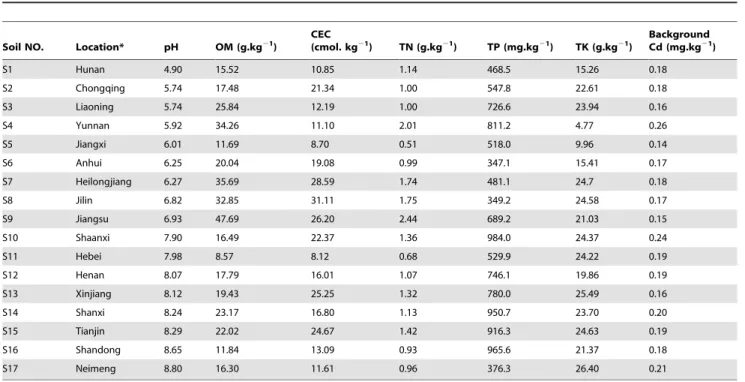
A set of 17 soils covering a wide range of soil properties was collected from typical locations in China. In each sample location, the soils were collected from the top 20 cm of the soil profile. For analysis of their phys-chemical characteristics, the soils were air dried and sorted to pass a 2-mm sieve. Soil pH was measured in deionized water (soil:solution ratio, 1:5) [40]. Cation exchange capacity (CEC) was determined by the unbuffered silver-thiourea method [41]. OM was measured by dry combustion [42]. The total phosphorus in soils (TP) was measured by colorimetric method [43]. The total nitrogen in soils was determined by the Kjeldahl’s method [44]. The background Cd content in the soils was determined by aqua regia (1:3 fresh mixture of concentrated HNO3and HCl) digestion [45]. The selected properties of the 17 soil samples were shown in Table 1.
Experimental design
Bioaccumulation factors for Cd by corn with one species
from seventeen soils. According to Grade Two Standard for
Cd in the Soil Environmental Quality Standards of China (GB15618–1995), the tested levels of Cd in soils were shown in Table 2. To obtain the tested levels, a certain amount of exogenous Cd (3[CdSO4].8H2O) was added to the 8 kg air-dried soils. All the soils were thoroughly mixed and placed into pots. Then the soils were moistened with deionized water to the 60% of field moisture capacity. Each tested level of Cd was carried out in triplicate. The soils containing Cd at different levels were covered by plastic film with several pores. For Cd aging, all the pots were
S7 Heilongjiang 6.27 35.69 28.59 1.74 481.1 24.7 0.18
S8 Jilin 6.82 32.85 31.11 1.75 349.2 24.58 0.17
S9 Jiangsu 6.93 47.69 26.20 2.44 689.2 21.03 0.15
S10 Shaanxi 7.90 16.49 22.37 1.36 984.0 24.37 0.24
S11 Hebei 7.98 8.57 8.12 0.68 529.9 24.22 0.19
S12 Henan 8.07 17.79 16.01 1.07 746.1 19.86 0.19
S13 Xinjiang 8.12 19.43 25.25 1.32 780.0 25.49 0.16
S14 Shanxi 8.24 23.17 16.80 1.13 950.7 23.70 0.20
S15 Tianjin 8.29 22.02 24.67 1.42 916.3 24.63 0.19
S16 Shandong 8.65 11.84 13.09 0.93 965.6 21.37 0.18
S17 Neimeng 8.80 16.30 11.61 0.96 376.3 26.40 0.21
*Soil sample locations are listed in the order of increasing pH. doi:10.1371/journal.pone.0080855.t001
Table 2.Soil Environmental Quality Standards of China (GB15618–1995) and the content of exogenous Cd (mg.kg21).
pH ,6.5 6.5,7.5 .7.5
Grade Two Standard 0.3 0.3 0.6
Low Cd 0.3 0.3 0.6
High Cd 0.6 0.6 1.0
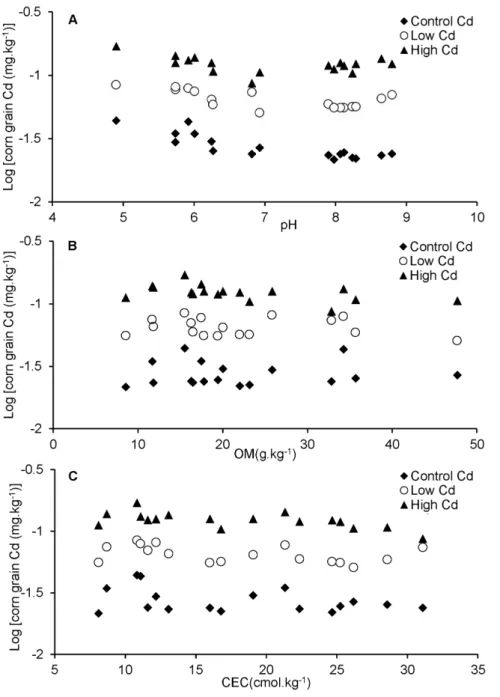
kept for 3 months at a greenhouse at the temperature of 2563uC during the daytime and 2063uC at night with a natural light photoperiod. During the period of aging, water contents of each soil sample were retained by adding deionized water every 3 days. Figure 1. Relationships between Cd in corn grain and (A) soil pH, (B) organic matter (OM) and (C) cation exchange capacity (CEC). doi:10.1371/journal.pone.0080855.g001
Table 3.Prediction models for the different Cd levels.
Model No.
Cadmium levels
Prediction
models R2 P
Model 1 Control Cd Log[BCF] =20.081pH-0.254 0.728 ,0.001
Model 2 Low Cd Log[BCF] =20.104pH-0.170 0.811 ,0.001
Model 3 High Cd Log[BCF] =20.079pH-0.280 0.713 ,0.001
doi:10.1371/journal.pone.0080855.t003 Figure 2. Effects of soil types on the transfer factor based on
Table
4.
Intrinsic
sensitivity
(
k
)
for
non-model
species
fitted
by
models
from
cultivar
Zhengdan
958.
Intrinsic
sensitivities
(
k
)
Prediction
Model
Jingketian
183
Chuandan
30
Liaodan
565
Tunyu
88
Zhongdan
808
Model
1
2
0.284
2
0.284
2
0.339
2
0.418
2
0.324
Model
2
2
0.128
2
0.123
2
0.175
2
0.254
2
0.164
Model
3
2
0.302
2
0.299
2
0.353
2
0.432
2
0.338
doi:10.1371/journal.pone.0080
855.t004
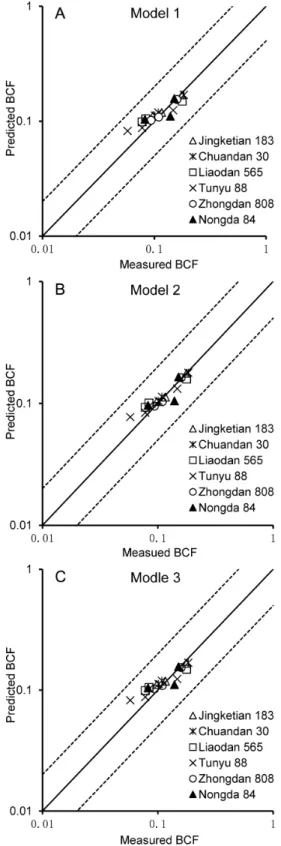
Figure 3. Relativity between measured and predicted BCF
values for Cd in non-model corn grains.The predicted BCF values
in Figure 3 were estimated by (A) model 1, (B) model 2, and (C) model 3 in Table 3. The solid line represents a 1:1 relationship; the dashed lines indicate a 2-fold prediction interval between the predicted and measured values.
After 3 months’ aging, uniformed seeds of corn (Zea mayL. cv. Zhengdan 958) were sown in each soil containing Cd.
Bioaccumulation factors for Cd of eight corn species from
three soils. Three soils with typical properties sampled from
Jiangxi, Shaanxi, and Shanxi provinces were selected for this experiment. The tested levels of Cd in soils and exogenous Cd addition were the same as those in the experiment of bioaccumu-lation factors for Cd by corn from different soils. Triplicate was conducted on each tested level of Cd. After three months’ aging of soils, the seeds of corn (cv. Jingketian 183, Chuandan 30, Liaodan 565, Tunyu 88, Zhongdan 808 and Nongda 84) were surface sterilized with 1% (v/v) NaOCl, rinsed, and soaked in distilled water for 24 h at 33uC in the dark. Then these seeds were sown in each soil containing Cd. All these pots were placed in the greenhouse at the temperature of 2563uC during the daytime and 2063uC at night with a natural light photoperiod.
Experimental soil sampling and analysis
After three months’ aging, soils in the pots of the above two experiments were sampled, air-dried, passed through a,0.20 mm sieve, and then thoroughly mixed. 0.5 g of the soil sample was weighed and added to digestion tubes containing 9 ml HNO3and 3 ml HF. The corn grains were harvested through being oven-dried at 105uC for 30 minutes and kept at 70uC until the weight of the grains was stable. The samples (0.5 g) were digested in 6 ml concentrated HNO3(70% w/v) and 3 ml H2O2in a CEM Mars X microwave oven (CEM Mars) at a pressure of 3.1 MPa. The Cd concentrations in the digestion solution from soil and corn grain samples were measured by inductively coupled plasma-mass spectrometry (ICP-MS, Agilent 7500a, Agilent Technologies Co. Ltd., USA).
Data analysis
The bioconcentration factor (BCF) was calculated as the ratio of the content of Cd in the corn grain to that in the soil (Equation 1)
[46–47].
BCF~Cgrain=Csoil ð1Þ
WhereCgrainis the Cd concentration in the corn grain and Csoilis Cd concentration in the soil.
SPSS 16.0 for WindowsH 107 (SPSS Inc, Chicago, IL, USA) was used for the regression analysis and statistical analysis of the significant differences. Origin 8.0 (OriginLab Co., Northampton, MA, USA) was employed for figure rendering.
Model
The prediction models for Cd transfer were established through multiple stepwise regression of the Cd BCF from Zhengdan 958 in a wide range of soil properties. These models are based on equation 2.
Log BCF½ ~a|pHzb|log½OMzc|log½CECzk ð2Þ
Where Log[BCF], log[OM], and log[CEC] were the logarithm base 10 of the BCF values, the content of organic matter (g.kg21) in soils, and the cation exchange capacity (cmol.kg21
) of soils, respectively. The slope of soil property parameters such as a, b and c indicate the impacts of soil properties on heavy metal. The interceptkis the intrinsic sensitivity that characterizes the species absorbing Cd.
Cross-species extrapolation
In the process of cross-species extrapolation, an interim alternative was to assume that interactions among Cd and pH, OM, CEC were the same among related species. In other words, the models stability constants including a, b, c were assumed the same among related species, and the only difference between related species was assumed to be their intrinsic sensitivity (k) [33]. The variation of intrinsic sensitivities within a species among
Figure 4. Intra-species variability of Cd BCFThe data from all non-model corn species were normalized with the models listed in Table 3.
doi:10.1371/journal.pone.0080855.g004
Table 5.Soil properties and BCF values for Cd in non-model wheat grain [61].
BCF
Cultivation soil pH OM(%) CEC(mequiv./100g) Anomol Tj-83 Abadgar Mehran
Soil 7.53 75.2 15.0 0.241 0.332 0.266 0.417
Sewage 7.70 87.6 20.8 0.179 0.311 0.287 0.375
plants reflects residual variation [36]. According to the minimum squared error between predicted BCF value and the measured
BCF value X
n
i~1
(measured BCFi{predicited BCFi)2, the
inter-cept (k) for different models corresponding to various species were obtained through Excel Solver for linear optimization [32].
The accuracy of the model predictions was evaluated by comparing the measured BCF of the other non-model corn species with the predicted BCF from the model. The predictions for other non-model corn species were calculated with the prediction model developed for Zhengdan 958 [48].
Analysis of the reduction of intra-species variability The Cd BCF values of non-model corn species were normalized to the specific soil conditions by means of the obtained model for Zhengdan 958 and equation 3.
ffiffiffiffiffiffiffiffiffiffiffiffiffiffiffiffiffiffiffiffiffiffiffiffiffiffiffiffiffiffiffiffiffiffiffiffiffiffiffiffiffiffi Pn
i~1
(BCFsi{BCFs)2
(n{1)|(BCFs)2 v
u u u
t ð3Þ
Where the BCF of i-th conditions for specific corn specie was normalized to specific soil conditions. BCFsi is the BCF of i-th conditions for specific corn species.BCFsis the mean of n BCFs.n
is the number of different conditions for specific corn species. The BCFs that Cd for different corn species was normalized by the prediction models to a set soil condition should be equal. Therefore, the decrease of intra-species variability indicates that normalization processing eliminated soil properties to a certain extent.
Results
Major factors affecting accumulation of Cd in corn grain in different soils
Simple relationships between log [corn grain Cd] at different Cd levels and soil pH, OM and CEC are shown in Figure 1. At the treatment of low concentration Cd, the Cd content in maize grain decreased with an increase of pH. Similar trends were found in the treatments of control and high concentration Cd. The significantly negative correlations were observed between Cd accumulation in corn grain and soil pH in the treatments with control Cd, low concentration Cd, and high concentration Cd (P,0.001). There was no significant correlation between the log [corn grain Cd] and Figure 5. Relativity between measured and predicted BCF
values for Cd in non-model wheat grains. The predicted BCF
values in Figure 5 were estimated by (A) model 1, (B) model 2, and (C) model 3 in Table 3. The solid line represents a 1:1 relationship; the dashed lines indicate a 2-fold prediction interval between the predicted and measured values.
doi:10.1371/journal.pone.0080855.g005
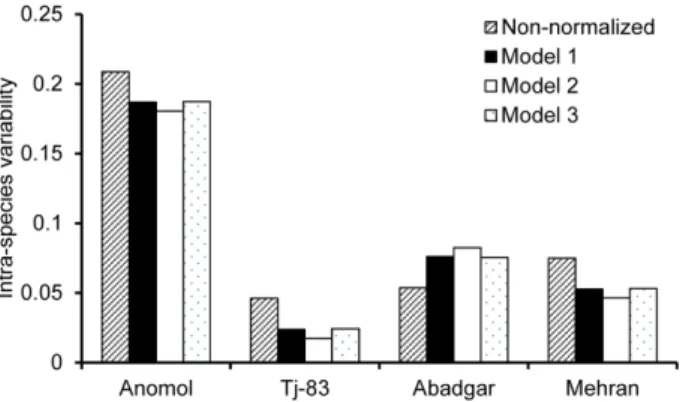
Figure 6. Intra-species variability of BCF for Cd.The data from all
non-model wheat species were normalized with the models listed in Table 3.
soil OM and CEC. These results indicate that soil pH is the main factor that controls the accumulation of Cd in corn grain.
Effects of different soil types on Cd transfer in soil-corn system
As shown in Figure 2, the BCF values from cultivar Zhengdan 958 with different treatments were significantly different in 17 soils with a wide range of soil properties in China. In general, the variation tendency of BCF values from cultivar Zhengdan 958 was alike over all soil samples from S1 to S17 at different treatments. These BCF values decreased with the increase of soil pH. The BCF values detected in S1 to S9 (pH from 4.90 to 6.93) were significantly higher than those in S10 to S17 (pH from 7.90 to 8.80). In the control soil, the maximum value for BCF (0.24) was achieved in S1 (pH 4.90), and the minimum value for BCF (0.09) in S10. The maximum value was 2.67 folds as high as the minimum value. At the treatment of low Cd, the maximum BCF (0.20) was observed in S1, and the minimum value for BCF (0.08) was found in S13. The maximum value was 2.50 folds as high as the minimum. At the treatment of high Cd, the highest BCF (0.22) values among the 17 soils were once again obtained in S1, and the minimum value for BCF (0.10) was in S17. The maximum was 2.22 folds as high as the minimum. These results indicate that Cd under acidic soil conditions is more highly bioavailable, leading to increased absorption by plants.
Prediction models
The prediction models established by stepwise regression are shown in Table 3. A significantly negative correlation existed between the Log[BCF] and soil pH in the Cd treatments including control, low Cd, and high Cd with the R2values ranging from 0.713–0.811 (P,0.001). All models displayed the same trend in which Log[BCF] of Cd in corn grain was negatively related to soil pH. There was no significant difference among three prediction models at the different Cd levels.
Cross-species extrapolation
The intercept (k) for different corn species deduced by three different models are shown in Table 4. The intercept (k) means the sensitivity of corn species to Cd accumulation. No significant differences were found to exist either among thek values of all tested non-model corn species deduced by the same model (model 1, 2, or 3) or among those in each of the tested non-model corn species deduced by different models (model 1, 2, and 3).
On the basis of thekvalues, the BCF values of non-model corn species were predicted by different models developed from cultivar Zhengdan958. The relationship between the predicted BCF values and the measured BCF values of non-model corn species was shown in Figure 3. The ratio between the predicted BCF values and the measured BCF values was within 2 folds interval and close to the solid line of 1:1 relationship, indicating that these models from cultivar Zhengdan 958 can be applied to predict the Cd BCF of non-model corn species.
Reduction of intra-species variability
Figure 4 shows the intra-species variability of Cd BCF of non-model species which were normalized with the non-models listed in Table 3. The prediction models can reduce the measured BCF species variability for all non-model corn species. The intra-species variability of Cd BCF fitted by model 2 was found much lower than that by model 1 and model 3 except for cultivar Nongda 84. Interestingly, the intra-species variability of Cd BCF for cultivar Nongda 84 normalized with model 1 was much lower
than that with model 2 and model 3. No significant differences existed in the intra-species variability of cultivars Chuandan 30, Liaodan 565 and Tunyu 88 which were normalized with model 1 and model 3. Since all models are effective in reducing the uncertainty caused by the soil property differences, they all can be used to establish the soil Cd SSD curves and provide an ecological benchmark in China.
Discussion
The bioavailable concentration of Cd in soil is more important than its total concentration in terms of its uptake and accumu-lation in plants [49]. In this study, we found that Cd uptake into corn grain increased with an increase of Cd concentration in soil. However, the BCF values tended to be similar when the concentration of Cd in soil was changed responding to the same soil. These findings were in agreement with previous studies [28– 30,50–51].
We also found that the soil pH was the major factor influencing the bioavailability of Cd in soil. This may be attributed to Cd uptake by plants from soils through diverse reactions such as absorption, ionic exchange, redox reactions, and precipitation-dissolution etc. [52]. These reactions are mainly affected by soil pH. The pH effects also include its influence on the solution activity of Cd and the distribution of Cd between the soil phase and the solution phase [53–54]. The increased sorption of Cd at high pH values could reduce the solution concentration, which tends to decrease the bioavailable concentration of Cd in soil. In this study, the BCF values observed in acidic soils (S1 to S9) were higher than those in alkaline soils (S10 to S17). These results suggest that Cd is much more bioavailable and leads to increased absorption by plants under acidic conditions [55–57]. No significant differences were observed among three prediction models at the different Cd levels. There were no significant differences among Cd BCF values of corn grain at different Cd levels, either. These results were consistent with the findings of Rezvani et al. [50].
More importantly, we confirmed that the Cd BCF prediction models from cultivar Zhengdan 958 could be used to predict Cd BCF of other non-model corn species according to the soil pH values through cross-species extrapolation approach. Although many prediction models were developed to describe the relationship between concentration of heavy metals in plants and soil properties in terrestrial ecosystems, these models were only suitable for single species [31–32,58–60]. Only a few studies were carried out to develop the prediction models for one species in aquatic ecosystems and subsequently used to normalize ecotoxicity data for other non-model species [33,38,39].
References
1. McLaughlin MJ, Singh BR (1999) Cadmium in soil and plants: a global perspective. Kluwer Academic Publishers, Dordrecht, 13–21.
2. Li ZJ, Xu JM, Tang CX, Wu JJ, Muhammad A, et al. (2006) Application of 16S rDNA-PCR amplification and DGGE fingerprinting for detection of shift in
microbial community diversity in Cu-, Zn-, and Cd-contaminated paddy soils.
Chemosphere 26: 1374–1380.
3. Zhang CB, Huang LN, Luan TG, Jin J, Lan CY (2006) Structure and function of microbial community during the early stages of revegetation near Shaoguan Pb/Zn Smelter, Guangdong, P.R. China. Geoderma 136: 555–565. 4. Chien CC, Kuo YM, Chen CC, Hung CW, Yeh CH, et al. (2008) Microbial
diversity of soil bacteria in agricultural field contaminated with heavy metals. Journal of environmental sciences 20: 359–363.
5. Tudoreanu L, Phillips CJC (2004) Empirical models of cadmium accumulation in maize, rye grass and soya bean plants. J Sci Food Agric 84: 845–852. 6. Mushtakova VM, Fomina VA, Rogovin VV (2005) Toxic effect of heavy metals
on human blood neutrophils. Biol Bull 32: 276–278.
7. Huang ML, Zhou SL, Sun B, Zhao QG (2008) Heavy metals in wheat grain: Assessment of potential health risk for inhabitants in Kunshan, China. Science of the Total Environment 405: 54–61.
8. Hu JL, Wu FY, Wu SC, Sun XL, Lin XG, et al. (2013) Phytoavailability and phytovariety codetermine the bioaccumulation risk of heavy metal from soils, focusing on Cd-contaminated vegetable farms around the Pearl River Delta, China. Ecotoxicology and Environmental Safety 91: 18–24.
9. Harter RD, Naidu R (2001) Anassessment of environmental and solution parameter impact on trace-metal sorption by soil. Soil Sci Soc Am J 65: 597– 612.
10. Jung MC (2008) Heavy metal concentration in soils and factors affecting metal uptake by plants in the vicinity of a Korean Cu-W mine. Sensors 8: 2413–2423. 11. Wang J, Zhang CB, Jin ZX (2009) The distribution and phytoavailability of heavy metal fractions in rhizosphere soils of paulowniu fortune (seem) Hems near a Pb/Zn smelter in Guangdong, PR China. Geodema 148: 299–306. 12. Chapman EEV, Dave G, Murimboh JD (2013) A review of metal (Pb and Zn)
sensitive and pH tolerant bioassay organisms for risk screening of metal-contaminated acidic soils. Environmental Pollution 179: 326–342.
13. Barancˇı´kova´ G, Madaras M, Ryba´r O (2004) Crop contamination by selected trace elements. Journal of Soils and Sediments 4: 37–42.
14. Mu¨hlbachova´ G, Simon T, Pechova´ M (2005) The availability of Cd, Pb and Zn and their relationships with soil pH and microbial biomass in soils amended by natural clinoptilolite. Plant, Soil and Environment 51: 26–33.
15. Zhao KL, Liu XM, Xu JM, Selim HM (2010) Heavy metal contaminations in a soil-rice system: identification of spatial dependence in relation to soil properties of paddy fields. Journal of Hazardous Materials 181: 778–787.
16. Sukreeyapongse O, Holm PE, Strobel BW, Magid SJ, Panichsakpatana S, et al. (2002) pH-dependent release of cadmium, copper, and lead from natural and sludge-amended soils. Journal of Environmental Quality 31: 1901–1909. 17. Bang J, Hesterberg D (2004) Dissolution of trace element contaminants from two
coastal plain soils as affected by pH. Journal of Environmental Quality 33: 891– 901.
18. Badawy SH, Helal MID, Chaudri AM, Lawlor K, McGrath SP (2002) Soil solidphase controls lead activity in soil solution. Journal of Environmental Quality 31: 162–167.
19. Wang AS, Angle JS, Chaney RL, Delorme TA, Reeves RD (2006) Soil pH effects on uptake of Cd and Zn by Thlaspi caerulescens. Plant and Soil 281: 325–337.
20. Du Laing G, Rinklebe J, Vandecasteele B, Meers E, Tack FMG (2009) Heavy metal mobility and availability in estuarine and riverine floodplain soils and sediments: a review. Science of the Total Environment 407: 3972–3985. 21. Kirkham MB (2006) Cadmiumin plantson polluted soils: Effect of soil factors,
hyperaccumulation and amendments. Geoderma 137: 19–32.
22. Kim KR, Owens G, Naidu R (2009) Heavy metal distribution, bioaccessibility and phytoavailability in long-term contaminated soils from Lake Macquarie, Australia. Aust J Soil Res 47: 166–176.
23. Zeng F, Ali S, Zhang H, Quyang Y, Qiu B, et al. (2001) The influence of pH and organic matter content in paddy soil on heavy metal availability and their uptake by rice plants. Environmental pollution 159: 84–91.
24. Hettiarachchi GM, Ryan JA, Chaney RL, La Fleur CM (2003) Sorption and desorption of cadmium by different fractions of biosolids-amended soils. Journal of Environmental Quality 32: 1684–1693.
25. Antoniadis V, Robinson JS, Alloway BJ (2008) Effects of short-term pH fluctuations on cadmium, nickel, lead, and zinc availability to ryegrass in a sewage sludge-amended field. Chemosphere 71: 759–764.
26. Eriksson JE (1988) The effects of clay, organic matter and time on adsorption and plant uptake of cadmium added to the soil. Water Air Soil Pollut 40: 359– 373.
27. Pinto AP, Mota AM, De Varennes A, Pinto FC (2004) Influence of organic matter on the uptake of cadmium, zinc, copper and iron by sorghum plants. Science of the total environment.326: 239–247.
28. Brown SL, Chaney RL, Angle JS, Ryan JA (1998) The phytoavailability of cadmium to lettuce in long-term biosolids-amended soils. J Environ Qual 27: 1071–1078.
29. Kim SJ, Chang AC, Page AL, Warneke JE (1988) Relative concentrations of cadmium and zinc in tissue of selected food plants grown on sludge-treated soils. Journal of Environmental Quality 17: 568–573.
30. Ge Y, Murray P, Hendershot WH (2000) Trace metal speciation and bioavailability in urban soils. Environ Pollut 107: 137–144.
31. Li Q, Xu XH, Zuo YB (2009) Effects of biosolid on the accumulation and transfer of trace elements in soil-wheat/maize system. Journal of agro-environment science 28: 2042–2049.
32. Wang XQ (2012) Ecological Thresholds for Copper and Nickel in Chinese Agricultural Soils, Beijing, China Mining University.
33. Schlekat CE, Genderen EV, UGent KDS, Antunes PMC, Rogevich EC, et al. (2010) Cross-species extrapolation of chronic nickel Biotic Ligand Models. Science of the Total Environment 408: 6148–6157.
34. Solomon KR, Baker DB, Richards RP, Dixon KR, Klaine SJ, et al. (1996) Ecological risk assessment of Atrazine in North American surface waters. Environmental Toxicology and Chemistry 15: 31–76.
35. Steen RJCA, Leonards PEG, Brinkman UAT, Barcelo D, Tronczynski J, et al. (1999) Ecological risk assessment of agrochemicals in European estuaries. Environmental Toxicology and Chemistry 18: 1574–1581.
36. Van Sprang PA, Verdonck FAM, Van Assche F, Regoli L, De Schamphelaere KAC (2009) Environmental risk assessment of zinc in European freshwaters: a critical appraisal. Sci Tot Environ 407: 5373–5391.
37. Allard P, Fairbrother A, Hope BK, Hull RN, Johnson MS, et al. (2010) Recommendations for the development and application of wildlife toxicity reference values. Intergrated environmental assessment and management 6: 28– 37.
38. Deleebeeck NME, De Schamphelaere KAC, Janssen CR (2007a) A
bioavail-ability model predicting the toxicity of nickel to rainbow trout (Oncorhynchus
mykiss) and fathead minnow (Pimephales promelas) in synthetic and natural waters. Ecotoxicol Environ Saf 67: 1–13.
39. Deleebeeck NME, Muyssen BTA, De Laender F, Janssen CR, De Schamphe-laere KAC (2007b) Comparison of nickel toxicity to cladocerans in soft versus hard surface waters. Aquat Toxicol 84: 223–35.
40. Sparks DL, Page AL, Helmke PA, Loeppert RH, Soltanpour PN, et al. (1996) Methods of Soil Anlysis. Part 3. Chemical Methods. Soil Science Society of America, Inc, Madison. WI.
41. Dohrmann R (2006) Cation exchange capacity methodology II: A modified silver–thiourea method. Applied clay science 34: 38–46.
42. Ball DF (1964) Loss-on-ignition as an estimate of organic matter and organic carbon in noncalcareous soils. Journal of Soil Science 15: 84–92.
43. Bray RH, Kurtz LT (1945) Determination of total, organic, and available forms of phosphorus in soils. Soil science 59: 39–46.
45. Zarcinas BA, McLaughlin MJ, Smart MK (1996) The effect of acid digestion technique on the performance of nebulisation systems used in inductively coupled plasma spectrometry. Commun Soil Sci Plant Anal 27: 1331–1354. 46. Baker AJM, Reeves RD, Hajar ASM (1994) Heavy metal accumulation and
tolerance in British populations of metallophyte Thlaspi caerulescens. New Phytol 127: 61–68.
47. Raskin I, Kumar PBAN, Dushenkov S, Salt DE (1994) Bioconcentration of heavy metals by plants. Curr Opin Biotechnol 5: 285–290.
48. De Schamphelaere KAC, Heijerick D, Janssen C (2006) Cross-phylum comparison of a chronic biotic ligand model to predict chronic toxicity of copper to a freshwater rotifer, Brachionus calyciflorus (Pallas). Ecotoxicol Environ Saf 63: 189–195.
49. Sarwar N, Saifullah, Malhi SS, Zia MH, Naeem A, et al. (2010) Role of mineral nutrition in minimizing cadmium accumulation by plants. J Sci Food Agric 90: 925–937.
50. Rezvani M, Zaefarian F (2011). Bioaccumulation and translocation factors of cadmium and lead in Aeluropus littoralis. Australian Journal Agricutural Engineering 2: 114–119.
51. Mertens J, Luyssaert S, Verheyen K (2005) Use and abuse of trace metal concentrations in plants tissue for biomonitoring and phytoextraction. Environ Pollut 138: 1–4.
52. Smical AI, Hotea V, Oros V, Juhasz J, Pop I (2008) Studies on transfer and bioaccumulation of heavy metals from soil into lettuce. Environmental Engineering and Management Journal 7: 609–615.
53. Christensen TH (1984) Cadmium soil sorption at low concentrations: I. Effect of time, cadmium load, pH, and calcium. Water. Air. Soil Pollut 21: 105–114.
54. Naidu R, Bolan NS, Kookana RS, Tiller KG (1994) Ionic-strength and pH effects on the sorption of cadmium and the surface charge of soils. Euroean Journal of Soil Science 45: 419–429.
55. Hinesly TD, Redborg KE, Pietz RI, Ziegler EL (1984) Cadmium and zinc uptake by corn (Zea mays L.) with repeated applications of sewage sludge. J Agric Food Chem 32: 155–163.
56. Castilho PD, Chardon WJ (1995) Uptake of soil cadmium by three field crops and its prediction by a pH-dependent Freundlich sorption model. Plant Soil 171: 263–266.
57. Adams ML, Zhao FJ, McGrath SP, Nicholsonb FA, Chambersb BJ (2004) Predicting Cadmium Concentrations in Wheat and Barley Grain Using Soil Properties. Journal of Environmental Quality 33: 532–541.
58. Hao XZ, Zhou DM, Li DD (2012) Growth, cadmium and zinc accumulation of
ornamental sunflower (Helianthus annuusL.) in contaminated soil with different
amendments. Pedosphere 22: 631–639.
59. McBride MB (2002) Cadmium uptake by crops estimated from soil total Cd and pH. Soil Sci. 167: 62–67.
60. Wang XP, Shan XQ, Zhang SZ, Wen B (2004) A model for evaluation of the phytoavailability of trace elements to vegetables under the field conditions. Chemosphere. 55: 811–822.
61. Jamali MK, Kazi TG, Arain MB, Afridi HI, Jalbani N, et al. (2009) Heavy metal
accumulation in different varieties of wheat (Triticum aestivumL.) grown in soil
![Table 5. Soil properties and BCF values for Cd in non-model wheat grain [61].](https://thumb-eu.123doks.com/thumbv2/123dok_br/18383964.356736/5.918.91.591.91.297/table-soil-properties-bcf-values-model-wheat-grain.webp)