NHESSD
1, 2109–2126, 2013Earthquake analysis considering
magnitude conver-sion uncertainty
J. P. Wang and Y. Xu
Title Page
Abstract Introduction
Conclusions References
Tables Figures
◭ ◮
◭ ◮
Back Close
Full Screen / Esc
Printer-friendly Version Interactive Discussion
Discussion
P
a
per
|
Dis
cussion
P
a
per
|
Discussion
P
a
per
|
Discussio
n
P
a
per
|
Nat. Hazards Earth Syst. Sci. Discuss., 1, 2109–2126, 2013 www.nat-hazards-earth-syst-sci-discuss.net/1/2109/2013/ doi:10.5194/nhessd-1-2109-2013
© Author(s) 2013. CC Attribution 3.0 License.
Geoscientiic Geoscientiic
Geoscientiic Geoscientiic
Natural Hazards and Earth System Sciences
Open Access
Discussions
This discussion paper is/has been under review for the journal Natural Hazards and Earth System Sciences (NHESS). Please refer to the corresponding final paper in NHESS if available.
A seismic hazard analysis considering
uncertainty during earthquake magnitude
conversion
J. P. Wang and Y. Xu
Dept. Civil and Environmental Engineering, the Hong Kong University of Science and Technology, Hong Kong
Received: 9 April 2013 – Accepted: 6 May 2013 – Published: 17 May 2013
Correspondence to: J. P. Wang ([email protected])
Published by Copernicus Publications on behalf of the European Geosciences Union.
NHESSD
1, 2109–2126, 2013Earthquake analysis considering
magnitude conver-sion uncertainty
J. P. Wang and Y. Xu
Title Page
Abstract Introduction
Conclusions References
Tables Figures
◭ ◮
◭ ◮
Back Close
Full Screen / Esc
Printer-friendly Version Interactive Discussion
Discussion
P
a
per
|
Dis
cussion
P
a
per
|
Discussion
P
a
per
|
Discussio
n
P
a
per
|
Abstract
The magnitude of earthquakes can be described with different units, such as moment
magnitude Mw and local magnitude ML. A few empirical relationships between the
two have been suggested, such as the model calibrated with the earthquake data in Taiwan. Understandably, such a conversion relationship through regression analysis
5
is associated with some error because of inevitable data scattering. Therefore, the underlying scope of this study is to conduct a seismic hazard analysis, during which the uncertainty from earthquake magnitude conversion was properly taken into account. With a new analytical framework developed for this task, it was found that there is a 10 % probability in 50 yr that PGA could exceed 0.28 g at the study site in North
10
Taiwan.
1 Introduction
The magnitude of earthquakes can be portrayed with a variety of units, such as lo-cal magnitudeMLand moment magnitudeMw. For example, the 1999 Chi-Chi
earth-quake in Taiwan was reportedly with a local magnitude and moment magnitude equal
15
toML=7.3 andMw=7.6, respectively. Generally speaking, moment magnitude is
usu-ally adopted in a ground motion model (e.g., Cheng et al., 2007; Lin et al., 2011); on the other hand, an earthquake catalog lists the event in local magnitude (e.g., Wang et al., 2011, 2012a).
The correlation between the two units was reported in some studies. For example,
20
based on adequate earthquake samples in Taiwan, Wu et al. (2001) suggested the following empirical relationship:
NHESSD
1, 2109–2126, 2013Earthquake analysis considering
magnitude conver-sion uncertainty
J. P. Wang and Y. Xu
Title Page
Abstract Introduction
Conclusions References
Tables Figures
◭ ◮
◭ ◮
Back Close
Full Screen / Esc
Printer-friendly Version Interactive Discussion
Discussion
P
a
per
|
Dis
cussion
P
a
per
|
Discussion
P
a
per
|
Discussio
n
P
a
per
|
whereεdenotes the model’s error. Based on the fundamentals of regression analysis (Ang and Tang, 2007), its mean value is zero, and its standard deviation was equal to 0.14 owing to the scattered data in this pool of samples.
With the earthquake catalog, ground motion models, andML-to-Mwequation, a few earthquake studies for Taiwan were conducted (Wang et al., 2011, 2012a,b). However,
5
when magnitude conversion was needed during those analyses, the model uncertainty was not taken into account. For example, given ML=6.5, the moment magnitude is
equal toMw=6.66 with Eq. (1). But note that such a conversion was made regardless
of the model’s errorε.
Therefore, an underlying scope of this study is to perform a seismic hazard
analy-10
sis accounting for the uncertainty during magnitude conversion, as well as those be-cause of uncertain earthquake size, location, and motion attenuation. The new analyt-ical framework is to utilize a common probabilistic analysis, i.e., First-Order-Second-Moment (FOSM). The new application was then used for the seismic hazard assess-ment at a site in North Taiwan.
15
2 Probabilistic analysis and deterministic analysis
Given a function of random variables asA=B+C, deterministic analysis can find the
mean value of A with those of B and C, but the standard deviation of A cannot be determined. In contrast, probabilistic analysis can estimate both, with the mean values and standard deviations ofBandCavailable. As a result, the interpretations made with
20
deterministic analysis are irrelevant to the input’s variability, which becomes its short-coming compared to probabilistic analysis. For example, the soil’s friction angles in two slopes are found equal to 20, 30, 40◦ and 29, 30, 31◦ with three samples from each slope. In this case, the deterministic analysis will estimate the same safety margins for the two slopes because of the same mean value of the soil property, despite the
25
obvious difference in the variability.
NHESSD
1, 2109–2126, 2013Earthquake analysis considering
magnitude conver-sion uncertainty
J. P. Wang and Y. Xu
Title Page
Abstract Introduction
Conclusions References
Tables Figures
◭ ◮
◭ ◮
Back Close
Full Screen / Esc
Printer-friendly Version Interactive Discussion
Discussion
P
a
per
|
Dis
cussion
P
a
per
|
Discussion
P
a
per
|
Discussio
n
P
a
per
|
But it must be noted that when the function of variables is complex, the probabilistic analysis becomes hard to solve, or even the analytical solution might not be available. Therefore, a few alternatives, such as FOSM, the Rosenblueth approach, Monte Carlo Simulation, were developed and commonly employed to solve problems on a prob-abilistic basis, such as seismic hazard analysis and slope stability evaluation (e.g.,
5
Wang et al., 2012c, 2013a,b).
3 Overview of FOSM
FOSM is on the basis of the Taylor expansion (Hahn and Shapiro, 1967). Given a func-tion Y =g(X1,X2,. . .,Xn), the mean value and variance of Y, denoted as E(Y) and
Var(Y), can be approximated with only the first-order terms being retained:
10
E(Y)≈g(E(X1),E(X1),. . .,E(Xn)) (2)
and
Var(Y)≈ n
X
i=1
"
∂Y ∂Xi
2
Var(Xi)
#
+2
n
X
i=1
n
X
j=1
∂Y ∂Xi
∂Y
∂XjCov(Xi,Xj) !
fori < j (3)
where Cov denotes the covariance. When any of two input variables is independent of each other (i.e., Cov=0), the variance ofY can be calculated as follows:
15
Var(Y)≈ n
X
i=1
"
∂Y ∂Xi
2
Var(Xi)
#
(4)
4 FOSM-based seismic hazard analysis
NHESSD
1, 2109–2126, 2013Earthquake analysis considering
magnitude conver-sion uncertainty
J. P. Wang and Y. Xu
Title Page
Abstract Introduction
Conclusions References
Tables Figures
◭ ◮
◭ ◮
Back Close
Full Screen / Esc
Printer-friendly Version Interactive Discussion
Discussion
P
a
per
|
Dis
cussion
P
a
per
|
Discussion
P
a
per
|
Discussio
n
P
a
per
|
to assess the casualty or economic loss caused by earthquakes as the word “haz-ard” in the title could imply. Instead, the analysis is to best estimate, for example, the annual rate of a given ground motion level (e.g., PGA>0.2 g), with the earthquake evidence around the site. Seismic hazard can be presented differently depending on
which method is used, such as Probabilistic Seismic Hazard Analysis (PSHA) or
De-5
terministic Seismic Hazard Analysis (DSHA).
Ground motion models are one of the underlying pieces of information needed in a seismic hazard analysis. Similarly, the new analysis was developed with an attenua-tion relaattenua-tionship. Take a rock-site model for Taiwan for instance, PGA (in unit g) can be estimated as follows (Cheng et al., 2007):
10
ln PGA=−3.25+1.075Mw−1.723 ln (D+0.156 exp(0.624Mw))+εM (5)
whereD denotes source-to-site distance (km); εM is the model’s error, whose
stan-dard deviation is equal to 0.577 (mean=0). Combining Eqs. (1) and (5), the governing
equation of this study becomes:
ln PGA=−3.25+1.075 exp
M
L+2.09+ε
4.53
−1.723 ln
D+0.156 exp
0.624 exp
M
L+2.09+ε
4.53
+εM
(6)
15
As a result, this study aims to solve this function with the involvement of four random variables (i.e., ML, D, ε, εM), two of them related to the uncertainty of major
earth-quakes (detailed in the next section), and the other two related to the errors of two em-pirical models. After the mean and standard deviation of lnPGA in Eq. (6) are solved, the exceedance probability against a given valuey∗can be computed with
fundamen-20
tals of probability (Ang and Tang, 2007), as follows:
Pr(PGA> y∗
)=Pr(ln PGA>lny∗
)=1−Pr(ln PGA≤lny∗
)=1−Φ
lny∗−µ
ln PGA
σln PGA
NHESSD
1, 2109–2126, 2013Earthquake analysis considering
magnitude conver-sion uncertainty
J. P. Wang and Y. Xu
Title Page
Abstract Introduction
Conclusions References
Tables Figures
◭ ◮
◭ ◮
Back Close
Full Screen / Esc
Printer-friendly Version Interactive Discussion
Discussion
P
a
per
|
Dis
cussion
P
a
per
|
Discussion
P
a
per
|
Discussio
n
P
a
per
|
whereΦdenotes the standard normal (mean=0 and standard deviation =1)
cumu-lative probability function;µln PGA and σln PGA are the mean and standard deviation of
lnPGA. Explicitly, this calculation involves an analytical presumption that earthquake ground motion (e.g., PGA) follows a lognormal distribution (Kramer, 1996).
5 Seismic hazard assessment for a site in North Taiwan
5
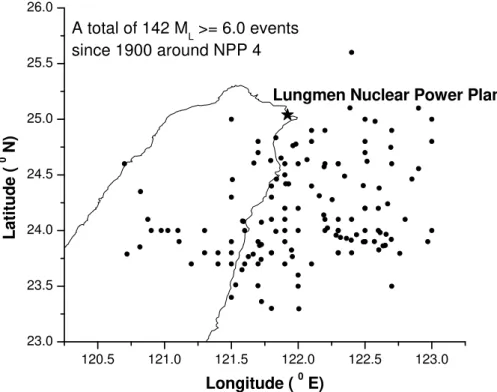
The seismic hazard at the Lungmen nuclear power plant, under construction, was then evaluated with the new analysis. Extracting from the earthquake catalog containing more than 55 000 events since 1900 (Fig. 1), there are a total of 142 major events with
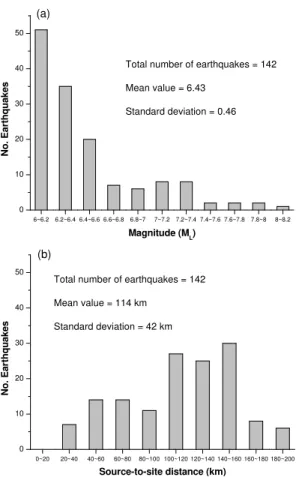
MLgreater than 6.0 occurring within 200 km from the site. Figure 2 shows the epicen-ters of the major earthquakes. Accordingly, Fig. 3a shows the histogram of earthquake
10
size, with the mean and standard deviation equal toML=6.43 and 0.46, respectively.
Likewise, Fig. 3b shows the histogram of source-to-site distance, with the mean and standard deviation equal to 114 and 42 km, respectively.
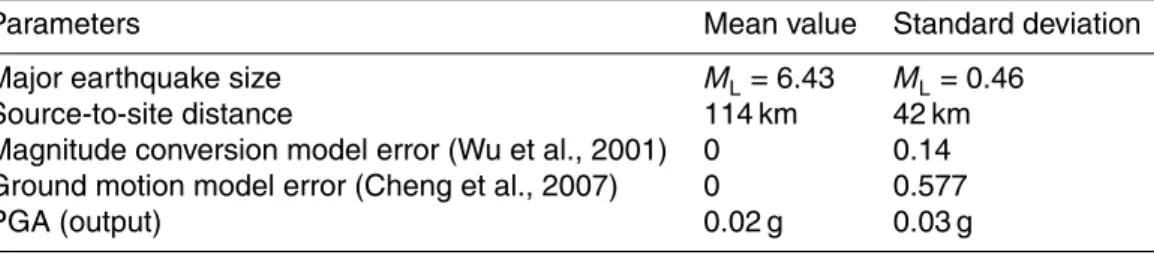
With the statistics of the four random variables, summarized in Table 1, the mean and standard deviation of lnPGA associated with their uncertainties were−4.5 and 1.09, 15
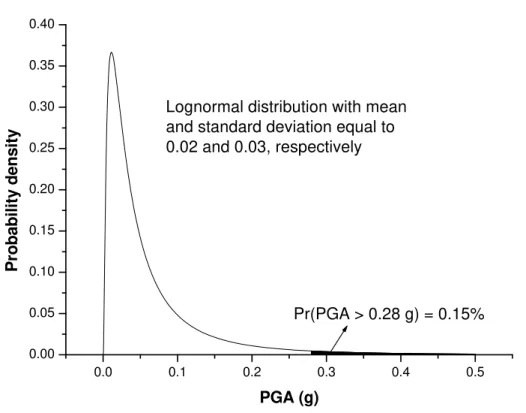
respectively. They are equivalent to 0.02 g (mean) and 0.03 g (standard deviation) after conversion (Ang and Tang, 2007). With the two, Fig. 4 shows the probability density function of PGA at the site. Accordingly, there is a 0.15 % probability that PGA could exceed 0.28 g at the site when a major earthquake occurs within 200 km around the site.
20
Following the framework of PSHA, the annual rate of motion of exceedance (e.g., PGA>0.28 g) can be calculated with the exceedance probability (Eq. 7) multiplying the earthquake rate (v), as follows:
λPGA>y∗=v×
1−Φ
lny∗−µ
ln PGA
σln PGA
NHESSD
1, 2109–2126, 2013Earthquake analysis considering
magnitude conver-sion uncertainty
J. P. Wang and Y. Xu
Title Page
Abstract Introduction
Conclusions References
Tables Figures
◭ ◮
◭ ◮
Back Close
Full Screen / Esc
Printer-friendly Version Interactive Discussion
Discussion
P
a
per
|
Dis
cussion
P
a
per
|
Discussion
P
a
per
|
Discussio
n
P
a
per
|
Since the rate of major earthquakes around the site is around 1.3 per year, the rate of PGA>0.28 g, for example, is equal to 0.002 per year. Also following another analytical presumption adopted in PSHA, we used the Poisson model to calculate the recurrence probability within a given period of time (Kramer, 1996).
As a result, Fig. 5 shows both the annual rate of motions of exceedance, and their
5
recurrence probability in 50 yr. Accordingly, there is a 10 % probability that PGA at the site could exceed 0.28 g in 50 yr because of major earthquakes, given the uncertainties of their size and location, in addition to the errors in the empirical models for conducting magnitude conversion and calculating ground motion.
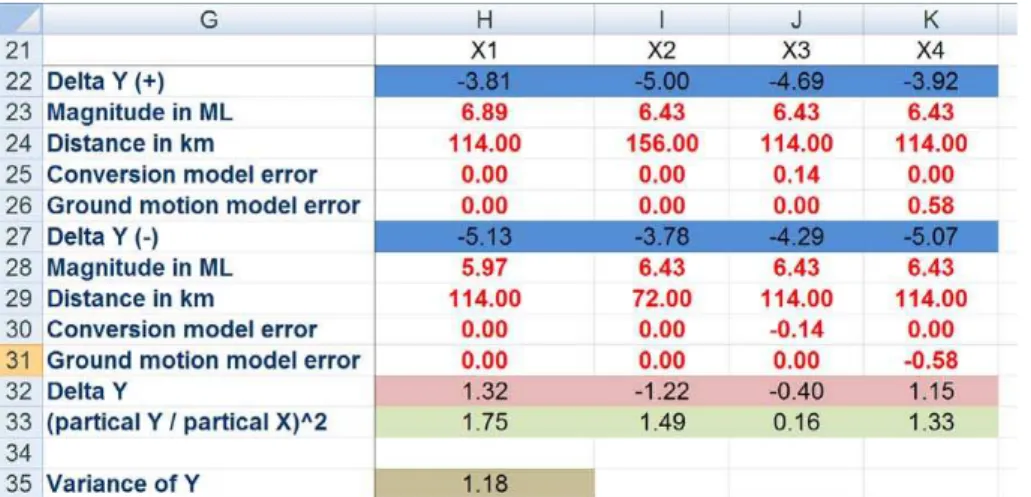
6 Spreadsheet calculation
10
Like a few geoscience studies (Mayborn and Lesher, 2011; Wang and Huang, 2012; Wang et al., 2013a), we utilized an Excel spreadsheet, as shown in Fig. 6, for the com-putation in this study. Some detail about the spreadsheet is given in the figure’s caption. Note that the calculation of ∂X∂Y
i in Eq. (4) was assisted with the finite di
fference
approx-imation of the derivative (US Army Corps of Engineers, 1997). TakeX1 for example, 15
∂Y
∂X1 can be approximated as follows:
∂Y ∂X1 =
g(µ1+σ1, µ2,. . .,µn)−g(µ1−σ1,µ2,. . .,µn)
2σ1 (9)
whereµ1andσ1denote the mean and standard deviation ofX1, respectively.
7 Discussions
7.1 Seismic hazards at the study site
20
Cheng et al. (2007) presented a PSHA hazard map for Taiwan in 10 % exceedance probability within 50 yr. Looking up the map, we found that the PGA estimate at the
NHESSD
1, 2109–2126, 2013Earthquake analysis considering
magnitude conver-sion uncertainty
J. P. Wang and Y. Xu
Title Page
Abstract Introduction
Conclusions References
Tables Figures
◭ ◮
◭ ◮
Back Close
Full Screen / Esc
Printer-friendly Version Interactive Discussion
Discussion
P
a
per
|
Dis
cussion
P
a
per
|
Discussion
P
a
per
|
Discussio
n
P
a
per
|
site is around 0.3∼0.32 g, comparable to this study’s estimate in 0.28 g at the same exceedance probability given the same period of time.
Although the seismic hazards at the site were found comparable in the two studies, it must be noted that the two analyses are of fundamental difference. One study (our
study) utilized a common probabilistic analysis in which four sources of uncertainties
5
were accounted for, including the one during earthquake magnitude conversion. In contrast, the other was a case study with an existing method, accounting for three sources of earthquake uncertainties that were also taken into account in our analysis.
7.2 The controversy of seismic hazard analysis
Although seismic hazard analysis is considered a viable solution to seismic hazard
mit-10
igation, given the fact that earthquakes can be hardly predicted (Geller et al., 1997), some discussion over its methodological robustness has been reported (e.g., Castanos and Lomnitz, 2002; Bommer, 2003; Krinitzsky, 2003; Mualchin, 2011). One of the pos-sibilities causing this controversy, yet resolved, is that seismic hazard estimates could not be verified with the ground motion data measured in the field (Musson, 2012a,b;
15
Wang, 2012).
Therefore, it is a logical perspective that not a seismic hazard analysis should be perfect without challenge, given our limited understandings of the random earthquake process (Mualchin, 2005). Under the circumstance, some suggest that the key to a ro-bust seismic hazard study is the transparent and repeatable analysis (Klugel, 2008;
20
Wang et al., 2012a). On the other hand, decision makers need to fundamentally un-derstand the difference from one analysis to another, before making the decision about
which approach is suitable for their application (Mualchin, 2005). During the analysis, they need to ask hard questions about any number used in the calculation, making a seismic hazard estimate as transparent as possible (Krinitzsky, 2003).
NHESSD
1, 2109–2126, 2013Earthquake analysis considering
magnitude conver-sion uncertainty
J. P. Wang and Y. Xu
Title Page
Abstract Introduction
Conclusions References
Tables Figures
◭ ◮
◭ ◮
Back Close
Full Screen / Esc
Printer-friendly Version Interactive Discussion
Discussion
P
a
per
|
Dis
cussion
P
a
per
|
Discussion
P
a
per
|
Discussio
n
P
a
per
|
7.3 Logic-tree analysis
Logic-tree analysis has become a common procedure to account for the so-called epis-temic uncertainty during a seismic hazard assessment. Basically, it can be considered a weighted-average method. For example, when three ground motion models are all considered suitable, the calculation will repeated with each model. Then the final
es-5
timate is equal to the summation of each subordinate estimate multiplying its weight. Obviously, we did not perform such analysis in this study (although it can be easily accomplished), because this paper aims to focus on the uncertainty of earthquake magnitude conversion in a seismic hazard analysis.
7.4 Are earthquake variables independent of each other?
10
Like most seismic hazard analyses (Cheng et al., 2007; Wang et al., 2012a), the earth-quake variables considered in this analysis are assumed to be independent of each other, e.g., earthquake size and location. More studies should be worth conducting to offer some more concrete evidence about possible correlations between earthquake
variables.
15
8 Conclusions
This study conducted a seismic hazard assessment for a site in North Taiwan, where a nuclear power plant is located. Unlike others, this study integrated the uncertainty during earthquake magnitude conversion into the assessment utilizing a common prob-abilistic analysis. The result shows that the mean and standard deviation of PGA at
20
the site could be 0.02 g and 0.03 g, given a major earthquake with uncertain size and location occurring around the site, and the errors of the empirical models used for earthquake magnitude conversion and ground motion calculation. As a result, there is a 10 % probability that PGA at the site could exceed 0.28 g within 50 yr.
NHESSD
1, 2109–2126, 2013Earthquake analysis considering
magnitude conver-sion uncertainty
J. P. Wang and Y. Xu
Title Page
Abstract Introduction
Conclusions References
Tables Figures
◭ ◮
◭ ◮
Back Close
Full Screen / Esc
Printer-friendly Version Interactive Discussion
Discussion
P
a
per
|
Dis
cussion
P
a
per
|
Discussion
P
a
per
|
Discussio
n
P
a
per
|
References
Ang, A. H. S. and Tang, W. H.: Probability Concepts in Engineering: Emphasis on Applications to Civil and Environmental Engineering, 2nd ed., John Wiley & Sons, Inc., N. J., 2007. Bommer, J. J.: Uncertainty about the uncertainty in seismic hazard analysis, Eng. Geol., 70,
165–168, 2003.
5
Castanos, H. and Lomnitz, C.: PSHA: is it science? Eng. Geol., 66, 315–317, 2002.
Cheng, C. T., Chiou, S. J., Lee, C. T., and Tsai, Y. B.: Study on probabilistic seismic hazard maps of Taiwan after Chi-Chi earthquake, J. GeoEng., 2, 19–28, 2007.
Geller, R. J., Jackson, D. D., Kagan, Y. Y., and Mulargia, F.: Earthquake cannot be predicted, Science, 275, 1616, doi:10.1126/science.275.5306.1616, 1997.
10
Hahn, G. J. and Shapiro, S. S.: Statistical Models in Engineering, Wiley, N. Y., 1967. Klugel, J. U.: Seismic hazard analysis – Quo vadis? Earth-Sci. Rev., 88, 1–32, 2008. Kramer, S. L.: Geotechnical Earthquake Engineering, Prentice Hall Inc., N. J., 1996.
Krinitzsky, E. L.: How to combine deterministic and probabilistic methods for assessing earth-quake hazards, Eng. Geol., 70, 157–163, 2003.
15
Lin, P. S., Lee, C. T., Cheng, C. T., and Sung, C. H.: Response spectral attenuation relations for shallow crustal earthquakes in Taiwan, Eng. Geol., 121, 150–164, 2011.
Mayborn, K. R., Lesher, C. E.: MagPath: an excel-based visual basic program for forward mod-eling of mafic magma crystallization, Comput. Geosci., 37, 1900–1903, 2011
Mualchin, L.: Seismic hazard analysis for critical infrastructures in California, Eng. Geol., 79,
20
177–184, 2005.
Mualchin, L.: History of modern earthquake hazard mapping and assessment in California using a deterministic or scenario approach, Pure Appl. Geophys., 168, 383–407, 2011. Musson, R. M. W.: PSHA validated by quasi observational means, Seismol. Res. Lett., 83,
130–134, 2012a.
25
Musson, R. M. W.: Probability in PSHA: Reply to “Comment on “PSHA validated by quasi observational means” by Z. Wang”, Seismol. Res. Lett., 83, 717–719, 2012b.
US Army Corps of Engineers: Engineering and Design: Introduction to Probability and Re-liability Methods for Use in Geotechnical Engineering, Technical Letter, No. 1110–2-547, Department of the Army, Washington, DC, 1997.
NHESSD
1, 2109–2126, 2013Earthquake analysis considering
magnitude conver-sion uncertainty
J. P. Wang and Y. Xu
Title Page
Abstract Introduction
Conclusions References
Tables Figures
◭ ◮
◭ ◮
Back Close
Full Screen / Esc
Printer-friendly Version Interactive Discussion
Discussion
P
a
per
|
Dis
cussion
P
a
per
|
Discussion
P
a
per
|
Discussio
n
P
a
per
|
Wang, J. P. and Huang, D.: Rosenpoint: a Microsoft Excel-based program for the Rosenblueth point estimate method and an application in slope stability analysis, Comput. Geosci.-UK, 48, 239–243, 2012.
Wang, J. P., Chan, C. H., and Wu, Y. M.: The distribution of annual maximum earthquake magnitude around Taiwan and its application in the estimation of catastrophic earthquake
5
recurrence probability, Nat. Hazards, 59, 553–570, 2011.
Wang, J. P., Brant, L., Wu, Y. M., and Taheri, H.: Probability-based PGA estimations using the double-lognormal distribution: including site-specific seismic hazard analysis for four sites in Taiwan, Soil Dyn. Earthq. Eng., 42, 177–183, 2012a.
Wang, J. P., Chang, S. C., Wu, Y. M., and Xu, Y.: PGA distributions and seismic hazard
evalua-10
tions in three cities in Taiwan, Nat. Hazards, 64, 1373–1390, 2012b.
Wang, J. P., Lin, C. W., Taheri, H., and Chen, W. S.: Impact of fault parameter uncertainties on earthquake recurrence probability by Monte Carlo simulation – an example in central Taiwan, Eng. Geol., 126, 67–74, 2012c.
Wang, J. P., Huang, D., Cheng, C. T., Shao, K. S., Wu, Y. C., and Chang, C. W.: Seismic hazard
15
analysis for Taipei City including deaggregation, design spectra, and time history with Excel applications, Comput. Geosci., 52, 146–154, 2013a.
Wang, J. P., Huang, D., and Chang, S. C.: Assessment of seismic hazard associated with the Meishan fault in Central Taiwan, B. Eng. Geol. Environ., doi:10.1007/s10064-0.13-0471-x, in press, 2013b.
20
Wang, Z.: Comment on “PSHA validated by quasi observational means” by R. M. W. Musson, Seismol. Res. Lett., 83, 714–716, 2012.
Wu, Y. M., Shin, T. C., and Chang, C. H.: Near real-time mapping of peak ground acceleration and peak ground velocity following a strong earthquake, B. Seismol. Soc. Am., 91, 1218– 1228, 2001.
25
NHESSD
1, 2109–2126, 2013Earthquake analysis considering
magnitude conver-sion uncertainty
J. P. Wang and Y. Xu
Title Page
Abstract Introduction
Conclusions References
Tables Figures
◭ ◮
◭ ◮
Back Close
Full Screen / Esc
Printer-friendly Version Interactive Discussion
Discussion
P
a
per
|
Dis
cussion
P
a
per
|
Discussion
P
a
per
|
Discussio
n
P
a
per
|
Table 1.Summary of the statistics of the four earthquake variables and the resulting PGA.
Parameters Mean value Standard deviation
NHESSD
1, 2109–2126, 2013Earthquake analysis considering
magnitude conver-sion uncertainty
J. P. Wang and Y. Xu
Title Page
Abstract Introduction
Conclusions References
Tables Figures
◭ ◮
◭ ◮
Back Close
Full Screen / Esc
Printer-friendly Version Interactive Discussion
Discussion
P
a
per
|
Dis
cussion
P
a
per
|
Discussion
P
a
per
|
Discussio
n
P
a
per
|
120 121 122 123
22 23 24 25
120 121 122 123
22 23 24 25
Magnitude < 6 Magnitude 6~7 Magnitude > 7
Kaohsiung
Taipei
Lat
it
ude(
0 N)
Longitude(0E)
Fig. 1.The spatial distribution of more than 55 000 earthquakes since 1900 around Taiwan.
NHESSD
1, 2109–2126, 2013Earthquake analysis considering
magnitude conver-sion uncertainty
J. P. Wang and Y. Xu
Title Page
Abstract Introduction
Conclusions References
Tables Figures
◭ ◮
◭ ◮
Back Close
Full Screen / Esc
Printer-friendly Version Interactive Discussion
Discussion
P
a
per
|
Dis
cussion
P
a
per
|
Discussion
P
a
per
|
Discussio
n
P
a
per
|
120.5 121.0 121.5 122.0 122.5 123.0 23.0
23.5 24.0 24.5 25.0 25.5 26.0
A total of 142 ML >= 6.0 events since 1900 around NPP 4
Lungmen Nuclear Power Plant
L
atitud
e (
0 N)
Longitude ( 0 E)
≥
Fig. 2.The spatial distribution of ML≥6.0 events occurring within a distance of 200 km from
NHESSD
1, 2109–2126, 2013Earthquake analysis considering
magnitude conver-sion uncertainty
J. P. Wang and Y. Xu
Title Page
Abstract Introduction
Conclusions References
Tables Figures
◭ ◮
◭ ◮
Back Close
Full Screen / Esc
Printer-friendly Version Interactive Discussion
Discussion
P
a
per
|
Dis
cussion
P
a
per
|
Discussion
P
a
per
|
Discussio
n
P
a
per
|
6~6.2 6.2~6.4 6.4~6.6 6.6~6.8 6.8~7 7~7.2 7.2~7.4 7.4~7.6 7.6~7.8 7.8~8 8~8.2 0
10 20 30 40 50
(a)
Total number of earthquakes = 142
Mean value = 6.43
Standard deviation = 0.46
No
. Ear
thquakes
Magnitude (ML)
0~20 20~40 40~60 60~80 80~100 100~120 120~140 140~160 160~180 180~200 0
10 20 30 40 50
(b)
Total number of earthquakes = 142
Mean value = 114 km
Standard deviation = 42 km
No.
E
a
rt
hquakes
Source-to-site distance (km)
Fig. 3.Histograms of earthquake size and source-to-site distance for 142 major earthquakes.
NHESSD
1, 2109–2126, 2013Earthquake analysis considering
magnitude conver-sion uncertainty
J. P. Wang and Y. Xu
Title Page
Abstract Introduction
Conclusions References
Tables Figures
◭ ◮
◭ ◮
Back Close
Full Screen / Esc
Printer-friendly Version Interactive Discussion
Discussion
P
a
per
|
Dis
cussion
P
a
per
|
Discussion
P
a
per
|
Discussio
n
P
a
per
|
0.0 0.1 0.2 0.3 0.4 0.5 0.00
0.05 0.10 0.15 0.20 0.25 0.30 0.35 0.40
Pr(PGA > 0.28 g) = 0.15% Lognormal distribution with mean
and standard deviation equal to 0.02 and 0.03, respectively
P
ro
b
a
b
ility
d
e
n
s
ity
PGA (g)
Fig. 4. Probability density function for PGA given its mean and standard deviation equal to
NHESSD
1, 2109–2126, 2013Earthquake analysis considering
magnitude conver-sion uncertainty
J. P. Wang and Y. Xu
Title Page
Abstract Introduction
Conclusions References
Tables Figures
◭ ◮
◭ ◮
Back Close
Full Screen / Esc
Printer-friendly Version Interactive Discussion
Discussion
P
a
per
|
Dis
cussion
P
a
per
|
Discussion
P
a
per
|
Discussio
n
P
a
per
|
0.0 0.2 0.4 0.6 0.8 1.0
1x10⁻⁵
1x10⁻⁴
1x10⁻³
1x10⁻² 1x10⁻¹
1x100
Annual rate of PGA > y*
Recurrence probability of PGA > y* in 50 years
y* (in unit g)
Annual r
a
te
of
PGA > y
*
1x10⁻⁵ 1x10⁻⁴ 1x10⁻³ 1x10⁻² 1x10⁻¹ 1x100
Recur
rence pr
obabi
li
ty
of
PGA > y
* in 50 y
ear
s
Fig. 5.The annual rate of PGA> y∗
and the recurrence probability of PGA> y∗
in 50 yr at the study site in North Taiwan, associated with the uncertainties of major earthquakes and with the errors of two empirical earthquake models.
NHESSD
1, 2109–2126, 2013Earthquake analysis considering
magnitude conver-sion uncertainty
J. P. Wang and Y. Xu
Title Page
Abstract Introduction
Conclusions References
Tables Figures
◭ ◮
◭ ◮
Back Close
Full Screen / Esc
Printer-friendly Version Interactive Discussion
Discussion
P
a
per
|
Dis
cussion
P
a
per
|
Discussion
P
a
per
|
Discussio
n
P
a
per
|
Fig. 6.The spreadsheet created for such a FOSM calculation in this study; texts in red are the