1757
LOSS OF DRY MATTER IN GRAIN CORN STORED UNDER DIFFERENT
CONDITIONS AND EFFECTS ON QUALITY
PERDA DE MATÉRIA SECA EM GRÃOS DE MILHO ARMAZENADOS SOB
DIFERENTES CONDIÇÕES E OS EFEITOS NA QUALIDADE
Paulo Carteri Coradi1, Adílio Flauzino de Lacerda Filho2, José Benício Paes Chaves3, Thalita Oliveira Mota2 1Campus Chapadão do Sul, Federal University of Mato Grosso do Sul – UFMS - Chapadão do Sul – Brazil,
Fone: (0XX67) 3562-6320, [email protected]
2Department of Agricultural Engineering, Federal University of Viçosa (UFV), [email protected],
3Department of Food Technology, Federal University of Viçosa (UFV), [email protected]
Abstract
The corn is the most used raw materials in the diets of animals and also for human consumption. Thus, this study aimed to evaluate the loss of dry matter of corn stored in climate chambers under different conditions of temperature and relative humidity (10 °C and 90% RH, 30 °C and 40% RH). The experiment was conducted in the area of Pre-Processing and Storage of Agricultural Products, Federal University of Viçosa, MG, Brazil. The grains of corn (Zea mays L.) were stored in bags and chambers, in a completely randomized factorial (2x2x5), two types of corn (quality and deteriorated), two temperatures and relative humidity of storage (10% and 90 0C, 30 0C and 40%) and five storage times (zero, three, six, nine and twelve month). A total 4,000 kg of corn was used, divided into four lots of 1,000 kilograms. The following results were obtained: corn deteriorated showed higher dry matter losses during the storage time, the conditions of 10 °C and 90% RH air influence on the loss of dry matter, the physical quality of corn grain was lower for the conditions of 30 °C and 90% RH air, when we obtained lower dry matter losses, the microbiological was directly influenced by the loss of dry matter of corn. It was concluded that, irrespective of the loss of dry matter of corn, product quality was reduced from three months of storage, being the worst results for the conditions of 10 °C and 90% RH in air and corn deteriorated.
Keywords: contamination; performance; quality; temperature.
1. Introduction
In order to obtain satisfactory quality corn is recommended that the levels of water harvesting and storage, without any risk of deterioration, are 24-32 % (w.b.) at harvest; 13-14 % (w.b.) up to one
Universidade Tecnológica Federal do Paraná - UTFPR Campus Ponta Grossa - Paraná - Brasil ISSN: 1981-3686/ v. 9, n. 1: p. 1757-1770, 2015
D.O.I.: http://dx.doi.org/10.3895/rbta.v9n1.1868
Revista Brasileira de Tecnologia
Agroindustrial
1758
year storage and 12% (w.b.) for storing up to one year (ALENCAR et al., 2011). Several studies on stored grain indicate that the temperature and relative humidity of the grains are the main controlling factors for safe storage. Due to the geographical position of Brazil and its large land area has large climatic variations. To ensure the quality of stored products is necessary to know the conditions of the air in the storage place. The grain storage can be defined as an ecosystem in which qualitative and quantitative changes may occur caused by interactions between the physical, chemical and biological. The most important factors that affect the grain during storage and cause the loss of dry matter are: temperature, humidity, concentration of carbon dioxide and oxygen in the interstitial air, kernel characteristics, and presence of microorganisms, insects, mites, weather conditions and grain structure (JIAN et al., 2012; RIBEIRO et al., 2012). Independent of temperature, moisture and mechanical damage according to commercial classification American, corn passes from type 2 to type 3 when the loss of dry matter level reaches 0.5% (ANTUNES et al., 2011). After this study, many researchers began to use the value of 0.5% as the maximum allowable dry matter loss in simulation models for drying and storage of corn.
In Brazil, it has become common practice, the storage units, the use of indices to be recognized as relating to, reduction of the mass during storage. Discounts of up to 0.3% by mass, per month, regardless of the type of grain, the physical characteristics, the degree of infestation of the product and local climatic conditions, were made by way of dry matter loss, also called “break-technique”. However, in the early 80s, often noted the existence of significant remnants of stored products (mainly corn in bulk) in the storage units, which also applied retentions, as a technical break of up to 0.3% per month in addition to the discount due to the natural reduction in water content during storage, which may or may not occur. This showed that, in normal bulk storage, hardly the loss of dry matter percentages reach the pre-set discounts. Thus, this study aimed to evaluate the loss of dry matter of corn stored in climate chambers under different conditions of temperature and relative humidity (10 °C and 90% RH, 30 °C and 40% RH) and their quality.
2. Materials and Methods
The experiment was conducted in the area of Pre-Processing and Storage of Agricultural Products in Manufacturing Industry ration Agricultural Engineering Department (AED) and the Experimental Area of the Department of Animal Science, both from the Center for Agricultural
1759
Sciences, Federal University of Viçosa, MG, Brazil. The grains of corn (Zea mays L.) were stored in sacks in chambers with controlled temperatures and relative humidities of 10 0C and 90%, 30% and 40 0C. A total of 4000 kg of corn used, divided into four batches of 1000 kg. During the storage of corn were monitored temperature and relative humidity of the indoor air daily. Corn samples were collected from 200 grams in all bags, with the aid of a manual auger. The collected product was homogenized, and then removed a simple sample of work for quality assessment.
The experiment was conducted in a completely randomized design in a factorial design (2x2x5), two types of corn (quality and deteriorated), two temperatures and air relative humidity storage (10% and 90 0C, 30 0C and 40%) five days of storage (zero, three, six, nine and twelve months). Statistical evaluation of the data was performed using analysis of variance and regression; in case of significant effect of treatment means were compared by Tukey test at 1% and 5% probability, using the statistical program Sisvar® 4.3.
The water content of corn (% w.b.) was determined using the indirect method, the meter of moisture Geole (G-800) after that equipment being calibrated with the official method from the oven, set at 103 ºC ± 2 ºC for 24 h (BRASIL, 2009). Determination of water activity was performed in equipment TESTO 150, suitable for measurement of water activity with temperature control of samples made in an oven at 25 ºC (BRASIL, 2009). The bulk density of the grain was determined in three replicates through a test weight balance with 250 mL (BRASIL, 2009). The analysis of electrical conductivity in maize grain was made using the "System cup" or "mass Conductivity" (VIEIRA, 1994). The tests were conducted in six replicates of 50 grains per treatment over the storage period. The readings were made in measuring electrical conductivity Tecnopon brand, model CA-150, with adjustment for temperature compensation and electrode cell constant of 1 µS cm-1 g-1. To determine the weight of a thousand grains were used eight replicates of 100 seeds for each treatment and the average of the data was expressed in grams. The analysis of toxigenic Aspergillus sp. was performed using medium of Batata-Dextrose-Ágar acidified with 10% tartaric acid to a pH of 3.5 (DHINGRA & SINCLAIR, 1995). The variations in CO2 levels were monitored daily, with the aid of a digital analyzer of CO2. The CO2 concentration readings were taken within the grains and the storage chambers (%) (VOGEL, 2002). To determine dry matter, followed by the method described by VOGEL (2002).
1760 3. Results and Discussion
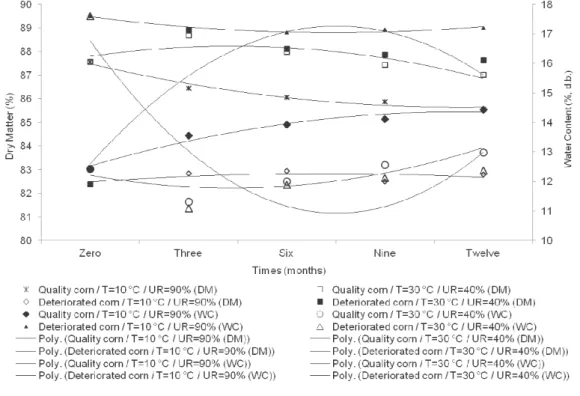
In Figure 1 was observed that the water content of corn stored increased approximately by 1% (w.b.) over time under the conditions of 30 0C and 40% relative humidity.
Figure 1 - Comparison of dry matter and water content in corn kernels stored in different conditions of temperature and RH of the air
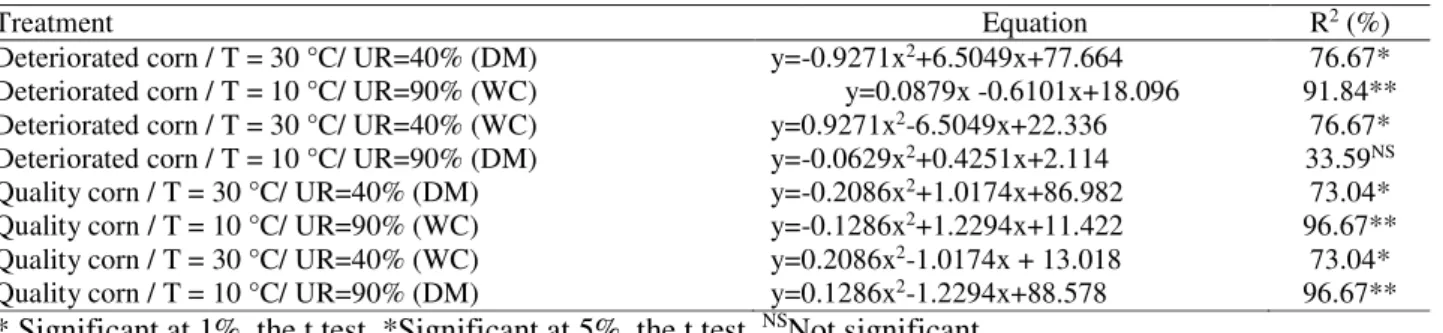
While the conditions of 10 0C and 90% RH storage, the water content of the corn grain quality came at 12% (w.b.) to 14.5% (w.b.), moreover, damaged grains remained at levels of water above 17% (w.b.) from the start of storage. For all treatments were no changes in the dry matter of the stored product (P<0.01). However, for the corn grains stored under the conditions of 10 0C and 90% RH, the rate of dry matter were lower. It was found in Table 1, the results of dry matter and water content were significant at 1 and 5% probability and were appropriately adjusted curves polynomial (R²=96.67%), with the exception of corn deteriorated and stored under conditions 10 0C and 90% RH air, for water contents.
1761 Table 1 - Equations adjusted to the dry matter and water content for the treatment of corns deteriorated in quality and
storage conditions of 30 0C and 40%, 10 0C and 90%
Treatment Equation R2 (%)
Deteriorated corn / T = 30 °C/ UR=40% (DM) y=-0.9271x2+6.5049x+77.664 76.67*
Deteriorated corn / T = 10 °C/ UR=90% (WC) y=0.0879x -0.6101x+18.096 91.84** Deteriorated corn / T = 30 °C/ UR=40% (WC) y=0.9271x2-6.5049x+22.336 76.67*
Deteriorated corn / T = 10 °C/ UR=90% (DM) y=-0.0629x2+0.4251x+2.114 33.59NS
Quality corn / T = 30 °C/ UR=40% (DM) y=-0.2086x2+1.0174x+86.982 73.04*
Quality corn / T = 10 °C/ UR=90% (WC) y=-0.1286x2+1.2294x+11.422 96.67**
Quality corn / T = 30 °C/ UR=40% (WC) y=0.2086x2-1.0174x + 13.018 73.04*
Quality corn / T = 10 °C/ UR=90% (DM) y=0.1286x2-1.2294x+88.578 96.67**
** Significant at 1%, the t test. *Significant at 5%, the t test. NSNot significant
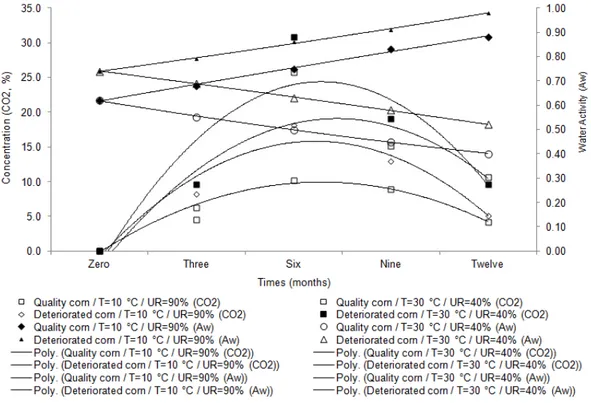
Figure 2 are the values of CO2 and water activity of corn stored under different conditions of temperature and relative humidity. According to Table 2, the values of Aw and CO2 were significant at the 1% and 5% probability. The polynomial equations were satisfactory adjustment of the experimental data. It has been observed in Figure 2, there was an increase in the breathing process of the corn grains after three months of storage, reducing its intensity at nine months of storage, with higher values for the damaged grains and the conditions 10 °C and 90% relative humidity. On the other hand, the water activity of the corn grains tended to respiratory process of the product, ie the Aw was increased over time in stored grain storage conditions of 10 °C and 90% relative humidity, and higher Aw values for the corn grains deteriorated. While for the corn grains stored at 30 °C and 40% relative humidity Aw reduced over time, being lower Aw to corn quality. The results of Figure 2 compared with Figure 1, it was observed that there was a loss of dry matter, due to the increase of the respiratory process of stored grain, with heavy consumption of oxygen and release CO2 in conditions of high humidity air.
1762 Figure 2 - CO2 concentration (%) and water activity (Aw) in corn stored over time
Table 3 - Equations adjusted to the concentrations of CO2 and activity for the treatment of corns deteriorated in quality and
storage conditions of 30 0C and 40%, 10 0C and 90%
Treatment Equation R2 (%)
Deteriorated corn / T = 30 °C/ UR=40% (CO2) y=-5.0664x2+33.282x-30.294 81.6*
Deteriorated corn / T = 10 °C/ UR=90% (Aw) y = 0.0014x2+0.0514x+0.686 99.8**
Deteriorated corn / T = 30 °C/ UR=40% (Aw) y=-0.0007x2-0.0507x+0.792 99.9**
Deteriorated corn / T = 10 °C/ UR=90% (CO2) y=-3.3757x2+21.744x-19.218 92.8*
Quality corn / T = 30 °C/ UR=40% (CO2) y=-3.5664x2+24.582x-23.294 70.2*
Quality corn / T = 10 °C/ UR=90% (Aw) y=-0.0007x2+0.0713x+0.546 99.6**
Quality corn / T = 30 °C/ UR=40% (Aw) y=0.0029x2 -0.0711x+0.686 99.8**
Quality corn / T = 10 °C/ UR=90% (CO2) y=-1.9386x2+12.733x-10.982 99.3**
** Significant at 1%, the t test. *Significant at 5%, the t test
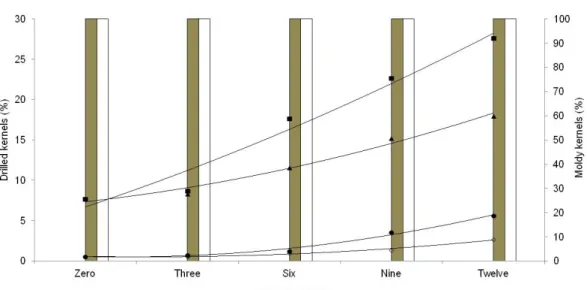
Figure 3 was compared moldy grains and drilled over storage time for different conditions of temperature and relative humidity. It was observed that there was an increase of grain drilled with increasing storage time, especially significantly (P<0.05) from the three months.
1763 Figure 3 - Relationship of corn and moldy drilled along the storage time for different conditions of temperature and relative
humidity
For the grain drilled, it was found that the conditions of 30 °C and 40% more negatively influence the quality, whereas in the types of grain, deteriorated product was greatly affected. Moreover, the grains did not show quality problems with mildew in any of the storage conditions, over twelve months, whereas damaged grains got moldy and remained at all times, regardless of storage conditions. In Table 4 there is the polynomial regression equations fitted to the experimental values of grain drilled and coefficients of determination (R2) with their significance levels. Analyzing the results of Table 4, it is seen that the polynomial equation representing satisfactorily experimental data.
Table 4 - Equations adjusted to values drilled and moldy grains for the treatment of corn quality deterioration and storage conditions of 30% and 40 0C, 10 0C and 90%
Treatment Equation R2 (%)
Deteriorated corn / T = 30 °C/ UR=40% (Drilled) y=0.2865x2+3.607x+2.7546 96.7*
Deteriorated corn / T = 10 °C/ UR=90% (Drilled) y=0.336x2+0.7282x+6.2838 98.4**
Quality corn / T = 10 °C/ UR=90% (Drilled) y=0.1838x2-0.5981x + 0.9964 97.9*
Quality corn / T = 30 °C/ UR=40% (Drilled) y=0.3939x2-1.0696x+1.2254 98.8**
1764
Figure 4 it was observed that the physical quality of corn reduced during the storage time (p<0.05), regardless of storage condition. The amounts of grain rot and fermentation conditions were higher than 30 0C and 40% relative humidity in storage. The corn grain quality was less affected by storage conditions that damaged grains. In all treatments indices burnt grains and fermented become significant in lots, from the three months of storage (p<0.05).
Figure 4 - Corn grains rot and fermented over time for different storage conditions of temperature and relative humidity
Throughout the storage time of corn was in all batches larger quantities of fermented beans than burned, but from six months storage the contents of damaged kernels of grain increased and remained constant fermented. The burning grains constitute a major problem in the warehouses of corn, due to falling grain quality, resulting in the depreciation of production. According to PINTO et al. (2007) and CORADI et al. (2011) starts the process of deterioration in the field and extends over the post-harvest processes may or may not undergo fermentation stages before the grains are burnt. According to these authors, the causal agents of rot grains most commonly found in corn are Fusarium, Aspergillus,
Penicillium, Cladosporium, Cephalosporium and Stenocarpella.
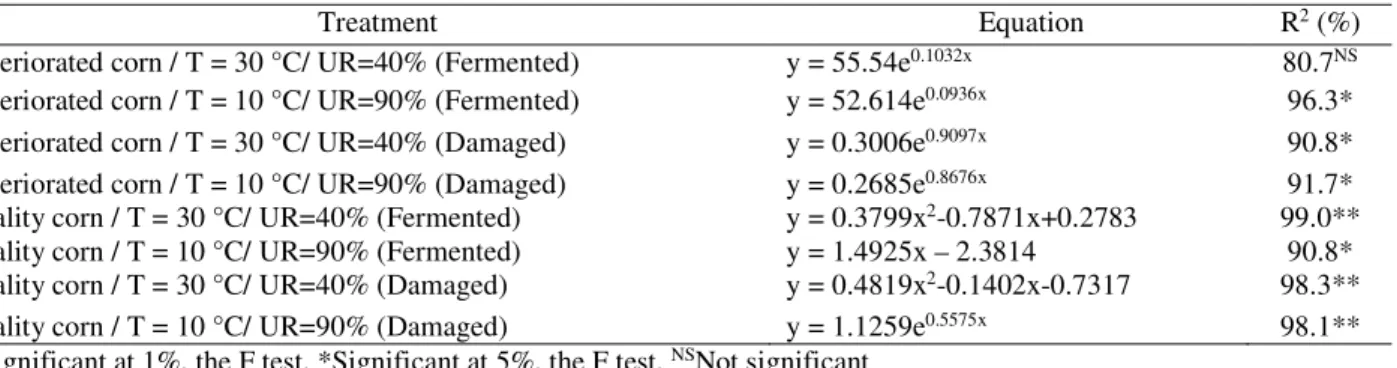
Table 5 presents the models adjusted for the percentage of damaged grains and fermented a function of time, the quality of corn and storage condition. The settings of exponential and polynomial models were adequate for treatments. It was noted that the models had a high significance level for the
1765
coefficient of determination (R²) and only the corn kernels fermented type deteriorated stored at 30 °C and humidity of 40% relative was not significant under the test F. Figure 5 show reduced density of corn over storage time (P<0.05), between treatments, corn kernels damaged had lower weights, while among the storage conditions, temperature 10 °C and 90% RH air were affected more than the density of the product.
Table 5 - Equations fitted to the values of damaged grains and fermented for treatments of corns and deteriorated quality storage conditions of 30 0C and 40%, 10 0C and 90%
Treatment Equation R2 (%)
Deteriorated corn / T = 30 °C/ UR=40% (Fermented) y = 55.54e0.1032x 80.7NS
Deteriorated corn / T = 10 °C/ UR=90% (Fermented) y = 52.614e0.0936x 96.3*
Deteriorated corn / T = 30 °C/ UR=40% (Damaged) y = 0.3006e0.9097x 90.8*
Deteriorated corn / T = 10 °C/ UR=90% (Damaged) y = 0.2685e0.8676x 91.7*
Quality corn / T = 30 °C/ UR=40% (Fermented) y = 0.3799x2-0.7871x+0.2783 99.0**
Quality corn / T = 10 °C/ UR=90% (Fermented) y = 1.4925x – 2.3814 90.8* Quality corn / T = 30 °C/ UR=40% (Damaged) y = 0.4819x2-0.1402x-0.7317 98.3**
Quality corn / T = 10 °C/ UR=90% (Damaged) y = 1.1259e0.5575x 98.1**
** Significant at 1%, the F test, *Significant at 5%, the F test, NSNot significant
The use of electrical conductivity of grains and seeds is gaining space for determining quality of plant products. The test indirectly assesses the degree of cell membrane integrity considering that when immersed in water, seeds low release force higher amounts of electrolytes (TORRES et al., 2009).
Figure 5 - Bulk density (kg m-3) corn kernels and deteriorated in quality over time at different storage conditions of
temperature and RH of the air
1766
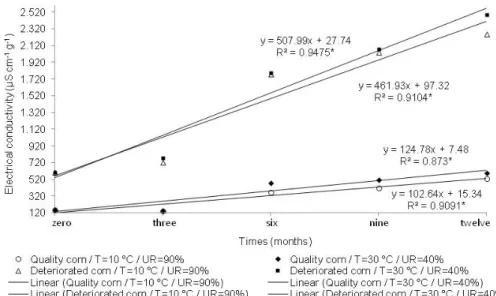
In the evaluation of electric conductivity (Figure 6), it was found that there was a linear increase (P<0.05), the amount of potassium ions leached over time storage for all treatments. There was a big difference between the types of corn, and corn quality was much less affected by storage. While among storage conditions, temperature 30 °C and 40% RH air over affect the quality of corn, as regards electrical conductivity.
Figure 6 - Electrical conductivity (µS cm-1) of corn grain quality and deteriorated over time storage conditions of
temperature and RH of the air
*Significant at 5%, the F test
COSTA & CARVALHO (2006) used the electrical conductivity test to sort corn plots with different damage drying and storage, considering the test efficient, fast and practical. CORADI et al. (2011) found that the occurrence of mechanical damage induced an increase in electrical conductivity in corn grains and thus the increase in electrical conductivity in corn may be due to damage to the structure of cell membranes produced by fungi, similar results were obtained in this study. In Figure 7 was evaluated the thousand kernel weight, and the results obtained were satisfactory for damaged grains at 30 °C and 40% RH air and not significant for the conditions of 10 °C and 90% RH of air storage.
1767 Figure 7 - Thousand kernel weight (g) of corn kernels and deteriorated in quality over time storage conditions of
temperature and RH of the air
**Significant at 1%, the F test, *Significant at 5%, the F test, NSNot significant
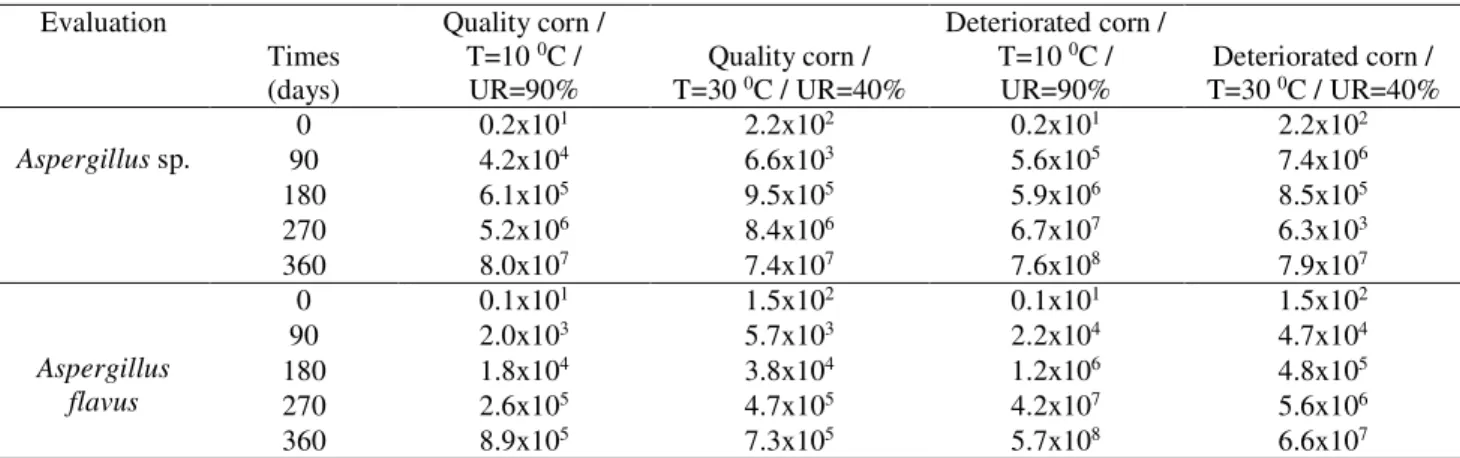
The results of the physical assessments of stored corn (Figures 3, 4, 5, 6 and 7) are directly involved with the loss of dry matter of the product. In these evaluations, the results are more satisfactory quality for the conditions of low temperature and high relative humidity, or when the product has higher loss of dry matter (Figure 1). Unlike the microbiological, wherein the dry matter favored increase the quality of the stored product, allowing for low interaction with the water content of the atmosphere, thereby significantly reduced contamination levels (Tables 6). Analyzing the results in Table 6, it was found that there was an increased rate of fungal contamination during the storage time of 0.1x101 to 7.6x10⁸ CFU.g-1. The corn was damaged which showed the highest levels of contamination, regardless of storage conditions. While the conditions of 10 °C and 90% relative humidity conditions were less favorable for the storage of corn, according to other quality results observed in this study. According to NESCI et al. (2003) and SOUSA & SILVA (2008) the development of fungi in grains causes a change of the odor and germination, discoloration, accumulation of free fatty acids, decrease in quantity and quality of nutrients, compaction, formation of mycotoxins and heating and may even lead to fire and /or explosion. These changes help to reduce the quality of the feed and consequently worsen the zootechnical performance indices. Currently, the fungi
1768
are the main causes of damage and deterioration in agricultural products, as in the fight against insect pests and rodents are used more modern techniques of control.
Table 6 - Evaluation of fungus (CFU.g-1) for different types of corn, the conditions and time of storage
Evaluation Times (days) Quality corn / T=10 0C / UR=90% Quality corn / T=30 0C / UR=40% Deteriorated corn / T=10 0C / UR=90% Deteriorated corn / T=30 0C / UR=40% Aspergillus sp. 0 0.2x101 2.2x10² 0.2x101 2.2x10² 90 4.2x10⁴ 6.6x10³ 5.6x10⁵ 7.4x10⁶ 180 6.1x10⁵ 9.5x10⁵ 5.9x10⁶ 8.5x10⁵ 270 5.2x10⁶ 8.4x10⁶ 6.7x10⁷ 6.3x10³ 360 8.0x10⁷ 7.4x10⁷ 7.6x10⁸ 7.9x10⁷ Aspergillus flavus 0 0.1x101 1.5x10² 0.1x101 1.5x10² 90 2.0x10³ 5.7x10³ 2.2x10⁴ 4.7x10⁴ 180 1.8x10⁴ 3.8x10⁴ 1.2x10⁶ 4.8x10⁵ 270 2.6x10⁵ 4.7x10⁵ 4.2x10⁷ 5.6x10⁶ 360 8.9x10⁵ 7.3x10⁵ 5.7x10⁸ 6.6x10⁷
According to SCUSSEL (1998) fungal growth is dependent on intrinsic (when attached to the substrate) and extrinsic (when attached to conditions involving the substrate), such as: water activity (Aw) of the substrate, temperature, and relative humidity, substrate pH, oxygen availability, redox potential, microbial interactions (competition microbiological), substrate composition (nutrient availability), strain of the fungus contaminant, mechanical damage, presence of foreign material and impurities, that vehicles are contamination and the presence of mites and insects in grains, which are also vehicles of contamination and cause disruption of the grain thus promoting water absorption and facilitates invasion and penetration of fungi in these substrates, thereby enabling one rapid development of fungi (ANTONELLO et al., 2009). Under favorable conditions of temperature and humidity, fungal spores germinate and form hyphae develop their mycelium on grain mass leading to the losses mentioned above (MARVIN et al., 2009; JAY, 2005).
4. Conclusions
The corn deteriorated showed higher dry matter losses during the storage time. The conditions of 10 °C and 90% RH air influence on the loss of dry matter. The physical quality of corn was lower for the conditions of 30 °C and 90% RH air. The microbiological quality was directly influenced by the loss of dry matter of corn. It was concluded that, irrespective of the loss of dry matter of corn, product
1769
quality was reduced from three months of storage, being the worst results for the conditions of 10 °C and 90% RH air, and for corn deteriorated.
Acknowledgements
The authors would like to thank the CAPES and CNPq Foundations, the Federal University of Mato Grosso do Sul and Department of the Agricultural Engineering and Federal University of Viçosa, Brazil, for its financial support.
Resumo
O milho é a matéria-prima mais utilizada nas dietas de animais e também para o consumo humano. Assim, neste trabalho objetivou-se avaliar a perda de matéria seca dos grãos de milho armazenados em câmaras climáticas sob diferentes condições de temperatura e umidade relativa do ar (10 °C e 90% UR, 30 °C e 40% UR). O experimento foi conduzido na área de Pré-Processamento e Armazenamento de Produtos Agrícolas da Universidade Federal de Viçosa, MG, Brasil. Os grãos de milho (Zea mays L.) foram armazenados em sacos e em câmaras climáticas, em um delineamento experimental inteiramente casualizado de fatorial (2x2x5), sendo dois tipos de milho (qualidade e deteriorado), duas temperaturas e umidade relativa do ar de armazenamento (10% e 90 0C , 30 0C e 40%) e cinco tempos de armazenamento (zero, três, seis, nove e doze meses). Um total de 4000 kg de milho foi utilizado, divididas em quatro lotes de 1000 kg. Foram obtidos os seguintes resultados: o milho deteriorado apresentou maiores perdas de matéria seca ao longo do tempo de armazenamento; as condições de 10 °C e 90% de UR do ar influenciaram na perda de matéria seca; a qualidade física dos grãos de milho foi menor para as condições de 30 °C e 90% de UR do ar, quando se obteve menores perdas de matéria seca; a qualidade microbiológica foi influenciada diretamente pela perda de matéria seca dos grãos de milho. Concluiu-se que, independente da perda de matéria seca dos grãos de milho, a qualidade do produto foi reduzida a partir dos três meses de armazenamento, sendo os piores resultados para as condições de 10 °C e 90% de UR do ar e para o milho deteriorado.
Palavras-chave: contaminação; qualidade; rendimento; temperatura
References
ALENCAR, E. R.; FARONI, L. R. D.; FERREIRA, L. G.; COSTA, A. R. DA; PIMENTEL, M. A. G. Qualidade de milho armazenado e infestado por Sitophilus zeamais e Tribolium castaneum. Engenharia na Agricultura, v. 19, p. 9-18, 2011.
ANTONELLO, L. M.; MUNIZ, M. B.; BRAND, S. C.; VIDAL, M. D.; GARCIA, D.; RIBEIRO, L.; SANTOS, V. Qualidade de sementes de milho armazenadas em diferentes embalagens. Ciência Rural, v. 39, p. 2191-2194, 2009. ANTUNES, L. E. G.; VIEBRANTZ, P. C.; GOTTARDI, R.; DIONELLO, R. G. Características físico-químicas de grãos de milho atacados por Sitophilus zeamais durante o armazenamento. Revista Brasileira de Engenharia Agrícola Ambiental, v. 15, p. 615-620, 2011.
1770 CORADI, P. C.; LACERDA FILHO, A. F.; MELO, E. C. Quality of raw materials from different regions of Minas Gerais State utilized in ration industry. Revista Brasileira de Engenharia Agrícola e Ambiental, v. 15, p. 424-431, 2011.
COSTA, P. S. C.; CARVALHO, M. L. M. Teste de condutividade elétrica individual na avaliação da qualidade fisiológica de sementes de café (Coffea arabica L.). Ciência e Agrotecnologia, v. 30, p. 92-96, 2006.
DHINGRA, O.; SINCLAIR, J. B. Basic Plant Pathology Methods. 2 ed. University of Illinois: CRC Press, 1995. 448p.
JIAN, F.; LARSON, R.; JAYAS, D. S.; WHITE, N. D. G. Three dimensional temporal and spatial distributions of adult
Oryza ephilus surinamensis and Sitophilus oryzae in stored wheat under different temperatures, moisture contents, and adult
densities. Journal of Stored Products Research, v. 49, p. 155-165, 2012.
JAY, J. M. Microbiologia de Alimentos. Trad. Eduardo Cesar Tondo et al. 6. ed. Porto Alegre: Artmed, 2005, 711p.
MARVIN, H. J. P.; KLETER, G. A. Early awareness of emerging risks associated with food and feed production: Synopsis of pertinent work carried out within the Safe Foods project, Food Chemical Toxicology, v. 47, p. 911-914, 2009.
NESCI, A.; RODRIGUEZ, M.; ETCHEVERRY, M. Control of Aspergillus growth and aflatoxin production using antioxidants at different conditions of water activity and pH. Journal of Applied Microbiology, v. 95, n. 2, p. 279-287, 2003.
PINTO, N.F.J.A.; VERGAS, E.A.; PREIS, R.A. Qualidade sanitária e produção de fumonisina B1 em grãos de milho na fase de pré-colheita. Summa Phytopathologica, Jaguariúna, v. 33, n. 3, p. 304-306, 2007.
RIBEIRO, C. S. N.; MARTINS, G. V.; GUIMARÃES, J. F. R.; SILVA, E. F. Resistência de genótipos de arroz a pragas de grãos armazenados. Revista Caatinga, v. 25, p. 183-187, 2012.
SCUSSEL, V. M. Micotoxinas em Alimentos. Florianópolis: Insular, 1998, 144p.
SOUSA E SILVA, J. Secagem e armazenagem de produtos agrícolas. In: SOUSA E SILVA, J. et al. Indicadores da qualidade dos grãos. 2 ed. Viçosa: Aprenda Fácil, 2008, p. 63-107.
TORRES, S. B.; MEDEIROS, M. A.; TOSTA, M. S.; COSTA, G. M. M. Teste de condutividade elétrica em sementes de gergelim. Revista Brasileira de Sementes, v. 31, p. 70-77, 2009.
VIEIRA, R. D. Teste de condutividade elétrica. In: VIEIRA, R. D.; CARVALHO, N. M. Testes de vigor em sementes. Jaboticabal: FUNEP/UNESP, 1994, p. 103-132.