Universidade de Aveiro 2016
Departamento de Biologia
Débora de Oliveira
Reis
Caracterização do potencial citotóxico das nanoplaquetas
de grafeno em células do pulmão
Characterization of the cytotoxic potential of graphene
nanoplatelets in lung cells
DECLARAÇÃO
Declaro que este relatório é integralmente da minha autoria, estando
devidamente referenciadas as fontes e obras consultadas, bem como
identificadas de modo claro as citações dessas obras. Não contém, por isso,
qualquer tipo de plágio quer de textos publicados, qualquer que seja o meio
dessa publicação, incluindo meios eletrónicos, quer de trabalhos académicos.
Universidade de Aveiro 2016
Departamento de Biologia
Débora de Oliveira
Reis
Caracterização do potencial citotóxico das nanoplaquetas
de grafeno em células do pulmão
Characterization of the cytotoxic potential of graphene
nanoplatelets in lung cells
Dissertação apresentada à Universidade de Aveiro para cumprimento dos requisitos necessários à obtenção do grau de Mestre em Biologia Molecular e Celular, realizada sob a orientação científica da Doutora Helena Cristina Correia de Oliveira, Investigadora em Pós-Doutoramento do Departamento de Biologia e do Centro de Estudos do Ambiente e do Mar (CESAM) da Universidade de Aveiro.
Apoio financeiro da Fundação para a Ciência e Tecnologia (FCT) pelo projeto ERA--SIINN/0003/2013 e do CESAM (Ref. FCT UID/AMB/50017), por parte da
FCT/MEC através de fundos nacionais, e pelo cofinanciamento pelo FEDER, no âmbito do Acordo de Parceria PT2020 e Compete 2020.
Dedico este trabalho aos meus pais, por todos os sacrifícios que fizeram para que pudesse seguir os meus sonhos e por nunca deixarem de acreditar em mim.
O júri
Presidente Professora Doutora Maria Helena Abreu Silva
Professora Auxiliar do Departamento de Biologia da Universidade de Aveiro
Arguente Principal Doutora Sónia Marina Pinto Nunes da Silva
Investigadora em Pós-Doutoramento do Departamento de Química, QOPNA e CESAM da Universidade de Aveiro
Orientadora Doutora Helena Cristina Correia de Oliveira
Investigadora em Pós-Doutoramento do Departamento de Biologia e CESAM da Universidade de Aveiro
agradecimentos Em primeiro lugar, gostaria de agradecer à minha orientadora, Doutora Helena Oliveira por me ter acompanhado durante este ano e me ter transmitido o conhecimento e a confiança necessários para executar todas as minhas tarefas. Não foi um ano fácil, houveram algumas mudanças, mas pude sempre contar com a sua disponibilidade e incentivo quando as dúvidas apareciam.
Gostaria também de agradecer à minha companheira de laboratório, Juliane, sem ela teria sido uma viagem muito mais difícil. Obrigada por todo o apoio, por ouvires os desabafos e por desesperares comigo! A tua boa disposição e claro, os teus brigadeiros, foram sem dúvida uma grande ajuda.
O meu agradecimento vai também para a Ana e para a Catarina que me acompanharam ao longo do meu trabalho. Companheiras de laboratório, obrigada por toda a ajuda e disponibilidade quando surgiam dúvidas e dificuldades. Mas principalmente, obrigada por todas as conversas, risadas, horas de almoço de tupperware e cafézinhos na esplanada. Como não poderia deixar de ser, o meu principal agradecimento é dirigido aos meus pais, Ana e Mário, foram eles que tornaram tudo isto possível. Acreditaram sempre em mim e nunca pouparam esforços para que me formasse e seguisse os meus sonhos. Ser-vos-ei eternamente grata por todos os sacrifícios e por todo o apoio que me deram.
Também ao meu irmão Rui quero expressar um enorme agradecimento por ter dito as palavras certas, na hora certa, dando-me força e motivação para não desistir.
Quero ainda agradecer aos meus amigos Célia e Fernando que estiveram do meu lado, ouviram os meus desabafos e aturaram as minhas crises. Obrigada por me ajudarem a respirar fundo e a ver a vida de outra forma.
E por último, mas não menos importante, quero dirigir um agradecimento muito especial ao meu namorado José. Obrigada por estares do meu lado, por me ouvires, por acreditares sempre em mim e por nunca me teres deixado desistir. O teu apoio e a tua presença foram fundamentais para conseguir concluir esta etapa na minha vida.
De um modo geral, gostaria de agradecer a todos os professores que contribuiram para a minha formação, por todo o conhecimento e por todos os valores de vida transmitidos.
Um agradecimento ainda à Universidade de Aveiro, pela oportunidade que me porporcionou de estudar e de me formar nesta grande academia. Aveiro é nosso!
palavras-chave Grafeno, nanoplaquetas de grafeno, linha celular A549, toxicidade, ciclo celular, Espécies Reactivas de Oxigénio
resumo O grafeno representa um dos alótropos de carbono. As suas características físico-químicas conferem-lhe propriedades únicas: elevada área superficial, condutividades elétrica e térmica excecionais, grande resistência mecânica, capacidade de bio-funcionalização e produção em massa. Todas estas qualidades tornam o grafeno amplamente aplicável e por isso é necessário investigar detalhadamente os seus possíveis efeitos adversos no contexto da saúde humana. Neste estudo foi avaliado o potencial citotóxico das nanoplaquetas de grafeno em células do pulmão (linha celular A549). As células foram cultivadas in vitro e expostas a várias concentrações de grafeno na forma de nanoplaquetas (5, 10, 25, 50, 100 µg/ml) durante 24h. A viabilidade celular, analisada pelo ensaio WST-8, não diminuiu com a exposição às nanoplaquetas de grafeno, tendo, porém, sido verificado um aumento da proliferação celular para a dose mais baixa. A produção de ROS, bem como a dinâmica do ciclo celular das células A549 também não foram afetados pela exposição às nanoplaquetas de grafeno. Os estudos da internalização celular das nanoplaquetas de grafeno por variação da dispersão lateral da luz mostraram que para a concentração mais elevada (100µg/ml) ocorreu um aumento significativo da internalização destas partículas. Por último, não se verificou indução de apoptose nas células A549 após 24h de exposição às nanoplaquetas de grafeno. De uma forma geral, estes resultados sugerem que as nanoplaquetas de grafeno não induzem toxicidade na linha celular A549.
keywords Graphene, graphene nanoplatelets, cell line A549, toxicity, cell cycle, reactive oxygen species
abstract Graphene is one of the carbon allotropes. Its physical and chemical characteristics provide unique properties: high surface area, exceptional electrical and thermal conductivities, high mechanical strength, ability to bio-functionalization and mass production. All these qualities make graphene widely applicable and, therefore, it is necessary to thoroughly investigate their possible adverse effects in the context of human health. This study evaluated the cytotoxic potential of graphene nanoplatelets in lung cells (cell line A549). The cells were cultured in vitro and exposed to various concentrations of graphene nanoplatelets (5, 10, 25, 50, 100µg/ml) for 24h. Cell viability, assessed by WST-8 assay, did not decrease after exposure to graphene nanoplatelets, however, an increase in cell proliferation for the lowest concentration was observed. ROS production as well as cell cycle dynamics of A549 cells were not affected by graphene nanoplatelets exposure. Cellular uptake of the graphene nanoplatelets, evaluated by changes in light side scatter by flow cytometry, increased significantly for the highest concentration (100µg/ml). In addition, there was no induction of apoptosis in A549 cells after 24 hours of exposure to the graphene nanoplatelets. Overall, these results suggest that graphene nanoplatelets do not induce toxicity in cell line A549.
List of figures
Fig. 1. Schematic representation of carbon allotropes: a) graphite, b) diamond, c) fullerene, d)
carbon nanotubes, e) graphene (adapted from Loos 2015). ... 5
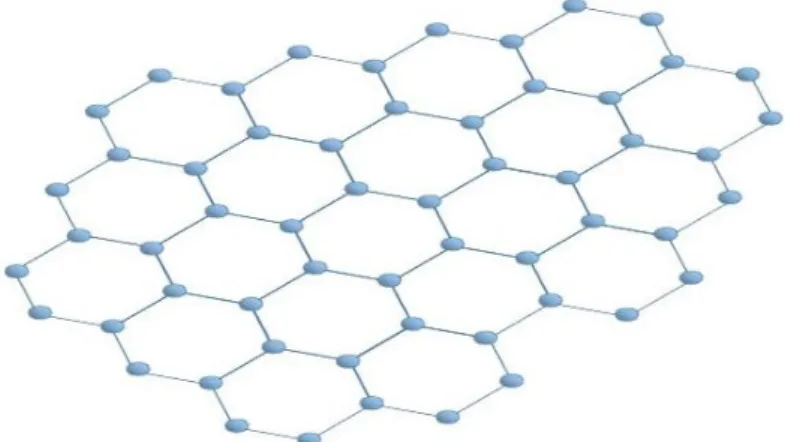
Fig. 2. Graphene has a bi-dimensional honeycomb-like structure. ... 6
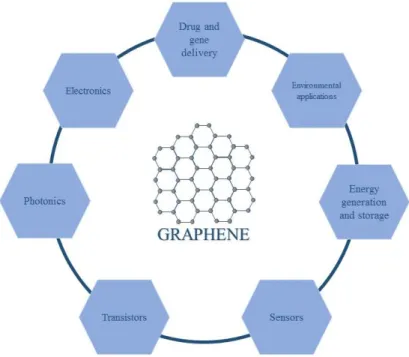
Fig. 3. Main fields of application of graphene. ... 8
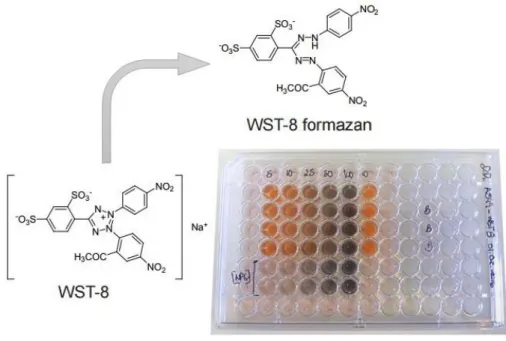
Fig. 4. The WST-8 is a highly water-soluble tetrazolium salt that is reduced to an orange-coloured formazan dye in viable cells. The figure shows a 96-well plate used in this study. ... 14
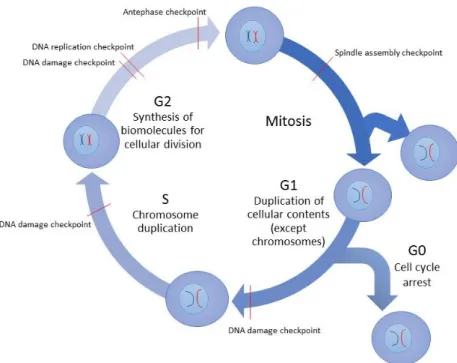
Fig. 5. Schematic representation of cell cycle and its checkpoints for DNA damage control. ... 15
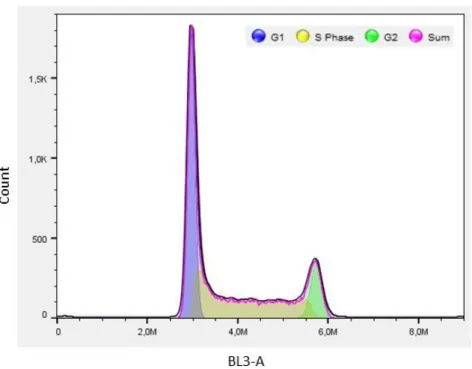
Fig. 6. Cell cycle profile of A549 by flow cytometry. ... 16
Fig. 7. Detection of intracellular ROS by flow cytometry. ... 18
Fig. 8. Mechanisms of endocytosis for cell uptake. ... 18
Fig. 9. Illustration of the mechanism of clathrin-mediated endocytosis (adapted from Murugan et al. 2015). ... 19
Fig. 10. Illustration of caveolae-mediated endocytosis, macropinocytosis and phagocytosis (adapted from Murugan et al. 2015). ... 20
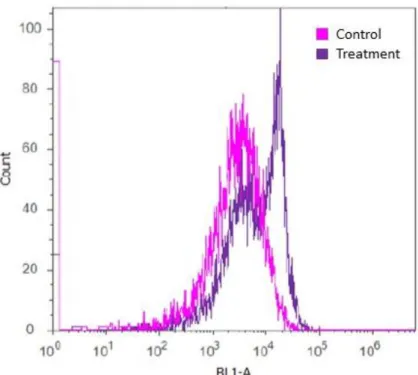
Fig. 11. Analysis of incorporation of nanoparticles by the flow cytometric light scatter parameter. A) Control, B) Treatment. ... 21
Fig. 12 Light microscopy images of A549 cells exposed to GNP for 24h. A – Control; B - 5µg/mL; C - 50µg/mL; D - 100µg/mL. 40X. ... 31
Fig. 13. Effects of GNP in A549 cell viability (mean ± standard deviation), for 24h exposure, following the WST-8 protocol (Protocol I) * indicates significant differences between control at p < 0.05. ... 32
Fig. 14. Effects of GNP in A549 cell viability (mean± standard deviation), according to Protocol II. ... 33
Fig. 15. Viability of A549 cells after exposure to F12K medium pre-incubated with GNPs for 24h - Protocol III (mean± standard deviation) * indicates significant differences between control at p < 0.05. ... 33
Fig. 16. Flow cytometric profile of DCF florescence of A549 cells ... 34
Fig. 17. Intracellular generation of reactive oxygen species (ROS) by A549 cell, at 24 h exposure to GNPs (mean± standard deviation). ... 34
Fig. 18. Cell cycle analysis of A549 after 24h exposure to GNPs. The values are the mean % of cell population (± standard deviation) of the three cell cycle stages. ... 35
Fig. 19. Uptake potential of GNPs by A549 cells after 4h exposure at 4°C and 37°C, assessed by flow cytometry, using the side scattered light (mean± standard deviation). ... 35
Fig. 20. Uptake potential of GNPs by A549 cells after 24h exposure at 37°C, assessed by flow cytometry, using the side scattered light (mean± standard deviation). * indicates significant differences between control at p < 0.05. ... 36
Fig. 21. Analysis of the uptake of GNPs by flow cytometry light scatter. ... 36
Fig. 22. Apoptosis evaluation by flow cytometry using Annexin V-FITC and PI assay. Scatter diagrams of control (A) and cells exposed to 100µg/ml of GNPs (B). ... 37
Fig. 23. Annexin V-FITC and PI assay for apoptosis assessment of A549 after 24h exposure to GNPs. ±SD ... 37
List of tables
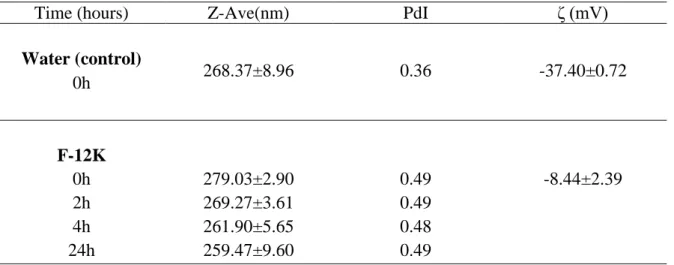
Table 1 – Z-average size (Z-Ave) (with respective polydispersity index PdI) and Zeta Potential (ζ) of GNPs dispersed in ultrapure water (Control) or in F-12K culture medium (10µg/ml). The standards deviations were calculated from the 3 replicates. ... 29Table 2 – Average size distribution of GNPs suspended in water and complete culture medium. The average hydrodynamic size is represented as mean diameter (d.) ± standard deviation (SD) in nm. The relative intensities of size peaks are indicated in %. ... 30
List of Acronyms and Abbreviations
A549 Cancerous human lung cell line
AFM Atomic force microscopy
BEAS-2B Normal human lung (bronchus) cell line
BET Brunauer-Emmett-Teller
C2C12 Mouse mesenchymal progenitor cells CNTs Carbon nanotubes
CXYG Carboxyl graphene nanoplatelets DCF 2’-7’-dichlorofluorescein
DCFH-DA 2’-7’-dichlorodihydrofluorescein diacetate
Dh Hydrodynamic diameter
DLS Dynamic light scattering EDTA Ethylenediaminetetraacetic acid
F-12K Kaighn's Modification of Ham's F-12 Medium
FBS Fetal Bovine Serum
FITC Fluorescein Isothiocyanate
FLG Few-layer graphene
FS Forward-scatter
GFN Graphene-Family Nanomaterials
GQDs Graphene Quantum Dots
GO Graphene Oxide
GN Graphene Nanosheets
GNP Graphene Nanoplatelets
GP Graphene Platelets
HeLa Cancerous human cervix cell line hNSCs Human Neural Stem Cells
LDH Lactate dehydrogenase
MBE Molecular Beam Epitaxy
MLG Multi-layer graphene
MTT [3-(4, 5-Dimethyl-2-thiazolyl)-2,5-diphenyl-2H tetrazolium bromide] NADH Reduced Nicotinamide Adenine Dinucleotide
NMs Nanomaterials
NPs Nanoparticles
OD Optical Density
p-53 tumor suppressor protein
PBS Phosphate buffer saline
PC12 Pheochromocytoma of the rat adrenal medulla cell line PCGO Protein-coated graphene oxide
PEG Polyethylene glycol
PLHC-1 Poeciliopsis lucida hepatocellular carcinoma cell line
PS Phosphatidylserine
rGO reduced-Graphene Oxide
ROS Reactive Oxygen Species
RPMI 1640 Roswell Park Memorial Institute 1640 medium RPMI 8226 Human multiple myeloma cells
SCENIHR Scientific Committee on Emerging and Newly Identified Health Risks SEM Scanning electron microscopy
SS Side-scatter
SWCNTs Single-wall carbon nanotubes TEM Transmission electron microscopy
UK DIUS United Kingdom Department for Innovation, Universities and Skills
U87 Human primary glioblastoma cell line (U-87 MG - Uppsala 87 Malignant Glioma line)
U118 Human Brain Glioma Cells (U-118 MG - Uppsala 118 Malignant Glioma line)
WST-8 [2-(2-methoxy-4-nitrophenyl)-3-(4-nitrophenyl)-5-(2,4-disulfophenyl)-2H-tetrazolium, monosodium salt]
Index
List of figures ... i
List of tables ... i
List of Acronyms and Abbreviations ...ii
1. Introduction ... 1
1.1. Historical Overview ... 1
1.2. Applications of Nanotechnology ... 1
1.3. Nano – words definitions ... 3
1.4. Carbon and its allotropes ... 4
1.4.1. Graphene ... 6
1.4.1.1. Applications ... 7
1.4.1.2. Graphene-family nanomaterials ... 9
1.4.1.3. Graphene’s Toxicology ... 10
2. Assay techniques and biomarkers to access nanoparticle toxicity ... 12
2.1. Cell viability – WST-8 ... 13
2.2. Cell cycle analysis ... 15
2.3. Intracellular ROS detection ... 17
2.4. Nanoparticle cell Uptake ... 18
2.5. Apoptosis/ Necrosis... 21
3. A549 Cell line ... 22
4. Aims ... 23
5. Material and Methods... 24
5.1. Graphene nanoplatelets ... 24
5.2. Characterization of Graphene Nanoplatelets ... 24
5.3. A549 cell line culture ... 24
5.4. Graphene Nanoplatelets exposure ... 25
5.5. Cell viability – Cytotoxicity Assay: WST-8 ... 25
5.6. Flow cytometric analysis of Cell Cycle ... 26
5.7. Intracellular ROS detection assay ... 26
5.8. Uptake Potential of nanoparticles... 27
5.9. Apoptosis/ Necrosis assay – Annexin V/PI ... 27
5.10. Statistical Analysis ... 28
6. Results ... 29
6.2. Confluence and Morphology ... 31
6.3. Cell viability – cytotoxicity assay: WST-8 ... 32
6.4. Intracellular ROS detection ... 34
6.5. Cell Cycle Analysis ... 35
6.6. Cellular Uptake potential of nanoparticles ... 35
6.7. Apoptosis/ Necrosis – Annexin V/PI assay ... 37
Discussion ... 38
Conclusions – Future Perspectives ... 43
1. Introduction
1.1. Historical Overview
Nanotechnology is a science that works on the design, synthesis, development, fabrication and characterization of materials at the nanoscale (Venugopal et al. 2016). It includes areas such as physics, chemistry, biology, material science, health sciences and engineering (Nikam et al. 2014).
The interest on nanomaterials started a long time ago, when Richard Zsigmondy proposed the concept of “nanometer”, having won the 1925 Nobel Prize Laureate in Chemistry (Hulla et al. 2015). After this, the term “nanotechnology” emerged in 1959, when a physicist called Richard Feynman spoke at an American Physical Society meeting (Tarafdar et al. 2013). In this meeting, he presented a lecture titled “There’s plenty of room at the bottom”, introducing the idea of manipulating matter at the atomic level (Hulla et al. 2015). In 1974, Norio Taniguchi, from the Tokyo University of Science, defined “nanotechnology” as a technique that consists in separation, consolidation and deformation of elements by one atom or by one molecule (Tarafdar et al. 2013). Later, in the 1980s, K. Eric Drexler contributed to the development of the nanoscale phenomena through speeches and books (Tarafdar et al. 2013). Since that, the interest in the fields of nanoscience and nanotechnology has been increasing exponentially, with global investments in research and a high number of patents filing related to the technology and products developed within this field (Tarafdar et al. 2013).
1.2. Applications of Nanotechnology
Nanotechnology is an area that is constantly developing. With a high commercial and academic interest, new studies arise every day that seek to apply the extraordinary features of nanomaterials in our daily life.
Nanotechnology can be applied for example to renewable energy, avoiding crises that may result from the exhaustion of fossil fuels (Salamanca-Buentello et al. 2016). The use of photovoltaic technology to capture solar energy (solar cells) is presented as a form of energy sustainability where photovoltaic nanostructures are applied (Mao et al. 2007). Most nanotechnology applications are related to human health care. The demand for
cheaper and effective medical treatments has led to extensive research and to the development of new technologies. Nanomedicine has the function to improve methods and bring technological advances so that health care services can be more efficient (Chakraborty et al. 2011). It gives the opportunity to better understand how human body works and provides tools to fight diseases like cancer. This is a field in expansion and it seeks to respond to the challenges posed by medical science, with special focus on diagnosis, drug delivery systems and patient care (Sahoo et al. 2007). Agriculture is another domain in which nanotechnology can be applied to the development of new tools for the detection and treatment of diseases and the improvement of plants in their efficiency to absorb nutrients (Rai et al. 2012). The use of nanomaterials can help solve problems like pests and improve insecticides and pesticides (Rai et al. 2012). The use of nanotechnology in the food sector still raises some concerns from consumers. However it can be applied, for example, in the packaging of goods, constituting protective barriers against gases and bacteria; the use of nanossensors for the detection of contaminants is another strategy for enhancing foods (Duncan 2011). Access to potable water has become a concerning issue, mostly in less developed countries. The employment of membranes and filters based on carbon nanotubes, nanoporous ceramics, magnetic nanoparticles and other nanomaterials, has already been implemented for the removal of contaminants in water (Hillie et al. 2007). Nanoremediation is a field of nanoscience that attempts to solve problems related to the environmental rehabilitation, applying reactive nanomaterials for transformation and detoxification of pollutants (Karn et al. 2009).
Man has always been exposed to nanoparticles (NPs) in the air, however with the industrial revolution this exposure increased due to the wide use of thermal degradation sources, such as power stations and internal combustion engines (Oberdörster et al. 2005). With the appearance and development of nanotechnology, exposure to NPs have increased, either by inhalation, ingestion, skin contact or injection. The NPs have unique physical, chemical and mechanical characteristics, which give them a high potential for numerous applications. However, these same properties, which apparently are ideal for use in industry and medicine, are likely to be harmful when they interact with cells.
In addition to NPs found in the air, some workplaces are also capable of produce them in quantities which can range up to several hundred micrograms per cubic meter (Oberdörster et al. 2005). Inhalation is the major route of exposure, still it is necessary to take into
account the intake and skin contact during manufacture or use of these nanomaterials. Over the years and due to the expansion of these nanomaterials, the interest their potential side effects on human health has increased.
Nowadays, the nanomaterials play a major rule in the economy, either by their values and their applications. They have a wide range of applications: solar panels, catalysts, tumor therapies, electronics and batteries. One of the major aims of the utilization of nanomaterials is the improvement of quality of life by refining existing materials and products.
1.3. Nano – words definitions
Nanomaterials can be divided into two major classes: natural and anthropogenic nanomaterials (Dhawan et al. 2010). Natural nanomaterials exist in Nature, for example as soil colloids (clay minerals, metal oxides, etc.), crystals of sea salt, and others. The anthropogenic nanomaterials can be further classified as incidental (nanomaterials manmade unintentionally – road and air transports) and as manufactured (nanomaterials produced because of their properties) (Dhawan et al. 2010).
The term nanomaterial does not have a single definition (Boholm et al. 2016). To the scientific research, definitions are very important since they allow replication and precise critical evaluation (Boholm et al. 2016).
Many definitions have been proposed, for example, the United Kingdom Department for Innovation, Universities and Skills (UK DIUS), defines a nanomaterial as “a material having one or more external dimensions in the nanoscale or which is nanostructured” (British Standards Institution 2007); the Scientific Committee on Emerging and Newly Identified Health Risks (SCENIHR) describes a nanomaterial as “any form of material that is composed of discrete functional parts, many of which have one or more dimensions of the order of 100 nm or less” (SCENIHR 2007); the European Commission adopted a definition of a nanomaterial in 2011 (Potočnik 2011) that characterizes a nanomaterial “as a natural, incidental or manufactured material, containing particles in the unbound state or as an aggregate or an agglomerate, and where, for 50% or more of the particles in the number size distribution, one or more external dimensions is in the size range 1nm – 100nm”.
In addition to nanomaterial, there are other important terms regarding to nanotechnology (Khanna 2016):
Nano-object – it is a common term applied to all distinct nanoscale objects; it refers to an object with one or more dimensions in the nanoscale.
Nanoparticle – it is basically a nano-object with its three dimensions in the nanoscale.
Nanoplate – it has one dimension in the nanoscale, but the other two are much wider.
Nanofiber – it has two dimensions in the nanoscale and the third dimension is wider than the first.
Nanotube – it can be considered as an unfilled nanofiber.
There is some controversy about the nano-words and the absence of a single definition can be a problem for the scientific progress and regulation (Boholm et al. 2016); however, it is important to point that the manipulation of the nanomaterials is covered by laws to ensure safety and health to workers and protection to the environment.
1.4. Carbon and its allotropes
Carbon is the most important element found on Earth, and it yields the basis of all living organisms. Organic carbon it’s found in animals and plants as a constituent of proteins, amino acids, lipids and nucleic acids. After millions of years, it can be transformed into fossil fuels (Loos 2015). Inorganic carbon is present in diamonds, pencils, lubricants and polymeric materials (Loos 2015). Carbon has wide technological application, varying from biomedicine to synthetic materials, due to its capacity to bind to itself and to almost all the elements (Hirsch 2010).
Basic carbon forms exist in two natural allotropes: diamond and graphite (Hirsch 2010). Diamond has a cubic and hexagonal configuration and represents sp3-hibridized carbon atoms (Loos 2015; Hirsch 2010). Graphite is a very stable thermodynamic material and its structure is formed of sheets of atoms with an hexagonal arrangement, known as graphene (Loos 2015) (Figure 1).
Fig. 1. Schematic representation of carbon allotropes: a) graphite, b) diamond, c) fullerene, d) carbon nanotubes, e) graphene (adapted from Loos 2015).
In 1985, Kroto et al. discovered a new allotrope, called fullerene (C60), which is composed of a hollow cluster with 60 carbon atoms (or more), disposed as hexagons and pentagons (Loos 2015). Because of this discovery, Robert F. Curl Jr., Sir Harold Kroto and Richard E. Smalley were awarded with the 1996 Nobel Prize in Chemistry. For their application, fullerenes are chemically functionalized, because this confers them exclusive properties, such as increased solubility in any solvent (Hirsch 2010).
A few years later, Iijima (1991) synthesized another allotrope, the carbon nanotubes (CNTs), consisting of needle-like tubes. CNTs can be single-walled or multi-walled and usually they have diameters in the order of one or two nanometers, but can be a few millimeters in length (Hirsch 2010). CNTs are chemically resistant, the electrical conductivity can be controlled and they can produce refined molecular structures (Takamura 2009).
Finally, in 2004, Andre Geim and Konstantin Novoselov were able to prepare single-graphene layers by simple mechanical exfoliation of graphite (Novoselov et al. 2004). The isolation of this major carbon allotrope awarded them the 2010 Nobel Prize in Physics.
1.4.1. Graphene
When graphene was described, it immediately proved to be a compound of great potential due to all their physicochemical properties (Novoselov et al. 2004). Graphene consists of a monolayer of carbon atoms rearranged in a bi-dimensional honeycomb-like structure (Figure 2).
Until the discovery of graphene, it was assumed that bi-dimensional compounds were thermodynamically unstable unless they were part of a 3D structure (Geim et al. 2007). The isolation of graphene showed that the crystals had a high quality and were stable, showing that it would be possible to have reliable 2D materials (Novoselov et al. 2004; Geim et al. 2007).
Mechanical exfoliation (repeated peeling) was the technique first used to isolate graphene films, resulting in graphene films of about 10 µm in size (Novoselov et al. 2004). It is also possible to isolate graphene through chemical exfoliation, interspersing graphite with atoms and molecules so that their sheets are separated layer by layer. Furthermore, graphene can be obtained by Molecular Beam Epitaxy (MBE), which offers viable ways to produce graphene for electronic applications (Geim et al. 2007). However, even with all the existing techniques and all efforts to improve them, the mechanical exfoliation is still the technique that produces graphene with higher quality (Singh et al. 2011).
An extensive work is being done to understand all the potentials of graphene. It has special interest due to its exceptional properties. The optical properties of graphene are related to its unique electronic structure, showing an absorption of 2.3% of incident light, comprising
a wide wavelength range (Nair et al. 2008). Besides this, graphene has photoluminescence that can be used in cellular imaging (Sun et al. 2008). Once again, the bi-dimensional honeycomb-like structure, only a single-atom-thick provides exclusive electronic properties to graphene (Geim et al. 2007). This structure results in the Dirac point, where two bands combine (Chang et al. 2013). As electrons propagate through the carbon grid, they lose their mass completely, causing them to behave as relativistic particles (Chang et al. 2013). The mechanic properties of graphene are also extraordinary, following carbon nanotubes, it is the element with highest elastic modulus and strength (Singh et al. 2011). The perfect graphene single-atom-layer is flawless, causing it to have an intrinsic resistance similar to that of graphite (Singh et al. 2011). In terms of thermal properties, the single-atom-layer of graphene presents the highest thermal conductivity at room temperature (Balandin et al. 2008).
1.4.1.1. Applications
Because of its unique characteristics, graphene is an impressive material (Geim et al. 2007). Its physical and chemical properties increase the interest of scientists around the world and in different areas.
The physical properties of graphene make it an excellent material for applications on electronics and its high carrier mobility has gained greater attention (Avouris et al. 2012). Graphene has been applied in components such as transparent conductive coatings like touch-screen displays, e-paper and organic-emitting diodes (OLEDs) (Novoselov et al. 2012). The electronic products demand for a high transmittance and a low sheet resistance that are present in graphene. Due to his high conductivity, graphene has also been used to develop ultra-thin transistors (Mattevi et al. 2012). Supercapacitors (Liu et al. 2010) are also an area of interest since they are energy store devices that provide high currents. This supercapacitors can be applied for example to power electric cars (Randviir et al. 2014). Another potential application of graphene are photovoltaic cells, or solar cells (Wang et al. 2013). Along with great electronic properties, graphene has particular optical features over an ample wavelength range. Graphene photodetectors are widely studied (Mueller et al. 2010; Xia et al. 2009) and they can be used in a broad range, from ultraviolet to infrared wavelengths (Novoselov et al. 2012).
As a result of an unique bi-dimensional structure, graphene becomes very sensitive to the environment and because of that it is used for sensor applications (Novoselov et al. 2012). Studies have demonstrated the ability to detect a diversity of molecules like gases (Dan et al. 2009; Robinson et al. 2008) and biomolecules (Ohno et al. 2009; Mohanty et al.2008). Graphene’s features make it a potential compound for bio-applications. Single-layered graphene has been the subject of investigation for its possible application on drug and gene delivery. Owing to the large surface area and easy surface functionalization, graphene and its derivate have been considered as a possible choice for multimodal imaging allying cancer photothermal and chemo- and/ or photodynamic therapies (Yang et al. 2015). The first demonstration of the use of graphene oxide for drug delivery was made by Liu and its group in 2008 (Liu et al. 2008). They found that nano-graphene oxide functionalized with polyethylene glycol (PEG), was physiologically stable and that there was no obvious toxicity for the concentrations tested, indicating that nano-graphene oxide alone was not toxic. Nowadays the applications of graphene have extended to many studies in drug delivery, bio-imaging and biosensors (Feng et al. 2013; He et al. 2010; Jung et al. 2010). Furthermore, graphene has also potential to be used in the field of regenerative medicine and tissue engineering (Nayak et al. 2011). Park (2011) and co-workers found that graphene could be used to stimulate the differentiation of human neural stem cells (hNSCs)
in neurons instead of glia. Therefore these studies support the use of graphene as a scaffold for stimulating NSC adhesion and differentiation, and also for neural prosthetics in neural regenerative medicine.
In virtue of its one-atom-thick layer, conductivity and strength, graphene is an excellent support for imaging biomolecules in transmission electron microscopy (TEM) (Nair et al. 1993). Graphene has a very organized and stable structure and these features make it a good support layer.
Graphene-based nanomaterials have also been capturing the attention for environmental purposes (Perreault et al. 2015). These materials have been used as electrodes materials for contaminant monitoring or removal (Zhao et al. 2011; Yan et al. 2014), sorbent or photocatalytic materials for decontamination (Gao et al. 2012) and as new materials for water treatment and desalination membranes (Ning et al. 2012).
In addition to all these properties, graphene has also been referred as the most recent antibacterial agent (Liu et al. 2011). However, its antibacterial effect is still controversial (Hegab et al. 2016), lacking more studies and analysis in this area.
1.4.1.2. Graphene-family nanomaterials
The intense research and the growing development of applications for graphene have led to the production of graphene derivatives, the so-called Graphene-Family Nanomaterials (GFNs). Graphene-derived materials may differ in surface chemistry, layer number, composition, lateral dimension, purity and defect density (Sanchez et al. 2012).
- Bilayer graphene, trilayer graphene: it consists in a stack of 2 or 3 graphene layers that are well-defined (Bianco et al. 2013).
- Few-layer graphene (FLG): it can be defined as stacked graphene sheets, usually 2-5 layers (Bianco et al. 2013).
- Multi-layer graphene: like the above, it’s a bi-dimensional structure with 2 to 10 graphene monolayers stacked and well-visible (Bianco et al. 2013).
- Ultrathin Graphite: it is a material with more than 10 graphene sheets stacked (3-5nm) but less than 100 nm. It is considered a nanomaterial since it has at least one dimension in the nanoscale (1-100nm) (Sanchez et al. 2012).
- Exfoliated Graphite: this definition is based on the manufacturing process. It’s a material produced from a partial exfoliation of graphite, resulting into thin parcels with the original 3D stacking of graphite (Bianco et al. 2013).
- Graphene Nanosheet (GN): it is a single-layer of graphene in suspension or adhered to a substrate (Bianco et al. 2013).
- Graphene Microsheet: it is a material similar to that previously described, but its dimensions range from 100nm to 100µm (Bianco et al. 2013).
- Graphene nanoribbon: it is a single-atom-thick band of carbon atoms where the longer lateral dimension exceed the width by at least one order of magnitude (Bianco et al. 2013).
- Graphene Quantum dots (GQDs): it is a term used to describe few-layered graphene nanosheets in studies about photoluminescence. Its lateral dimensions are <10nm (Bianco et al. 2013).
- Graphene Oxide (GO): it is a graphene monolayer that has a functionalized surface, with an elevated content in oxygen (Sanchez et al. 2012). This material is produced by oxidation and exfoliation of graphene (Bianco et al. 2013).
- Graphite Oxide: it is a solid material resulting from the oxidation of graphite. This material can be used to produced graphene oxide monolayers (Bianco et al. 2013). - Reduced Graphene Oxide (rGO): it is formed by reducing the oxygen content of
graphene oxide (Bianco et al. 2013). This process is applied in order to build up the electrical conductivity and alter other GO properties (Sanchez et al. 2012).
- Nano-GO: normally describes graphene oxide with small lateral dimensions
(20-100nm). Owing to its small size, it can be used for biological applications: it is a stable material and it easily enters the cell (Sanchez et al. 2012).
1.4.1.3. Graphene’s Toxicology
Nanomaterials have been widely used in consumer and industrial products and this situation brings up many questions regarding their interaction with biological systems and consequently, the associated risks. Because of that, a lot of studies have been made, trying to elucidate us about the possible hazards of these materials. One important thing is the fact that the toxicity experiments are prepared and standardized for studies in chemical
products (Kroll et al. 2009). The nanoparticles have a lot of exclusive physicochemical features that may cause some conflicts to the classical toxicity assays (Dhawan et al. 2010). As described above GFNs are emergent materials with applications in many areas. Because of their extensively manufacturing in the last years, the probability of human exposure by inhalation, ingestion, dermal penetration and injection or implantation has dramatically increased (Xia et al. 2009).
Some studies have reported cytotoxicity of GFNs in many bacteria, mammalian cells and animal models. Graphene oxide and reduced-graphene oxide are the most studied graphene’s derivates because of their high solubility/dispersibility/stability in water, when compare to other GFNs (Guo et al. 2014).
Hu and co-workers (2010) showed the antibacterial power of graphene-based paper and that it can be produced with high inhibition ability to bacteria growth. Neural Phaeochromocytoma-derived PC12 cells were used to compare toxicity between graphene and single-wall carbon nanotubes (SWCNTs) (Zhang et al. 2010). In this study was demonstrated that both graphene and SWCNTs induced cytotoxic effects and the effects were dependent of the concentration and the shape of the graphitic material. Exposure to SWCNTs greatly increased the LDH release when compared to graphene, while exposure to graphene induced the generation of ROS and caspase-3 activation indicating apoptosis induction (Zhang et al. 2010). Jaworski et al. (2013) evaluated the toxicity of graphene platelets (GP) on U87 and U118 glioma cells, by analyzing the effect of this nanomaterial on the morphology, viability, membrane integrity and mechanisms of cell death. GP proved to be toxic for glioma cells, but apoptosis was only triggered in U118 cell line. Nevertheless, due to the large surface area of the GP (between 450nm and 1.5µm – not at nanoscale) they were not observed inside the cells. Kunming mice were used to study in
vivo the toxicity of GO with doses of 0.1, 0.25 and 0.4mg/kg for 1 day, 7 days and 30 days,
respectively (Wang et al. 2011). At small concentration (0.1 and 0.25 mg/kg) doses, the GO exposed intravenously, showed no toxicity, however a higher dose (0.4 mg/kg) caused chronic toxicity. Mortality was observed due to obstruction of the major airways as consequence of GO accumulation. Tissue analysis showed lung inflammation and formation of epithelial granulomas. The results also demonstrated accumulation of GO in liver.
Inhalation is one of the major means of exposure to graphene nanomaterials. The inhalation toxicity of graphene nanoplatelets (GNP) and carbon black was analyzed in C57BL/6 mice (Schinwald et al. 2012). Mice were treated by pharyngeal aspiration, intrapleural injection, succeeded by lavaging the lung and pleural space. After exposure with GNP, it was observed an increase in pro-inflammatory cytokines, in contrast with carbon black and control.
The characterization of nanomaterial to be tested is of extreme importance and the size is the most essential parameter; it is crucial for understand the interactions with biological systems (Dhawan et al. 2010). Among the several techniques used to evaluate the nanoparticles sizes, the most frequent are Brunauer-Emmett-Teller (BET), transmission electron microscopy (TEM), scanning electron microscopy (SEM), dynamic light scattering (DLS) and atomic force microscopy (AFM) (Dhawan et al. 2010).
2. Assay techniques and biomarkers to access nanoparticle toxicity
For correct assessment of the risks involved in the production and use of nanomaterials, it is essential to understand their effects on human health and quantify the levels of exposure (Oberdörster et al. 2007). The characteristics of nanoparticles can pose great challenges to the techniques used in toxicology and because of that it is important to have standards procedures, with controlled conditions (Kalantzi et al. 2014).
One of the most important steps for the study of nanoparticle cytotoxicity is the characterization of these nanoparticles. This information will allow to better understanding the interactions between the nanoparticles and the cells. Dynamic light scattering measures the hydrodynamic diameter of the NPs and it is possible to doing it in circumstances that simulate the exposure conditions. The AFM is an instrument that gives information about several properties of NPs: morphology, size, surface texture and roughness.
In vitro assays, using cell cultures, are widely used methods to evaluate the cytotoxicity of
various compounds in cellular systems. The in vitro studies can include methods for measuring the metabolic activity of cells, using colorimetric assays. Other methods like LDH assay provides information about the integrity of the cell membrane. Bioluminescent methods are also used to assess the number of viable cells, with neutral red or TrypanBlue (Kalantzi et al. 2014). The study of cell cycle progression is also a very important method
in the evaluation of cytotoxicity of nanomaterials. These studies allows to understand if the exposure to nanomaterials may or may not interfere with the normal functioning of cell cycle. The production of reactive oxygen species (ROS) is one of the major mechanisms of nanoparticle toxicity and therefore it is essential to evaluate the amount of ROS produced by the cell upon nanomaterials exposure. Another essential parameter to consider in a toxicological assay is the NPs cellular uptake. This will allow the understanding of biological effects that NPs can cause. Cell death is also a parameter that can be analyzed in
in vitro studies.
Toxicologists use in vitro studies always as a first approach instead of in vivo, because they provide faster results, they are less expensive and more convenient and besides that, there are no ethical issues to deal with. However, and because the methods are settled for chemicals, they must be applied with caution considering the physicochemical properties of NPs. It is also fundamental to consider that during the manufacturing process or managing in the laboratory, contaminants may be introduced and so alter the results (Dhawan et al. 2010).
The following sub-sections will describe some of these techniques in more detail:
2.1. Cell viability – WST-8
Cell viability studies are normally performed to understand if a given compound affects cell proliferation or show direct cytotoxic effects that eventually lead to cell death. There are a wide variety of experiments that can be performed to assess the viability of eukaryotic cells. One of the most common is based on tetrazolium compounds, as for instance MTT, MTS, XTT or WST series, that are used for evaluate the metabolic level of the cells (Riss et al. 2004). These assays require the cell incubation with the tetrazolium reagent that will be converted to a colored product that can be detected with a plate reader. The signal is directly proportional to the amount of viable cells in that population (Riss et al. 2004). If the cells are not viable, there is no reduction of the substrate and therefore, no signal is emitted. The signal intensity will depend on many factors such as the concentration, the incubation time, the amount of viable cells and their metabolic activity (Riss et al. 2004).
The MTT [3-(4, 5-dimethyl-2-thiazolyl)-2, 5-diphenyl-2H tetrazolium bromide] assay is one of the most widely used techniques to ascertain cell viability. MTT is reduced mostly
by NADH of metabolically active cells, that convert MTT into an intense purple colored formazan compound, which is water insoluble (Riss et al. 2004), therefore, it has to be solubilized before the absorbance measurement (Tominaga et al. 1999). This further step in the protocol makes it more time-consuming, which can represent a disadvantage. The other tetrazolium reagents, such as MTS, XTT and WST series are soluble in cell culture medium, which makes the assay procedure much more simple (Riss et al. 2004).
In this study it was used the WST-8 [2-(2-methoxy-4-nitrophenyl)-3-(4-nitrophenyl)-5-(2,4-disulfophenyl)-2H-tetrazolium, monosodium salt], which is a very responsive, stable salt and it is easy to synthesize (Ishiyama et al. 1997) (Figure 4). As described by Tominaga et al. (1999), the WST-8 has a higher sensitivity when compare with conventional tetrazolium salts.
Fig. 4. The WST-8 is a highly water-soluble tetrazolium salt that is reduced to an orange-coloured formazan dye in viable cells. The figure shows a 96-well plate
2.2. Cell cycle analysis
The cell cycle is a succession of events in a cell that lead to duplication of all of its elements and to its division in two daughter cells (Dubitzky et al. 2013). The cell cycle is conventionally divided into five phases: G0 (Gap), G1 (First Gap), S Phase (Synthesis Phase), G2 (Second Gap) and M Phase (Mitosis) (Figure 5). G1 is characterized by an intensive biosynthetic activity of proteins, enzymes and RNA followed by a cell growth; S Phase is the synthesis phase during which the DNA is synthesized and replicated; G2 is a period of synthesis of biomolecules necessary to the cellular division that is followed by the mitotic phase (M Phase) (Jayat et al. 1993). Non-proliferating cells enter a quiescent state at G1 that prevents further divisions – the G0 Phase. During the cell cycle, it is required a regulation, to guarantee that all the steps follow the right direction. The cell does this regulation through the cell cycle checkpoints. There are two important checkpoints: the first ensures the right DNA replication (at the G1 to S checkpoint), and the second ensures the successful completion of the early mitoses (at G2 to M checkpoint) (Dubitzky et al. 2013). There’s also a third checkpoint at the M phase and it guarantees that each daughter cell receives a complete copy of the genome (Ciliberto et al. 2009). These checkpoints work through a machinery of complexes of cyclins and cyclin-dependent kinases (Dubitzky et al. 2013).
Flow cytometry is used to analyze various cellular components, organelles and functions, and it is widely used to study the cell cycle by taking DNA content into account (Jayat et al. 1993). The cell cycle analysis allow us to estimate the portion of cells that are in each phase through analytical processes (Dubitzky et al. 2013) (Figure 6).
These studies are carried out with specific DNA dyes and it is accepted that the fluorescence emitted is proportional to DNA content in the cells (Kerker et al. 1982). If the cells are in the G1 phase, the DNA content will be 1x and it will form a peak in the DNA distribution; if cells are in G2 phase, the DNA content will be 2x and it will form a peak in the DNA distribution twice the peak of G1. The cells in the S phase will have an intermediate DNA distribution (Gray et al. 1986).
Flow cytometry gives us information by analyzing cell by cell and so it is possible to do a targeted study, with quantitative information, quick and accurate (Jayat et al. 1993).
2.3. Intracellular ROS detection
Reactive Oxygen Species (ROS) are small, short-lived and highly reactive molecules, formed by incomplete one-electron reduction of oxygen (Scherz-Shouval et al. 2007). This group contains oxygen anions, free radicals, such as superoxide and hydroxyl radical, and peroxides, such as hydrogen peroxide (H2O2) (Scherz-Shouval et al. 2007). ROS are continuously produced under normal conditions as a consequence of aerobic respiration (Eruslanov et al. 2010). They are also involved in enzymatic reactions, mitochondrial electron transport, signal transduction, activation of nuclear transcription factors, gene expression and the antimicrobial action of neutrophils and macrophages (Bayr et al. 2005). However, the generation of reactive oxygen species is an important mechanism of nanotoxicity, inducing oxidative stress in cells (Fu et al. 2014).
Free radical processes are involved in cellular physiology and pathology and therefore it is essential to use a method to quantify the production of ROS in living cells (Jakubowski 2000). The most common techniques use cell permeable fluorescent and chemiluminescent probes. 2’-7’-dichlorodihydrofluorescein diacetate (DCFH-DA) is one of the most widely used probes for measuring the redox state of a cell. DCFH-DA is cell permeable and a non-fluorescent precursor of DCF (2’-7’-dichlorofluorescein) that is used as an intracellular probe (Eruslanov et al. 2010). This probe is very sensitive to changes in the redox state of the cell and can be used to monitor ROS over time (Eruslanov et al. 2010).
After adding DCFH-DA to the cells, it diffuses across the cell membrane and it is hydrolyzed by intracellular esterases, to release DCFH, which reacts with oxidizing species, forming an extremely fluorescent compound, DCF (Rota et al. 1999), that can be detected either by fluorescence microscopy or flow cytometry (Figure 7). The redox state of the sample can be observed by the intensity of the fluorescence emitted (Eruslanov et al. 2010).
2.4. Nanoparticle cell Uptake
The nanoparticles have been the subject of several studies, due to their potential application in the medical field. One of the parameters to be considered is the interaction of these NPs with the cells and how these interactions can influence their uptake. The physical properties of NPs have a fundamental role in their entry into the cell, as well as all the biological environment and the characteristics of the cell membrane itself (Adjei et al. 2014). There are numerous receptor-mediated pathways for the internalization of substances that may occur simultaneously (Figure 8).
Fig. 8. Mechanisms of endocytosis for cell uptake. Fig. 7. Detection of intracellular ROS by flow cytometry.
One of the most common mechanisms for uptake is phagocytosis and it is present in various types of cells (Aderem et al. 1999). In mammals, phagocytosis act as a response of the immune system, engulfing all the unwanted particles in the organism (Silverstein 1995) (Figure 10). Phagocytosis works with the help of vesicles known as phagosomes, which have sizes greater than 250 nm (Rabinovitch 1995). The interaction of the cell receptors with unfamiliar particles can lead to the activation of this process; however, it can also be activated by means of opsonins that can attach the foreign particle and facilitates phagocytosis (Yameen et al. 2014).
Pinocytosis is another mechanism used by cells for the uptake of substances and can be further divided in clathrin-mediated endocytosis, caveolae-mediated endocytosis and macropinocytosis (Yameen et al. 2014) (Figure 10).
Clathrin-mediated endocytosis involves the formation of a clathrin coat around a vesicle (Murugan et al. 2015). The pathway is activated by the signaling of substances and then various proteins start to work on the formation of the vesicle. Clathrin is recruited from the cytosol to form the coat and finally, the vesicle detaches from the cellular membrane and goes to the interior of the cell (Figure 9). Once there, it releases the endocytosed
Fig. 9. Illustration of the mechanism of clathrin-mediated endocytosis (adapted from Murugan et al. 2015).
Caveolae-mediated endocytosis is a mechanism that initially forms a flask-like shape structure with the help of caveolins that bind with the cholesterol present in the cellular membrane (Kumari et al. 2010). The actin present in the cellular membrane is reorganized and dynamin is recruited from the cytosol to form the caveolae structure (Pelkmans et al. 2002) (Figure 10). The internalization of the vesicle is similar to the clathrin-mediated endocytosis.
Macropinocytosis is an independent process that allows the internalization of large volumes of extracellular fluids (Kerr et al. 2009). The actin present in the cellular membrane is polymerized, allowing the formation of protrusions that encapsulates the fluids (Kumari et al. 2010) (Figure 10). These protrusions fuse with the membrane forming macropinosomes (Kerr et al. 2009). The fate of the macropinosomes appears to be different according to the cell type that they are formed; they may enter the endosomal/lysosomal pathway or they can remain isolated within the cell (Kerr et al. 2009).
The uptake of NPs at the cellular level can be assayed by flow cytometry. This technique combines two properties of scattered light laser: the forward-scatter (FS) and the side-scatter (SS) (Figure 11).
Fig. 10. Illustration of caveolae-mediated endocytosis, macropinocytosis and phagocytosis (adapted from Murugan et al. 2015).
The intensity emitted by this two parameters is proportional to the size of cells (FS) and the intracellular density (SS) (Suzuki et al. 2007). In the experiment conducted by Suzuki and co-workers (2007), they concluded that cells which assimilated a larger number of NPs showed a higher SS.
2.5. Apoptosis/ Necrosis
Apoptosis consists of a mechanism of programmed cell death and it is essential during development and in the maintenance of homeostasis (Hollville et al. 2016). When a cell enters apoptosis there are many morphological modifications: cell shrinkage, bebbling of plasma membrane, nuclear chromatin condensation and fragmentation, with maintenance of organellar integrity (Mattson et al. 2012). Biochemical events also occurs like the upregulation of proapoptotic proteins such as Bax and Par-4; the release of cytochrome c; activation of effector caspases; externalization of phosphatidylserine (PS), which serves as a signal for apoptosis recognition (Mattson et al. 2012).
Normally, necrosis occurs as the result of severe insults, such as trauma, cellular energy failure or toxicity (Mattson et al. 2012). In the course of necrosis, the changes that happen are different from apoptosis. The cell swells, the organelles lose their integrity and the nuclear membrane becomes disrupted; this process is also independent of proapoptotic proteins (Mattson et al. 2012).
Apoptosis is usually an individual process, there is no release of cellular contents and the dying cell is engulfed by macrophages; on the other hand, during necrosis, the cell lyses
Fig. 11. Analysis of incorporation of nanoparticles by the flow cytometric light scatter parameter. A) Control, B) Treatment.
Phosphatidylserine is a plasma membrane phospholipid concentrated on the inside (Fadok et al. 1998). When cells enter apoptosis, the plasma membrane lose its phospholipid asymmetry and expose PS on the surface of the membrane, which works as a marker for apoptosis (Fadok et al. 1992). Flow cytometry assays use the fluorochrome-labelled Annexin-V that binds to PS in a calcium-dependent manner (Fadok et al. 1998; Raynal et al. 1994). A vital dye such as propidium iodide (PI) can be combined with Annexin-V, to distinguish between live, apoptotic and necrotic cells, according to differences in membrane permeability (Vermes et al. 1995; Vermes et al. 2000). PI is not permeable to membranes and so, live and apoptotic cells are not stained (Vermes et al. 1995; Vermes et al. 2000; Darzynkiewicz et al. 1992). During late apoptosis or necrosis, the permeability of plasma and nuclear membranes changes and PI enters the cell and intercalates into DNA allowing the identification of the nucleus by emitting its characteristic red fluorescence (Vermes et al. 1995; Vermes et al. 2000; Darzynkiewicz et al. 1992).
3. A549 Cell line
A549 cell line comes from a human lung adenocarcinoma. It was first isolated in 1973 by Giard et al. (1973) from a cancerous lung tissue culture of a 58 years old Caucasian man. During its analysis, these cells showed multilamellar cytoplasmic inclusion bodies, a characteristic of Type II alveolar epithelial cells of the lung (Lieber et al. 1976). These cells are used as a research model on epithelial lung structures and in studies relating to the development of lung cancer (Jiang et al. 2010). In addition, these cells are one of the most applied model for toxicological studies in air pollution (Líbalová et al. 2014).
4. Aims
The lung is the major route of entry of the nanoparticles in the human organism and so, it is important to understand the effects of the graphene nanoparticles on their cells.
The general aim of the present dissertation was to evaluate the cytotoxic potential of graphene nanoplatelets on lung cells.
The specific aims of this work were:
Characterization of the graphene nanoplatelets in terms of their physicochemical properties;
Evaluate the effects of graphene nanoplatelets on the cell viability on the human lung adenocarcinoma cell line (A549);
Evaluate the effects of graphene nanoplatelets on cell cycle progression; Elucidate the type of eventual cell death induced by graphene nanoplatelets; Evaluate the putative ROS induction in A549 cells by graphene nanoplatelets; Assess the nanoparticle uptake by flow cytometry.
5. Material and Methods
5.1. Graphene nanoplatelets
Graphene nanoplatelets (GNPs) were purchased from Sigma-Aldrich® dispersed in H2O (1mg/ml). According to the manufacturer, there is a presence of a few-layer graphene flakes with an average of 5-7 atomic layers.
5.2. Characterization of Graphene Nanoplatelets
The hydrodynamic diameter of GNPs was measured by Dynamic Light Scattering – DLS – and the zeta potential was assessed by electrophoretic mobility, both measurements using a ZetaSizer Nano ZS (Malvern Instruments, UK). This method allows us to measure the hydrodynamic diameter (effective diameter of a particle in a liquid environment) of the particles in suspension in the cell culture medium and Milli-Q water. The concentration used was 10µg/ml and the reads were done at time zero, 2h, 4h and 24h.
5.3. A549 cell line culture
For this study, the human alveolar adenocarcinoma cell line A549 was used as a model. The A549 cell line was cultured in a 25 cm2 flasks (Corning®) with 5ml of Kaighn’s Modification of Ham’s F-12 Medium (F-12K), supplemented with 10% (v/v) Fetal Bovine Serum (FBS) (Gibco), 1% of penicillin-streptomycin (Gibco) and 1% Fungizone (Gibco). The cells were observed every day under the inverted microscope (Nikon®Eclipse TS100) to check if there was no contamination or any other problem with the culture and to understand its growth and confluence (% of cell coverage on the surface area of the culture vessel) state. Subculture was performed every 3-4 days, when cultures reached approximately 70-80% confluence. After removal of the culture medium, cells were washed with 5 ml PBS and incubated with 3 mL Trypsin-EDTA (0.25% trypsin, 1 mM EDTA) for 5 min, to cleave proteins that enable cell adherence to the flask and cell-cell adhesion. After cell detachment from the culture flask, trypsin was inactivated by adding 6 mL supplemented medium to the culture. Cells were harvested, counted using a hemocytometer and seeded in a new flask with complete culture medium. The cultures were maintained at 37 °C in a 5% CO2 humidified atmosphere.
5.4. Graphene Nanoplatelets exposure
Cells were seeded in multiwell plates and incubated for 24h at 37°C, 5% CO2, to adhere. After the incubation period, the medium was taken out and replaced for the same amount of the proper dilutions of GNPs. The time of exposure was normally 24h, with some assays with 4h of exposure.
5.5. Cell viability – Cytotoxicity Assay: WST-8
Cell viability was measured using the WST – 8 assay (Sigma-Aldrich®) by following manufacturer instructions, with some modifications.
Briefly, in a 96 – well plate, one hundred µl of cells were seeded at the concentration of 7x10⁴ cells/ ml and incubated for 24h, at 37°C, 5% CO2 for cells adherence. After that, the culture medium was replaced by 100 µl of GNPs in growth medium at the following concentrations: 5, 10, 25, 50 and 100 µg/ml. Cells cultured in culture medium without GNPs were taken as the control. After 24h exposure, 10 µl of WST – 8 reagent were added to each well. Then, the plate was incubated for 1h at culture conditions and then the absorbance was measured at 450nm in a microplate reader (Biotek® - Gen5™ software). The cell viability was calculated using the equation, where A450 represents the absorbance of the sample read at 450nm:
Relative % viability = A450 sample/ mean A450 control x 100
Some alterations were then performed to this basic protocol (Protocol I) in order to minimize the putative interference of the particles with the assay. The first alteration (Protocol II) included a washing step with PBS (50 µl, for 30 seconds) following the 24h exposure, and then complete culture medium with WST – 8 reagent was added to each well. The plate was then incubated and analyzed as described above. An additional experiment to test the adsorption of the culture medium by GNPs on the toxicity was performed according to the procedure described by Chang et al. (2011) (Protocol III). GNPs samples at 5, 10, 25, 50 and 100 µg/ml were incubated in culture medium (without cells) at 37°C, 5% CO2, for 24h. Then, the GNPs suspensions were centrifuged at 400 rpm for 5 min. The supernatants were then collected and were used to expose the cells as described above. After 24h incubation, cell viability was assessed with the WST-8 assay. For this assay it was used a background control for each concentration and a blank.
5.6. Flow cytometric analysis of Cell Cycle
Cell cycle distribution was analyzed according to the method previously described by Oliveira et al. (2014). Briefly, cells were seeded in 6 well plates each receiving 2 ml of suspended cells at the concentration of 1x10⁵ cells/ml. They were allowed 24 hours to adhere and grow in the incubator before being exposed to GNPs at 5, 50, 100 µg/ml and the control. Each assay concentration consisted of three technical replicates. This was followed by an incubation time of 24h. Afterwards the media was removed and the cells were washed with PBS, trypsinized and ressuspended in media. The suspensions were collected to microtubes and centrifuged at 300g for 5 min. The supernatant was discarded and the cells were washed in PBS and finally ressuspended in 1 ml of cold ethanol 85% and then they were stored at -20°C until analysis.
At the time of analysis, cells were centrifuged at 300g for 5 min at 4°C. Next, the supernatant was discarded and the cells were ressuspended in 800 µl of PBS. After this, the suspension was filtered through a 55 µm nylon mesh to remove possible clusters. Subsequently, 50 µl of RNAse (Sigma-Aldrich®, USA) and 50 µl of PI (Fluka, USA) were added. This step ensures RNA elimination by RNAse and DNA staining by PI. This mixture was left in the tubes in the dark for 15 min and then read in the flow cytometer. To measure the fluorescence intensity, samples were analyzed with flow cytometer Coulter EPICS XL (Beckman Coulter Inc., Brea, CA, USA) and Attune® Acoustic Focusing Cytometer (Applied Biosystems). The number of events reached approximately 5000, for each sample. The data were analyzed by FlowJo software (FlowJo LLC, Ashland, OR, USA).
5.7. Intracellular ROS detection assay
For the measurement of the Reactive Oxygen Species (ROS), probe 2’, 7’-dichlorofluorescin diacetate (DCFH2-DA) (Sigma-Aldrich®) was used.
Cells were seeded in 6-well plates at the concentration of 1x10⁵ cells/ml and were allowed to adhere for 24h. Then cells were exposed to GNPs at the concentration of 5, 50 and 100 µg/ml, for 24h. After that, cells were washed with PBS and incubated for 30 min at 37°C in the dark with serum-free F12K medium with 10µM of DCFH2-DA. Cells were then washed with PBS, trypsinized and collected for analysis in the flow cytometer. The samples were analyzed with flow cytometer Coulter EPICS XL (Beckman Coulter Inc.,
Brea, CA, USA) and Attune® Acoustic Focusing Cytometer (Applied Biosystems). The data were analyzed by FlowJo software (FlowJo LLC, Ashland, OR, USA).
5.8. Uptake Potential of nanoparticles
The uptake potential of GNPs by A549 was analyzed by flow cytometry as previously described by Bastos et al. (2016).
Briefly, cells were seeded in 6-well plates at 1x10⁵ cells/ml and allowed to adhere for 24h. Cells were then exposed to GNPs at 5 µg/ml, 50 µg/ml and 100 µg/ml and the control were exposed to culture medium for 4 and 24h in three different sets.
The first set was incubated for 4h at 37°C; the second set was incubated for 4h at 4°C (for endocytosis inhibition study) and the third was incubated for 24h at 37°C. After the incubation period, the cells were trypsinized, ressuspended and collected for flow cytometry analysis. Cytometry was performed using the Attune® Acoustic Focusing Cytometer (Applied Biosystems). The data were analyzed by FlowJo software (FlowJo LLC, Ashland, OR, USA).
5.9. Apoptosis/ Necrosis assay – Annexin V/PI
Apoptosis was measured by flow cytometry, using the FITC Annexin V Apoptosis Detection Kit, from BD Pharmingen™ (BD Pharmingen, San Diego, CA, USA), by double staining with Annexin V and PI. This double staining gives us the differentiation between early-stage apoptotic cells (Annexin V-FITC (+)/PI(-) cells), from late-stage apoptotic/necrotic cells (Annexin V-FITC (+)/PI (+)) and live cells (Annexin V-FITC (-)/PI (-)).
Cells were seeded in 6-well plates, at concentrations of 1x10⁵ cells/ml and incubated for 24h to allow adherence. Then, cells were exposed to the highest concentration of GNPs (in this case, 100 µg/ml). Plates were incubated for 24h at 37°C, 5% CO2.
After exposure, cells were trypsinized and transferred to microtubes. Subsequently, cells were washed twice in cold PBS and ressuspended (1x10⁶ cells) in 1x Binding Buffer
Solution. Following this, 100µl of each cell suspension was transferred to microtubes and
incubated for 15 min in the dark with 5µl of PI and 5µl of Annexin V. Then, 400µl of 1x
For each sample 10000 cells were analysed and the percentages were calculated from the number of cells in each quadrant divided by the total number of cells. For the measurements it was used the Attune® Acoustic Focusing Cytometer (Applied Biosystems) and data were analyzed by FlowJo software (FlowJo LLC, Ashland, OR, USA).
5.10. Statistical Analysis
At least 3 replicates, and two independent assays were performed for all experiments. Data analysis was performed using the software SigmaPlot version 12.0, by one-way ANOVA analysis of variance (One-way ANOVA) (p <0.05), followed by a Holm-Sidak test (p < 0.05) to evaluate the significance of differences in the parameters.