ADIPOSE TISSUE IN ATTENUATION AND SCATTERING
CORRECTION IN MYOCARDIAL PERFUSION SPECT/CT:
A PHANTOM STUDY
B. Guerreiro1*, P. Pereira1*, R. Rosa1*, S. Valente1,2, E. Sousa3, P. Almeida2,4,F. Branco1,2, T. Freixo2, F. D. Jonge2, T. C. Ferreira2, L. Vieira3,4 * Contributed equally to this research
(1) Escola Superior de Tecnologia e Saúde de Lisboa, Instituto politécnico de Lisboa, Lisboa, PORTUGAL (2) Hospital Lusíadas, Departamento de Medicina Nuclear Lisboa, PORTUGAL
(3) GIReS- Escola Superior de Tecnologia e Saúde de Lisboa, Instituto politécnico de Lisboa, Lisboa, PORTUGAL
(4) Instituto de Biofísica e Engenharia Biomédica, Faculdade de Ciências, Universidade de Lisboa, Lisboa, PORTUGAL
1. BACKGROUND
Risk stratification of coronary arterial disease (CAD) + therapeutic approach decision
Limitations
Both influenced by adipose tissue (AT)
3
Myocardial Perfusion Imaging (MPI)
Attenuation Artifacts
Compton Scattering Artifacts
Corrected by
computed tomography (CT)
Dual or Triple energy window method
Corrected by
(DEW and TEW)
Assess the Influence of thoracic AT on cardiac SPECT/CT counts,
after attenuation correction(AC) and scatter correction (SC)
1. Background
| 2. Methods | 3. Results and Discussion | 4. Conclusion | 5. Bibliographic References
Figueiredo SRR, Avaliação da viabilidade miocárdia pós-enfarte. 2013
Russell RR et al., Nuclear Cardiology: Present and Future. Curr Probl Cardiol, 2006
Stakhiv et al., Influence of Computed Tomography Attenuation Correction in Myocardial Perfusion Imaging : In Obese
Population, 2015
2. METHODS
Used phantoms:
• Anthropomorphic thorax tissue equivalent
(RSD, Heart/ Thorax for Cardiac SPETC/PET, Alderson Phantom)
• Torso (approx. thickness = 35 millimetres, mm)
(RSD, Thorax Overlay phantom)
• Lung
• Liver
• Heart
2.1. Materials and Methods
4
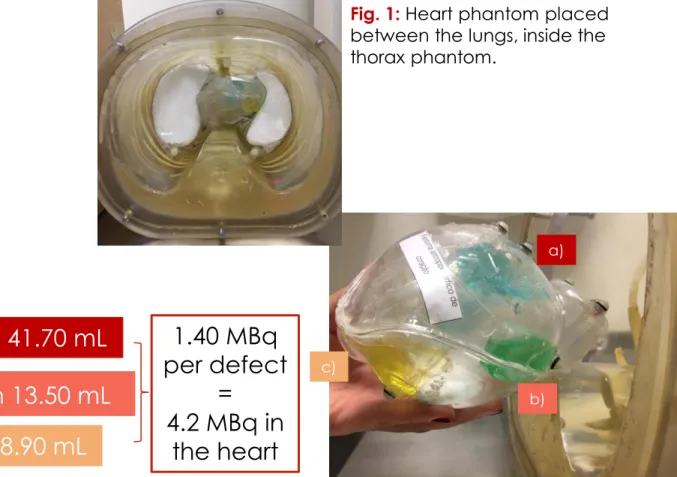
a) superior: 3.36x10
-2MBq/mL in 41.70 mL
b) medial :
1.037x10
-1MBq/mL in 13.50 mL
c) inferior: 1.573x10
-1MBq/mL in 8.90 mL
3 defects
filled with
99mTc
Fig. 1: Heart phantom placed
between the lungs, inside the
thorax phantom.
1. Background |
2. Methods
| 3. Results and Discussion | 4. Conclusion | 5. Bibliographic References
a)
b) c)
Fig. 2: Heart phantom with the
superior (a), medial (b) and inferior (c)
defects.
1.40 MBq
per defect
=
4.2 MBq in
the heart
2. METHODS
Acquisitions:
5
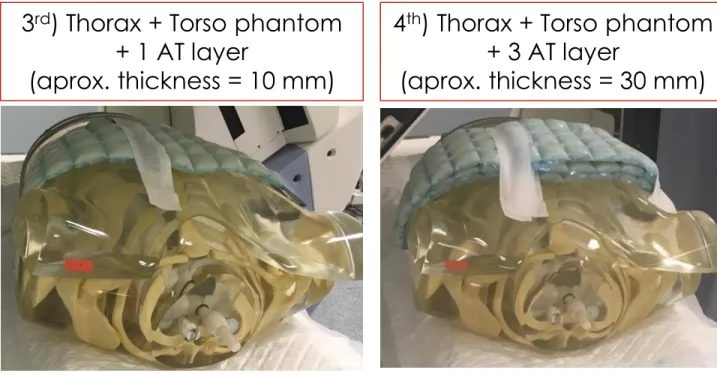
Fig. 6: Thorax and torso phantom
with three layers of AT.
1. Background |
2. Methods
| 3. Results and Discussion | 4. Conclusion | 5. Bibliographic References
Fig. 3: Thorax phantom.
Fig. 4: Thorax and torso
phantoms.
1
st) Thorax phantom
2
nd) Thorax + Torso phantom
3
rd) Thorax + Torso phantom
+ 1 AT layer
(aprox. thickness = 10 mm)
4
th) Thorax + Torso phantom
+ 3 AT layer
(aprox. thickness = 30 mm)
Fig. 5: Thorax and torso phantom with
one layer of AT.
2.2. Image Acquisition Parameters
Gamma Camera:
Infinia Hawkeye 4, General Electrics Healthcare
2 detectors and Xeleris workstation
6
Parameters
CT
SPECT
2. METHODS
1. Background |
2. Methods
| 3. Results and Discussion | 4. Conclusion | 5. Bibliographic References
•
Slice thickness: 5 mm;
•
2.5 milliAmp;
•
2.0 rotations per minute;
•
140 kiloVolt;
•
Standard filter;
•
Matrix: 256x256;
•
Pixel size:1.66 mm.
•
Collimators: Low energy high resolution (LEHR) in L mode
•
Step and shoot mode: 180º, increase of 3º, right anterior oblique
(RAO) Left posterior oblique (LPO)
•
Time per projection: 25 to 44 sec (cf. Table 1)
•
99mTc photopeak = 140 keV ; ±7.5% window
•
Compton scatter photopeak = 120 keV; ±5% window
•
Matrix: 64x64
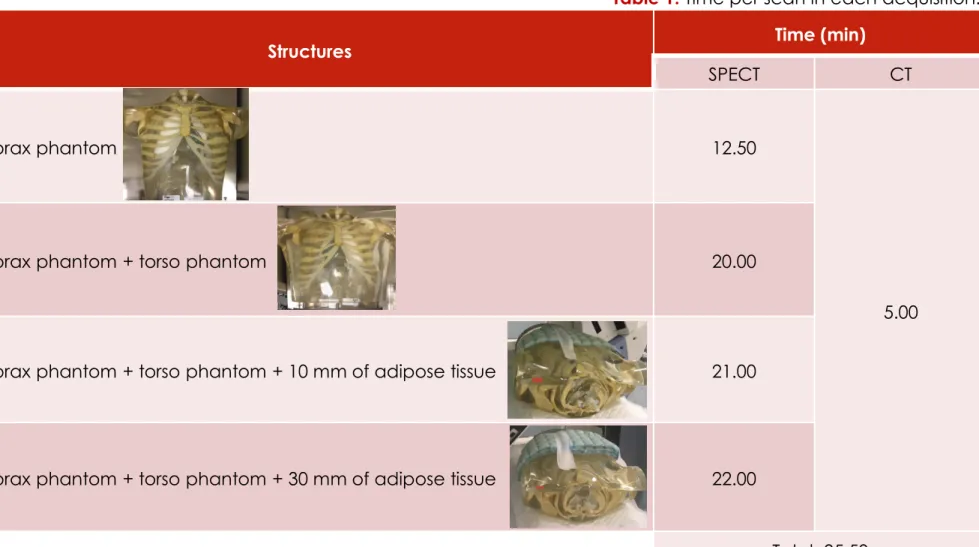
Acquisition
Structures
Time (min)
SPECT
CT
1
stThorax phantom
12.50
5.00
2
ndThorax phantom + torso phantom
20.00
3
rdThorax phantom + torso phantom + 10 mm of adipose tissue
21.00
4
thThorax phantom + torso phantom + 30 mm of adipose tissue
22.00
Total: 95.50
7
Table 1: Time per scan in each acquisition.
2. METHODS
1. Background |
2. Methods
| 3. Results and Discussion | 4. Conclusion | 5. Bibliographic References
8
The scans were reconstructed using:
1) Filtered Back Projection (FBP):
Butterworth Filter
Slice Frequency = 0.48 cycles/pixel
Order = 10
2) Ordered Subset Expectation Maximization
(OSEM) + Resolution Recovery (RR)
Slice Frequency = 0.48 cycles per pixel
2.1.) OSEM RR;
2.2.) OSEM RR AC;
2.3.) OSEM RR AC SC.
Load to New:
3 frames with the most uptake per each defect
Circular regions of interest (ROI) per heart phantom regions
(area = 10 pixel)
Total counts, min, max, average and standard deviation (per ROI)
2. METHODS
1. Background |
2. Methods
| 3. Results and Discussion | 4. Conclusion | 5. Bibliographic References
2.3. Image Reconstruction and
Analysis
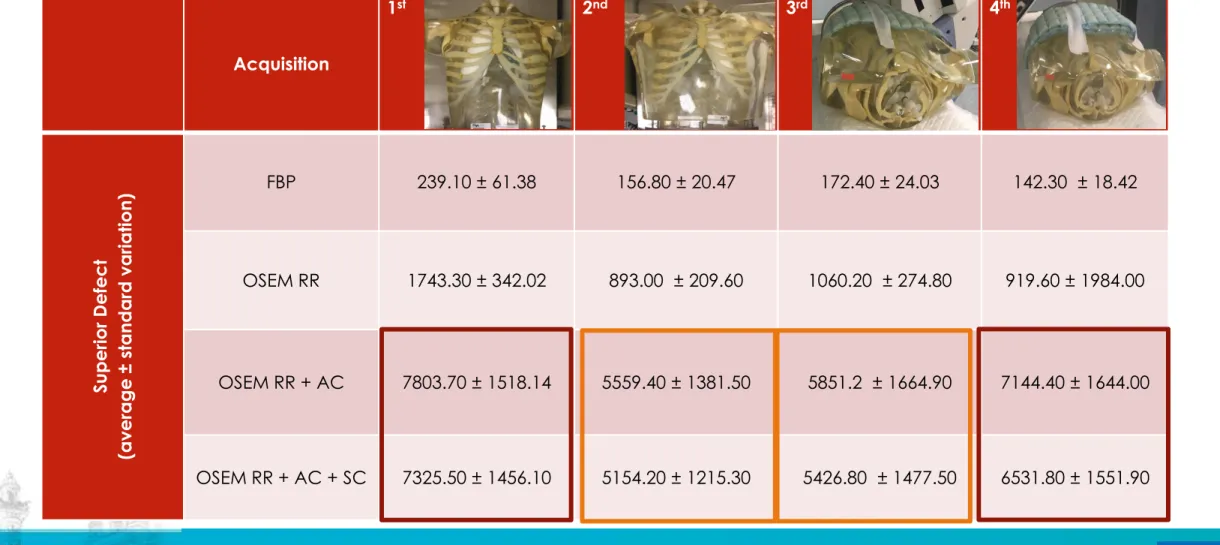
Acquisition
1
st2
nd3
rd4
thSuperior Defect
(average
±
standard variation)
FBP
239.10 ± 61.38
156.80 ± 20.47
172.40 ± 24.03
142.30 ± 18.42
OSEM RR
1743.30 ± 342.02
893.00 ± 209.60
1060.20 ± 274.80
919.60 ± 1984.00
OSEM RR + AC
7803.70 ± 1518.14
5559.40 ± 1381.50
5851.2 ± 1664.90
7144.40 ± 1644.00
OSEM RR + AC + SC
7325.50 ± 1456.10
5154.20 ± 1215.30
5426.80 ± 1477.50
6531.80 ± 1551.90
9Table 2: Average counts per pixel area and standard deviation, for the superior defect of the heart phantom, for all datasets
with four types of reconstruction.
3. RESULTS AND
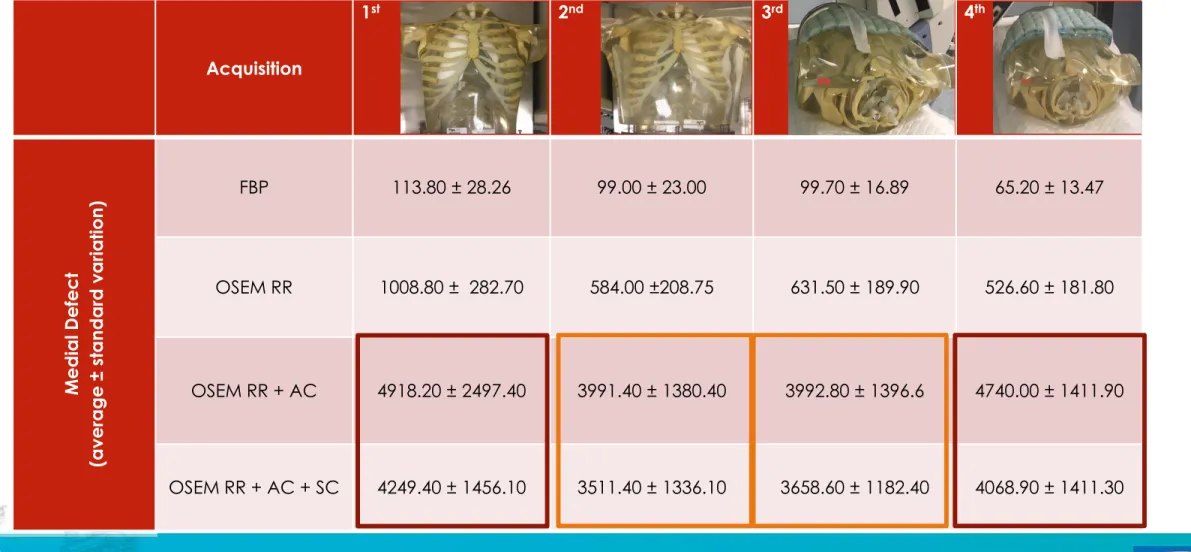
Acquisition
1
st2
nd3
rd4
thMedial
Defect
(average
±
standard variation)
FBP
113.80 ± 28.26
99.00 ± 23.00
99.70 ± 16.89
65.20 ± 13.47
OSEM RR
1008.80 ± 282.70
584.00 ±208.75
631.50 ± 189.90
526.60 ± 181.80
OSEM RR + AC
4918.20 ± 2497.40
3991.40 ± 1380.40
3992.80 ± 1396.6
4740.00 ± 1411.90
OSEM RR + AC + SC
4249.40 ± 1456.10
3511.40 ± 1336.10
3658.60 ± 1182.40
4068.90 ± 1411.30
10Table 3: Average counts per pixel area and standard deviation, for the medial defect of the heart phantom, for all datasets
with four types of reconstruction.
3. RESULTS AND
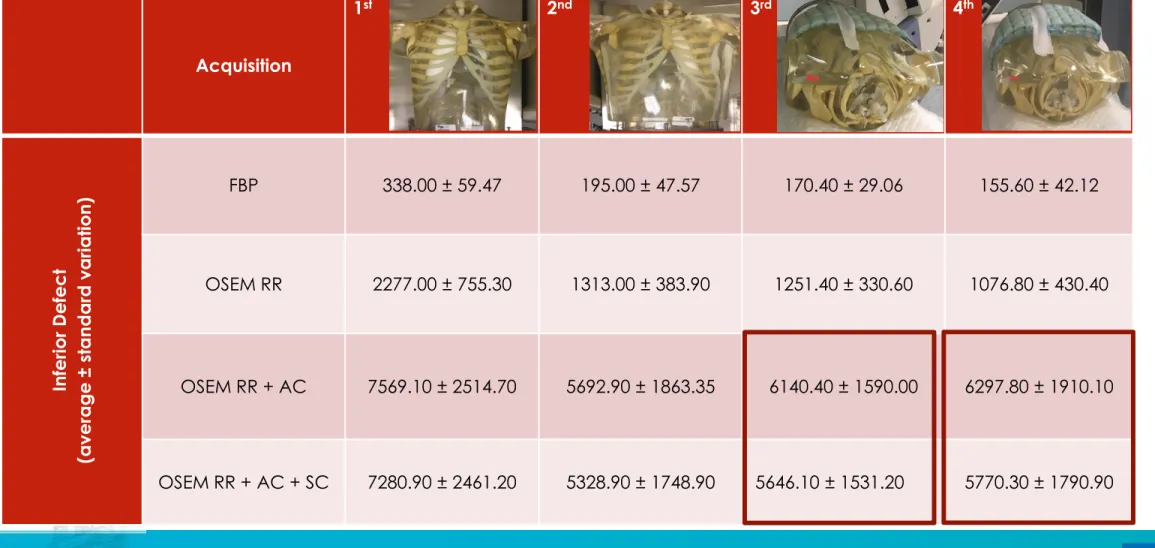
Acquisition
1
st2
nd3
rd4
thInferior De
fect
(average
±
standard variation)
FBP
338.00 ± 59.47
195.00 ± 47.57
170.40 ± 29.06
155.60 ± 42.12
OSEM RR
2277.00 ± 755.30
1313.00 ± 383.90
1251.40 ± 330.60
1076.80 ± 430.40
OSEM RR + AC
7569.10 ± 2514.70
5692.90 ± 1863.35
6140.40 ± 1590.00
6297.80 ± 1910.10
OSEM RR + AC + SC
7280.90 ± 2461.20
5328.90 ± 1748.90
5646.10 ± 1531.20
5770.30 ± 1790.90
11Table 4: Average counts per pixel area and standard deviation, for the inferior defect of the heart phantom, for all datasets
with four types of reconstruction.
3. RESULTS AND
12
Evaluation of the influence of AT thickness on the counts rate
after AC and SC
30. Tamam M, Mulazimoglu M, Edis N, Ozpacaci T. The Value of Attenuation Correction in Hybrid Cardiac SPECT/CT on Inferior Wall According to Body Mass Index. World J Nucl Med [Internet]. 2016 [cited 2017 Jun 13];15(1):18–23. Available from: http://www.ncbi.nlm.nih.gov/pubmed/26912974
31. Saffar MH, Oloomi S, Knoll P, Taleshi H. A new approach to scatter correction in SPECT images based on Klein _ Nishina equation. 2013;21(1):19–25.
4. CONCLUSION
1. Background | 2. Methods | 3. Results and Discussion |
4. Conclusion
| 5. Bibliographic References
AC and SC effects are more notorious in bigger AT thicknesses.
The counts were almost totally recovered after AC and SC for the acquisition with the biggest
AT thickness
THANK YOU!
1. Figueiredo SRR. Avaliação da viabilidade miocárdia pós-enfarte. 2013;
2. Slart RHJ a, Bax JJ, van Veldhuisen DJ, van der Wall EE, Dierckx R a JO, Jager PL. Imaging Techniques in Nuclear Cardiology for the Assessment of Myocardial Viability. Int J Cardiovasc Imaging [Internet]. 2006 Feb 13;22(1):63–80.
3. Russell RR, Zaret BL. Nuclear Cardiology: Present and Future. Curr Probl Cardiol [Internet]. 2006 Sep;31(9):557–629.
4. Verberne HJ, Acampa W, Anagnostopoulos C, Ballinger J, Bengel F, De Bondt P, et al. EANM procedural guidelines for radionuclide myocardial perfusion imaging with SPECT and SPECT/CT: 2015 revision. Eur J Nucl Med Mol Imaging. 2015;42(12):1929–40.
5. Patton J a, Turkington TG. SPECT/CT physical principles and attenuation correction. J Nucl Med Technol. 2008;36(1):1–10.
6. Dvorak R a., Brown RKJ, Corbett JR. Interpretation of SPECT/CT Myocardial Perfusion Images: Common Artifacts and Quality Control Techniques. RadioGraphics. 2011 Nov;31(7):2041–57.
7. Kalender WA. Computed Tomography: Fundamentals, System Technology, Image Quality Applications. 3rd ed. Germany: Publicis Publishing; 2011.
8. Garcia E V., Esteves FP. Attenuation corrected myocardial perfusion SPECT provides powerful risk stratification in patients with coronary artery disease. J Nucl Cardiol [Internet]. 2009 Aug 3;16(4):490–2.
9. Raza H, Jadoon LK, Mushtaq S, Jabeen A, Maqbool M, Ain MU, et al. Comparison of non-attenuation corrected and attenuation corrected myocardial perfusion SPECT. Egypt J Radiol Nucl Med [Internet]. 2016 Sep;47(3):783–92.
10. Shawgi M, Tonge C, Lawson R. Attenuation correction of myocardial perfusion SPET in patients of normal body mass index. Hell J Nucl Med [Internet]. 2012;(November):215–9. Available from: http://europepmc.org/abstract/MED/23227459
11. Body Mass Index: Obesity and Overweight [Internet]. World Health Organization. 2016. 12. O. Stakhiv, I. Melo, M. Clarke, M. Aplin, N. Singh, K. Day, S. Dizdarevic, M. Jessop, P.
Begley, E. Carolino, L. Vieira ES. INFLUENCE OF COMPUTED TOMOGRAPHY ATTENUATION CORRECTION IN MYOCARDIAL PERFUSION IMAGING, IN OBESE PATIENTS: CLASSIFICATION BY SEX AND BODY MASS INDEX. In: Maria Amélia Loja (IDMEC, ISEL/GIMOSM), Joaquim Infante Barbosa (IDMEC, ISEL/GIMOSM) JAR (ISEL/GIMOSM), editor. 3rd International Conference on Numerical and Symbolic Computation - Proceedings. Guimarães; 2017. p. 283–92.
13. Raza H, Jadoon LK, Mushtaq S, Jabeen A, Maqbool M, Ain MU, et al. Comparison of non-attenuation corrected and attenuation corrected myocardial perfusion SPECT. Egypt J Radiol Nucl Med. 2016 Sep;47(3):783–92.
14. Melo I, Begley P, Stakhiv O, Carolino E, Jessop M, Dizdarevic S, et al. Myocardial Perfusion Imaging in Obese Subjects : Influence of Adipose Tissue in Attenuation Correction with Computed Tomography. [Lisbon]: Lisbon School of Health Technology; 2015.
15. Pazhenkottil AP, Ghadri J-R, Nkoulou RN, Wolfrum M, Buechel RR, Küest SM, et al. Improved outcome prediction by SPECT myocardial perfusion imaging after CT attenuation correction. J Nucl Med. 2011 Feb;52(2):196–200.
16. Thompson RC, Heller G V., Johnson LL, Case JA, Cullom SJ, Garcia E V., et al. Value of attenuation correction on ECG-gated SPECT myocardial perfusion imaging related to body mass index. J Nucl Cardiol. 2005;12(2):195–202.
14
1. Background | 2. Methods | 3. Results and Discussion | 4. Conclusion |
5. Bibliographic References
5. BIBLIOGRAPHIC
REFERENCES
17. Ogawa K. Image distortion and correction in single photon emission CT. Ann Nucl Med. 2004;18(3):171–85.
18. Msaki P, Axelsson B, Dahl CM, Larsson SA. Generalized scatter correction method in SPECT using point scatter distribution functions. J Nucl Med. 1987 Dec;28(12):1861–9. 19. Laurette I, Zeng GL, Welch A, Beekman FJ, Kamphuis C, Frey EC, et al. Review and
current status of SPECT scatter correction. Phys Med Biol Phys Med Biol. 2011;56(56):85– 112.
20. Buvat I, De Sousa MC, Di Paola M, Ricard M, Lumbroso J, Aubert B. Impact of scatter correction in planar scintimammography: a phantom study. J Nucl Med. 1998 Sep;39(9):1590–6.
21. Xiao J, de Wit TC, Staelens SG, Beekman FJ. Evaluation of 3D Monte Carlo-based scatter correction for 99mTc cardiac perfusion SPECT. J Nucl Med. 2006 Oct;47(10):1662–9. 22. Narayanan MV, Pretorius PH, Dahlberg ST, Leppo JA, Botkin N, Krasnow J, et al.
Evaluation of scatter compensation strategies and their impact on human detection performance tc-99m myocardial perfusion imaging. IEEE Trans Nucl Sci. 2003 Oct;50(5):1522–7.
23. El Fakhri G, Buvat I, Benali H, Todd-Pokropek A, Di Paola R. Relative impact of scatter, collimator response, attenuation, and finite spatial resolution corrections in cardiac SPECT. J Nucl Med. 2000 Aug;41(8):1400–8.
24. Radiology Support Devices | Heart/Thorax for Cardiac SPECT/PET.
25. Platts EA, North TL, Pickett RD, Kelly JD. Mechanism of uptake of technetium-tetrofosmin. I: Uptake into isolated adult rat ventricular myocytes and subcellular localization. J Nucl Cardiol [Internet]. [cited 2017 Jun 12];2(4):317–26.
26. Darcourt J, Booij J, Tatsch K, Varrone A, Walker Z, Laere K Van. EANM procedure guidelines for brain neurotransmission SPECT using 123 I-labelled dopamine transporter ligands , version 2. 2009.
27. Oliveira ML, Seren MEG, Rocha FC, Brunetto SQ, Ramos CD, Button VLSN. Attenuation correction effects on SPECT/CT procedures: Phantoms studies. Proc Annu Int Conf IEEE Eng Med Biol Soc EMBS. 2013;2324–7.
28. Links JM, DePuey EG, Taillefer R, Becker LC. Attenuation correction and gating synergistically improve the diagnostic accuracy of myocardial perfusion SPECT. J Nucl Cardiol. 9(2):183–7.
29. R H. Attenuation correction eternal dilemma or real improvement. J Nucl Med Mol Imaging. 2005;49(1):30–42.
30. Tamam M, Mulazimoglu M, Edis N, Ozpacaci T. The Value of Attenuation Correction in Hybrid Cardiac SPECT/CT on Inferior Wall According to Body Mass Index. World J Nucl Med [Internet]. 2016 [cited 2017 Jun 13];15(1):18–23.
31. Saffar MH, Oloomi S, Knoll P, Taleshi H. A new approach to scatter correction in SPECT images based on Klein _ Nishina equation. 2013;21(1):19–25.
32. Blokland KJ a K, de Vos tot Nederveen Cappel WH, van Eck-Smit BLF, Pauwels EKJ. Scatter correction on its own increases image contrast in Tl-201 myocardium perfusion scintigraphy, but does it also improve diagnostic accuracy? Ann Nucl Med. 2003;17(8):725–31.
33. Pourmoghaddas A, Vanderwerf K, Ruddy TD, Glenn Wells R. Scatter correction improves concordance in SPECT MPI with a dedicated cardiac SPECT solid-state camera. J Nucl Cardiol. 2015 Apr;22(2):334–43.
15