Direct Comparison of Cardiovascular Magnetic
Resonance and Single-Photon Emission Computed
Tomography for Detection of Coronary Artery Disease: A
Meta-Analysis
Lihua Chen1", Xiao Wang2", Jing Bao3
, Chengjun Geng1, Yunbao Xia1*, Jian Wang4*
1Department of Radiology, Taihu Hospital, Wuxi, Jiangsu Province, China,2Department of Cardiology, Taihu Hospital, Wuxi, Jiangsu Province, China,3Molecular biology lab, Wuxi center for disease control and prevention, Wuxi, Jiangsu Province, China,4Department of Radiology, Southwest Hospital, Third Military Medical University, Chongqing, China
Abstract
Objective:To use direct comparative studies or randomised controlled trials to compare the accuracy of cardiac magnetic resonance (CMR) and single-photon emission computed tomography (SPECT) for the detection of obstructive coronary artery disease (CAD).
Materials and Methods:Various databases were searched for original articles published prior to June 2013. Studies were selected that performed both CMR and SPECT in the same or randomised patients to detect CAD and that presented sufficient data to allow construction of contingency tables. For each study, the true-positive, false-positive, true-negative, and false-negative values were extracted or derived, and 262 contingency tables were constructed. To reduce heterogeneity, the meta-analysis was carried out in two parts: (1) coronary territory-based analysis and (2) patient-based analysis.
Results:10 studies (5 studies based on patient, 4 studies based on coronary territory, and 1 study based on both) were included in the meta-analysis with a total of 1727 patients. The methodological quality was moderate. For part (1), the summary estimates were as follows: for CMR based on patient–a sensitivity of 0.79 (95% confidence interval: 0.72–0.84) and a specificity of 0.75 (0.65–0.83); for SPECT based on patient–a sensitivity of 0.70 (0.59–0.79) and a specificity of 0.76 (0.66– 0.83). For part (2), the summary estimates for CMR based on coronary territory were a sensitivity of 0.80 (0.73–0.85) and a specificity of 0.87 (0.81–0.91), and the summary estimates for SPECT based on coronary territory were a sensitivity of 0.67 (0.60–0.72) and a specificity of 0.80 (0.75–0.84).
Conclusions:Compared with SPECT, CMR is more sensitive to detect CAD on a per-patient basis. Nonetheless, large scale, well-designed trials are necessary to assess its clinical value on a per-coronary territory basis.
Citation:Chen L, Wang X, Bao J, Geng C, Xia Y, et al. (2014) Direct Comparison of Cardiovascular Magnetic Resonance and Single-Photon Emission Computed
Tomography for Detection of Coronary Artery Disease: A Meta-Analysis. PLoS ONE 9(2): e88402. doi:10.1371/journal.pone.0088402
Editor:Vincenzo Lionetti, Scuola Superiore Sant’Anna, Italy
ReceivedNovember 26, 2013;AcceptedJanuary 5, 2014;PublishedFebruary 10, 2014
Copyright:ß2014 Chen et al. This is an open-access article distributed under the terms of the Creative Commons Attribution License, which permits
unrestricted use, distribution, and reproduction in any medium, provided the original author and source are credited.
Funding:The authors have no support or funding to report.
Competing Interests:The authors have declared that no competing interests exist.
* E-mail: [email protected] (YX); [email protected] (JW)
"LC and XW are co-first authors on this work.
Introduction
Coronary artery disease (CAD) is the leading cause of death in industrialized countries, and the prevalence is expected to increase worldwide [1]. The management of patients with known or suspected CAD is ideally guided by documentation of myocardial ischaemia for optimal medical therapy [2,3].
Compared with invasive coronary angiography (CA), various noninvasive functional imaging techniques with a low rate of cardiac events such as single-photon emission tomography (SPECT), cardiac magnetic resonance (CMR), or positron emission tomography (PET) perfusion imaging are used to diagnose coronary heart disease and assess the need for
revascularisation [4,5]. In these techniques, SPECT has been widely used to evaluate myocardial ischemia. However, it exposes patients to ionising radiation, and estimates of its accuracy vary widely [6]. An increasing number of cardiac magnetic resonance (CMR) studies documented a high diagnostic performance of obstructive CAD and showed its prognostic value. Compared with SPECT, it has some advantages, such as the lack of ionising radiation, high spatial resolution, and its ability to assess multiple aspects of heart [7].
findings of these studies have been largely inconsistent. Therefore, we conducted a meta-analysis of the literature to estimate the accuracy of CMR compared with SPECT for the detection CAD. To obtain the best evidence of the diagnostic accuracy of these two methods, we restricted the scope of the meta-analysis to direct comparative studies or randomised controlled trials.
Materials and Methods
Criteria for Inclusion in the Study
We aimed to include studies published in any language. However, we eliminated non-English and non-Chinese articles for which a full-text translation or evaluation could not be obtained. For the detection of CAD, studies were eligible if the following criteria were met:
1. Adult patients were CAD or suspected of having CAD. 2. Both CMR and SPECT were evaluated in the same patient
population (direct comparison) against an acceptable reference standard (as defined later), or patients were randomised within a study to receive either CMR or SPECT.
3. Invasive coronary angiography was the reference standard.
4. The data reported in the primary studies were sufficient for the calculation of true-positive, false-positive, true-negative, or false-negative values.
We included both prospective and retrospective studies. We excluded studies if there were fewer than 20 patients and if multiple reports were published for the same study population. In the latter case, the most detailed or recent publication was chosen.
Data Sources
PUBMED, EMBASE, Web of Science, and the Cochrane Library were searched independently by two observers. The search strategy included both subject headings (MeSH terms) and keywords for the target condition (coronary artery disease) and the imaging techniques under investigation (CMR and SPECT). We also included a methodological filter for studies of diagnostic accuracy. We limited our search to publications with the search term in the title or abstract of the article and a publication date no later than June 2013. Review articles, letters, comments, case reports, and unpublished articles were excluded. Extensive cross-checking of the reference lists of all retrieved articles was performed.
Selection of Articles
Two authors initially screened the titles and abstracts of the search results and retrieved all potentially relevant reports in full. Next, they independently reviewed all relevant reports according to the predefined inclusion criteria. Disagreements were resolved by consensus or arbitration by a third author who assessed all of the involved items. The majority opinion was used for the analysis.
Quality Assessment and Data Extraction
The same three authors extracted data from the selected reports. The methodological quality of the included studies was assessed independently by two observers using the quality assessment of diagnostic studies (QUADAS-2) tool, which was specifically developed for systematic reviews of diagnostic accuracy studies [18–20]. Meanwhile, the relevant data were also extracted from each study, including the author, journal name, study nation, year of publication, description of the study population, study design characteristics, magnetic field strength, type of pulse sequences, type of SPECT, and descriptions of the interpretations of the diagnostic tests.
Meta-analysis
For each study, the positive (TP), false-positive (FP), true-negative (TN), false-true-negative (FN), sensitivity (SEN), specificity (SPE), positive likelihood ratio (PLR), negative likelihood ratio (NLR) and diagnostic odds ratio (DOR) values for the detection of lesions were extracted or derived, and 262 contingency tables were constructed. We calculated the sensitivity and specificity with 95% confidence intervals (CI) for each imaging test in each study. We tabulated results for studies based on per-patient separately from those for studies based on per-coronary territory. We drew forest plots to show the variation of SEN and SPE estimates together with their 95% CI. We constructed hierarchical summary receiver operating characteristic (HSROC) curves to assess SEN and SPE [21].
Exploring heterogeneity is critical for understanding the factors that influence accuracy estimates and for evaluating the appro-priateness of the statistical pooling of accuracy estimates from various studies. Visual inspection of the forest plots, standardx 2-testing, and the inconsistency index (I-squared, I2) were used to estimate the heterogeneity of the individual studies using Stata software (Stata Corporation, College Station, TX, USA). P,0.1 or I2.50% suggested notable heterogeneity [22]. If notable hetero-geneities were detected, the test performance was summarised using a random-effects coefficient binary regression model; otherwise, a fixed-effects coefficient binary regression model was used [23].
There are several study-level covariates that might have contributed to heterogeneity (such as study design, study characteristics, magnetic field strength) in a review. However, we did not assess factors by subgroup analyses that as in small meta-analyses this is likely to produce unreliable estimates.
With the Stata software, the presence of publication bias was assessed by producing a Deeks funnel plot and an asymmetry test. Publication bias [24,25] was considered to be present if there was a nonzero slope coefficient (P,0.05), which suggested that only small studies reporting high accuracy had been published, and small studies reporting lower accuracy had likely not been published (P.0.1), which suggested that there was no evidence of notable publication bias.
The Preferred Reporting Items for Systematic Reviews and Meta-Analyses statement [26] was used to improve the reporting of our research (Figure 1 and Checklist S1).
Table 1. Characteristics of the included studies. Study Year N Excluded Prevalence Age (SD) Men (%) MRI and Field MR Sequence SPECT Tracer Data assessment Stressor Stenosis Definition Panting [16] 2001 2 2 0 73% 63(9) 63 Surrey 0.5T SE-EPI Thallium Semi/qualitative A . 50% Doyle [15] 2003 1 99 15 14% 59(22) 80 Philips 1.5T G radient-echo both Semiquantitative D $ 70% Ishida [14] 2003 1 04 0 74% 62(12) 78 GE 1.5T Gradient-echo both qualitative D $ 70% Thiele [13] 2004 2 0 0 90% 64(8) 65 Philips 1.5T G radient-echo T echnetium Semiquantitative A $ 70% Okuda [12] 2005 33 0 97% 60( 2 ) 88 G E 1 .5T Gradient-EPI T echnetium qualitative D $ 75% Sakuma [11] 2005 40 0 52% 65(9) 70 Siemens 1.5T T urbo FLASH Thallium qualitative D $ 70% Sharples [17] 2007 3 55 61 68% 62(9) 70/68 GE 1.5T Gradient-echo T echnetium – A $ 70% Schwitter [10] 2008 4 8 3 76% 61(11) 71 1.5T* – both quantitative A . 50% Greenwood [9] 2012 7 52 76 39% 60(9) 62 Philips 1.5T G radient-echo T echnetium quantitative A $ 70% Schwitter [8] 2013 5 15 90 49% 60(10) 73 1.5T* – both quantitative A $ 70% Note: A, Adenosine; D, Dipyridamole; –, no metion; *, multi-centre with different brands. doi:10.1371/journal.p one.0088402.t001
Results
The database search initially yielded 235 potential literature citations, and one additional record was identified through a grey literature search (Figure 1). After review of the titles and abstracts, 198 of these studies were excluded because they were not relevant studies. After reading the full texts, we excluded 28 of the remaining 38 articles for the following reasons: the article lacked sufficient information to enable completion of a 262 contingency table, the article was not available, the article with fewer than 20 patients, or the article was not published in English. After this final screening, 10 published studies met our inclusion criteria, with 5 studies assessed base on patient, 4 studies assessed base on coronary territory (CT) and 1 study assessed base on both. Neither cost-effectiveness nor practicality was taken into consideration.
The data abstracted from these individual studies are summarised in Table 1. According to QUADAS-2, the quality assessment for the 10 studies was moderate. The results of the distribution of the study design are shown in Figure 2.
To reduce heterogeneity, the analysis was carried out in two parts: (a) comparison of CMR with SPECT based on coronary territory (b) comparison of CMR with SPECT based on patient. For part (1), Figure 3 shows the forest plots of the sensitivity and specificity estimates for CMR and SPECT for five studies. The pooled, weighted values (with corresponding 95% CIs) for CMR were SEN 0.91 (0.87–0.94), SPE 0.95 (0.92–0.97), PLR 16.96 (11.08–25.98), NLR 0.10 (0.07–0.14), DOR 177.14 (91.75– 342.01), and AUC 0.97 (0.96–0.99). The pooled, weighted values for SPECT were SEN 0.77 (0.70–0.83), SPE 0.93 (0.84–0.97), PLR 10.32 (4.80–22.16), NLR 0.25 (0.19–0.33), DOR 41.34
Figure 2. Methodological quality of the 10 included studies. A, Risk of bias and applicability concerns summary; B, Risk of bias and
applicability concerns graph.
(18.46–92.62), and AUC 0.88 (0.85–0.91). For part (2), Figure 4 shows the forest plots of the sensitivity and specificity estimates for six studies. The pooled, weighted values for CMR were SEN 0.92 (0.80–0.97), SPE 0.97 (0.92–0.99), PLR 29.01 (10.29–81.80), NLR 0.08 (0.03–0.22), DOR 354.19 (51.35–2443.08), and AUC 0.99 (0.97–0.99). The pooled, weighted values for SPECT were SEN 0.87(0.76–0.93), SPE 0.93 (0.86–0.97), PLR 14.01 (5.71–34.37), NLR 0.14 (0.07–0.28), DOR 98.23 (21.90–440.55), and AUC 0.96 (0.94–0.97). A summary of these results is given in Table 2. The pairs of observed sensitivity and specificity values for parts (1) and (2) are presented in HSROC curves in Figures 5 and 6, respectively.
The results of Deeks funnel plot asymmetry test (P = 0.084) showed no evidence of notable publication bias (Figure 7).
Discussion
Although CMR has been already included in international guidelines for the non-invasive detection of coronary heart disease,it does not have the consistent findings from the previous meta-analysis and systematic review [5,27,28] which assessed different imaging modalities directly or indirectly, including perfusion-CMR and SPECT, for the diagnosis of CAD (Table 3). Recently, two large scale diagnostic accuracy and clinical outcome datas, MR-IMPACT II [8] and CE-MARC [9], on that have been published and also have an inconsistent finding. As direct approach is known to provide better measurements of the diagnostic accuracy of two different methods [29], we focused exclusively on direct comparative studies that evaluated both CMR and SPECT in randomised controlled or the same patients. Comparison with these previous meta-analysis and systematic
Figure 3. Forest plots of the SEN and SPE with corresponding 95%CIs for the detection of CAD base on patient.A, CMR; B, SPECT.
doi:10.1371/journal.pone.0088402.g003
review, there may be also another strength in our research: with more careful selection of articles, two direct comparative studies which missed in their researches were included in ours.
In this limited cohort of studies, the main results can be summarized as follows: 1). When assessed base on coronary territory, the diagnostic performance of perfusion-CMR assessed as SEN, SPE, and the area under the ROC curve (AUC) were superior over SPECT in detecting CAD. This findings of our study were in accord with the meta-analysis of Iwataet al. [27], which
only included studies assessed base on coronary territory. 2). When assessed base on patient, the diagnostic performance of perfusion-CMR assessed as SEN and AUC values were superior over SPECT in detecting CAD, but inferior in SPE. Two previous indirect comparative meta-analyses demonstrated significantly higher SEN and DOR than SPECT but failed to show significant
superiority in SPE (Table 2). As indirect comparative meta-analysis, we believe that might be caused by the different patients included in various studies. One may also speculate that may be caused by threshold effect with different diagnostic cut-off values, various data obtain and analysis methods. Such as, CE-MARC used a multiparametric CMR protocol, unlike other studies in our research, which used only the perfusion CMR components.
Compared with the result based on coronary territory, the diagnostic performace of CMR based on patient is relative low. We speculate that is related to the fact that perfusion CMR was more compared with the macroscopic coronary artery anatomy, but not assess, for example, collateral flow on the microvascular level [8].
As the numbers of comparative studies available in our research are relatively small, we did not assess factors such as different
Figure 4. Forest plots of the SEN and SPE with corresponding 95%CIs for the detection of CAD base on coronary territory.A, CMR; B,
SPECT.
techniques or higher field strengths by subgroup analyses. New techniques and higher field strengths may make a further improvement in diagnostic accuracy. Jogiya et al. [30] reported
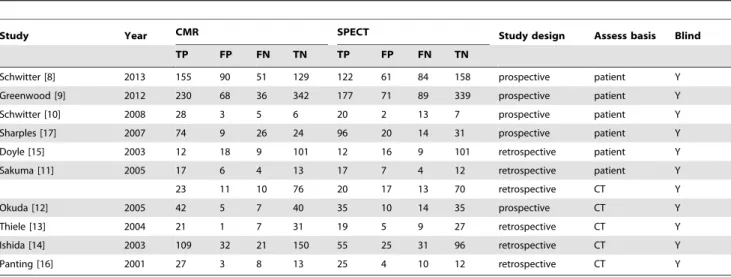
that CMR showed a sensitivity, specificity, and diagnostic accuracy of 91%, 90%, and 91%, respectively, on patient basis and 79%, 92%, and 88% on coronary territory basis, with three-Table 2.Absolute numbers of the included studies.
Study Year CMR SPECT Study design Assess basis Blind
TP FP FN TN TP FP FN TN
Schwitter [8] 2013 155 90 51 129 122 61 84 158 prospective patient Y
Greenwood [9] 2012 230 68 36 342 177 71 89 339 prospective patient Y
Schwitter [10] 2008 28 3 5 6 20 2 13 7 prospective patient Y
Sharples [17] 2007 74 9 26 24 96 20 14 31 prospective patient Y
Doyle [15] 2003 12 18 9 101 12 16 9 101 retrospective patient Y
Sakuma [11] 2005 17 6 4 13 17 7 4 12 retrospective patient Y
23 11 10 76 20 17 13 70 retrospective CT Y
Okuda [12] 2005 42 5 7 40 35 10 14 35 prospective CT Y
Thiele [13] 2004 21 1 7 31 19 5 9 27 retrospective CT Y
Ishida [14] 2003 109 32 21 150 55 25 31 96 retrospective CT Y
Panting [16] 2001 27 3 8 13 25 4 10 12 retrospective CT Y
Note: CT, coronary territory. doi:10.1371/journal.pone.0088402.t002
Figure 5. The pairs of observed values of sensitivity and specificity for CMR and SPECT to detect CAD base on coronary territory in HSROC curves.
doi:10.1371/journal.pone.0088402.g005
Figure 6. The pairs of observed values of sensitivity and specificity for CMR and SPECT to detect CAD base on patient in HSROC curves.
doi:10.1371/journal.pone.0088402.g006
Figure 7. The funnel plot of publication bias.A, CMR base on patient; B, SPECT base on patient; B, CMR base on coronary territory; D, SPECT
base on coronary territory.
dimensional perfusion technique at 3 Tesla. It may offer CMR a more diagnostic performance over SPECT in future.
Some inherent limitations exist in our study and should be considered when interpreting our results. First, the number of comparative studies available in the literature and the sample size of these studies are relatively small, which is a particular problem in diagnostic studies [31]. These shortcomings may result in an overestimation of diagnostic accuracy, particularly in studies including non-representative samples of patients and invalid reference standards [29]. However, a systematic review [32], focused on meta-analysis studies from the Cochrane Database, showed that the number of studies eligible for meta-analysis is typically small in all medical areas and for all outcomes and interventions covered by the Cochrane Reviews. Second, six of ten studies did not enroll a consecutive or random sample of patients, which tended to be a risk of bias in patient selection. Third, publication bias may be of any meta-analysis. Our meta-analysis was based only on published studies, which are prone to report positive or significant results; the studies whose results are not significant or negative are often rejected or are not even submitted. Although it is suggested that the quality of the data reported in
articles accepted for publication in peer-reviewed journals is superior to the quality of unpublished data [33], only including published studies may lead to reporting bias.
In conclusion, a limited number of studies demonstrated that CMR is more sensitive to detect CAD than SPECT in both on a per-patient basis and per-coronary territory, but inferior in specificity on a per-patient. In future, with new techniques and higher field strengths, large-scale, well-designed trials, are neces-sary to compare the diagnostic value of these two imaging techniques.
Supporting Information
Checklist S1 PRISMA 2009 checklist.
(DOC)
Author Contributions
Conceived and designed the experiments: LC XW YX JW. Performed the experiments: LC XW JB CG YX JW. Analyzed the data: LC XW. Contributed reagents/materials/analysis tools: LC XW JB CG YX JW. Wrote the paper: LC XW.
References
1. Lloyd-Jones D, Adams RJ, Brown TM, Carnethon M, Dai S, et al. (2010) Heart disease and stroke statistics–2010 update: a report from the American Heart Association. Circulation 121: e46–e215.
2. Smith SC Jr, Feldman TE, Hirshfeld JW Jr, Jacobs AK, Kern MJ, et al. (2006) ACC/AHA/SCAI 2005 Guideline Update for Percutaneous Coronary Intervention-Summary Article: A Report of the American College of Cardiology/American Heart Association Task Force on Practice Guidelines (ACC/AHA/SCAI Writing Committee to Update the 2001 Guidelines for Percutaneous Coronary Intervention). J Am Coll Cardiol 47: 216–235. 3. Wijns W, Kolh P, Danchin N, Di Mario C, Falk V, et al. (2010) Guidelines on
myocardial revascularization. Eur Heart J 31: 2501–2555.
4. Lerakis S, McLean DS, Anadiotis AV, Janik M, Oshinski JN, et al. (2009) Prognostic value of adenosine stress cardiovascular magnetic resonance in patients with low-risk chest pain. J Cardiovasc Magn Reson 11: 37. 5. Jaarsma C, Leiner T, Bekkers SC, Crijns HJ, Wildberger JE, et al. (2012)
Diagnostic performance of noninvasive myocardial perfusion imaging using single-photon emission computed tomography, cardiac magnetic resonance, and positron emission tomography imaging for the detection of obstructive coronary artery disease: A meta-analysis. J Am Coll Cardiol 59: 1719–1728.
6. Mowatt G, Vale L, Brazzelli M, Hernandez R, Murray A, et al. (2004) Systematic review of the effectiveness and cost-effectiveness, and economic evaluation, of myocardial perfusion scintigraphy for the diagnosis and management of angina and myocardial infarction. Health Technol Assess 8: iii–iv, 1–207.
7. Hamon M, Fau G, Nee G, Ehtisham J, Morello R (2010) Meta-analysis of the diagnostic performance of stress perfusion cardiovascular magnetic resonance for detection of coronary artery disease. J Cardiovasc Magn Reson 12: 29. 8. Schwitter J, Wacker CM, Wilke N, Al-Saadi N, Sauer E, et al. (2013)
MR-IMPACT II: Magnetic resonance imaging for myocardial perfusion assessment in coronary artery disease trial: Perfusion-cardiac magnetic resonance vs. single-photon emission computed tomography for the detection of coronary artery disease: A comparative multicentre, multivendor trial. Eur Heart J 34: 775–781. 9. Greenwood JP, Maredia N, Younger JF, Brown JM, Nixon J, et al. (2012) Cardiovascular magnetic resonance and single-photon emission computed tomography for diagnosis of coronary heart disease (CE-MARC): a prospective trial. Lancet 379: 453–460.
10. Schwitter J, Wacker CM, van Rossum AC, Lombardi M, Al-Saadi N, et al. (2008) MR-IMPACT: comparison of perfusion-cardiac magnetic resonance with single-photon emission computed tomography for the detection of coronary artery disease in a multicentre, multivendor, randomized trial. Eur Heart J 29: 480–489.
11. Sakuma H, Suzawa N, Ichikawa Y, Makino K, Hirano T, et al. (2005) Diagnostic accuracy of stress first-pass contrast-enhanced myocardial perfusion MRI compared with stress myocardial perfusion scintigraphy. American Journal of Roentgenology 185: 95–102.
12. Okuda S, Tanimoto A, Satoh T, Hashimoto J, Shinmoto H, et al. (2005) Evaluation of ischemic heart disease on a 1.5 tesla scanner: Combined first-pass perfusion and viability study. Radiation Medicine - Medical Imaging and Radiation Oncology 23: 230–235.
Table 3.Summary of meta-analysis and systematic review focused on the comparison with CMR and SPECT in the diagnosis of CAD.
Assess Study Search date Modality SEN (95% CI) SEP (95% CI) DOR (95% CI) AUC (95% CI) Comparison
Based on CT Iwata [27] 1995–2006 CMR 0.75(0.68, 0.81) 0.89(0.85, 0.93) 24.80(14.40, 42.60) – direct
SPECT 0.64(0.57, 0.71) 0.83(0.77, 0.88) 9.20(5.60, 15.10) –
Our to 2013 CMR 0.80(0.73, 0.85) 0.87(0.81, 0.91) 25.63(15.84, 41.45) 0.90(0.89, 0.93) direct
SPECT 0.67(0.60, 0.72) 0.80(0.75, 0.84) 7.87(5.32, 11.65) 0.80(0.76, 0.83)
Based on Patient Marcus [28] 2000–2011 CMR 0.91(0.88, 0.93) 0.80(0.76, 0.83) 37.69(26.00, 54.63) – indirect
SPECT 0.83(0.73, 0.89) 0.77(0.64, 0.86) 15.84(9.74, 25.77) –
Jaarsma [5] 1990–2010 CMR 0.89(0.88, 0.91) 0.76(0.73, 0.78) 26.42(17.69, 39.47) 0.91 (0.89, 0.93) indirect
SPECT 0.88(0.88, 0.89) 0.61(0.59, 0.62) 15.31(12.66, 18.52) 0.87 (0.85, 0.89)
Our to 2013 CMR 0.79(0.72, 0.84) 0.75(0.65, 0.83) 11.10(5.73, 21.49) 0.84 (0.80, 0.87) direct
SPECT 0.70(0.58, 0.80) 0.76(0.66, 0.83) 7.19(4.68, 11.04) 0.79(0.76, 0.83)
Notes:CT, coronary territory; CMR, cardiovascular magnetic resonance; SPECT, single photon emission computed tomography; –, no metion.
doi:10.1371/journal.pone.0088402.t003
13. Thiele H, Plein S, Breeuwer M, Ridgway JP, Higgins D, et al. (2004) Color-encoded semiautomatic analysis of multi-slice first-pass magnetic resonance perfusion: Comparison to tetrofosmin single photon emission computed tomography perfusion and X-ray angiography. International Journal of Cardiovascular Imaging 20: 371–384.
14. Ishida N, Sakuma H, Motoyasu M, Okinaka T, Isaka N, et al. (2003) Noninfarcted myocardium: Correlation between dynamic first-pass contrast-enhanced myocardial MR imaging and quantitative coronary angiography. Radiology 229: 209–216.
15. Doyle M, Fuisz A, Kortright E, Biederman RWW, Walsh EG, et al. (2003) The impact of myocardial flow reserve on the detection of coronary artery disease by perfusion imaging methods: An NHLBI WISE study. Journal of Cardiovascular Magnetic Resonance 5: 475–485.
16. Panting JR, Gatehouse PD, Yang GZ, Jerosch-Herold M, Wilke N, et al. (2001) Echo-planar magnetic resonance myocardial perfusion imaging: Parametric map analysis and comparison with thallium SPECT. Journal of Magnetic Resonance Imaging 13: 192–200.
17. Sharples L, Hughes V, Crean A, Dyer M, Buxton M, et al. (2007) Cost-effectiveness of functional cardiac testing in the diagnosis and management of coronary artery disease: a randomised controlled trial. The CECaT trial. Health Technol Assess 11: iii–iv, ix-115.
18. Whiting P, Rutjes AW, Reitsma JB, Bossuyt PM, Kleijnen J (2003) The development of QUADAS: a tool for the quality assessment of studies of diagnostic accuracy included in systematic reviews. BMC Med Res Methodol 3: 25.
19. Whiting PF, Weswood ME, Rutjes AW, Reitsma JB, Bossuyt PN, et al. (2006) Evaluation of QUADAS, a tool for the quality assessment of diagnostic accuracy studies. BMC Med Res Methodol 6: 9.
20. Whiting PF, Rutjes AW, Westwood ME, Mallett S, Deeks JJ, et al. (2011) QUADAS-2: a revised tool for the quality assessment of diagnostic accuracy studies. Ann Intern Med 155: 529–536.
21. Menke J (2010) Bivariate random-effects meta-analysis of sensitivity and specificity with SAS PROC GLIMMIX. Methods Inf Med 49: 54–62, 62–54. 22. Higgins JP, Thompson SG, Deeks JJ, Altman DG (2003) Measuring
inconsistency in meta-analyses. BMJ 327: 557–560.
23. Leeflang MM, Deeks JJ, Gatsonis C, Bossuyt PM (2008) Systematic reviews of diagnostic test accuracy. Ann Intern Med 149: 889–897.
24. StataCorp (2009) Stata Statistical Software: Release 11. College Station, TX: StataCorp LP.
25. Deeks JJ, Macaskill P, Irwig L (2005) The performance of tests of publication bias and other sample size effects in systematic reviews of diagnostic test accuracy was assessed. Journal of Clinical Epidemiology 58: 882–893. 26. Moher D, Liberati A, Tetzlaff J, Altman DG (2009) Preferred reporting items for
systematic reviews and meta-analyses: the PRISMA statement. PLoS Med 6: e1000097.
27. Iwata K, Kubota M, Ogasawara K (2008) [Comparsion with myocardial perfusion MRI and myocardial perfusion SPECT in the diagnostic performance of coronary artery disease: a meta-analysis]. Nihon Hoshasen Gijutsu Gakkai Zasshi 64: 251–258.
28. de Jong MC, Genders TS, van Geuns RJ, Moelker A, Hunink MG (2012) Diagnostic performance of stress myocardial perfusion imaging for coronary artery disease: a systematic review and meta-analysis. Eur Radiol 22: 1881– 1895.
29. Brazzelli M, Sandercock PA, Chappell FM, Celani MG, Righetti E, et al. (2009) Magnetic resonance imaging versus computed tomography for detection of acute vascular lesions in patients presenting with stroke symptoms. Cochrane Database Syst Rev: CD007424.
30. Jogiya R, Kozerke S, Morton G, De Silva K, Redwood S, et al. (2012) Validation of dynamic 3-dimensional whole heart magnetic resonance myocardial perfusion imaging against fractional flow reserve for the detection of significant coronary artery disease. J Am Coll Cardiol 60: 756–765. 31. Rutjes AW, Reitsma JB, Di Nisio M, Smidt N, van Rijn JC, et al. (2006)
Evidence of bias and variation in diagnostic accuracy studies. CMAJ 174: 469– 476.
32. Davey J, Turner RM, Clarke MJ, Higgins JP (2011) Characteristics of meta-analyses and their component studies in the Cochrane Database of Systematic Reviews: a cross-sectional, descriptive analysis. BMC Med Res Methodol 11: 160.