Development of 4D dynamic simulation tool
for the evaluation of left ventricular
myocardial functions
Deepa1, Yashbir Singh1, Shi Yi Wu1, Michael Friebe2, Joao Manuel R. S. Tavares3, Hu Wei-Chih1
*
1Department of Biomedical Engineering, Chung Yuan Christian University, Zhongli, Taiwan
2Electrical Engineering and Information Technologies, Otto-von-Guericke-University, Magdeburg, Germany
3Instituto de Ciência e Inovação em Engenharia Mecânicae Engenharia Industrial, Departamento de Engenharia Mecânica, Faculdade de Engenharia, Universidade do Porto, Porto, PORTUGAL
*Corresponding author: [email protected]
Abstract: Cardiovascular disease can be detected by measuring the regional and global wall motion of the left ventricle (LV) of the heart; In this study, we designed a dynamic simulation tool using Computed Tomography (CT) images to assess the difference between actual and simulated left ventricular functions. Thirteen healthy subjects were involved in the study with actual and simulated left ventricular functions. In this research, we found the high correlation between actual left ventricular wall motion and simulated left ventricular wall motion. Our results confirm that our simulation tool is feasible for simulating left ventricular motion.
Keywords: Cardiac imaging, Left-Ventricular remodeling, Cardiac wall motion, Myocardial functions.
I.INTRODUCTION
At present time, cardiovascular disease(CVD) has become one of the most common and prevalent reason of mortality targeting majorly old age group in the human population. Cardiovascular disease comprises a number of different conditions which affect the heart and blood vessels, like coronary heart disease(CHD), cardiac dysrhythmias, heart failure, angina, myocardial infarction. A number of factors that can assist in developing CVD are high blood pressure, high cholesterol, smoking, obesity, diabetes, and lack of exercise. More the factors one have, higher the chances to develop CVD. Like, people having diabetes are more likely to have a twofold to threefold increases risk of clinical atherosclerotic disease[1]. It is also seen that heart wall motion can be an indicator for predicting cardiovascular disease in groups of patients with myocardial infarction (MI), unstable angina, typical chest pain, and congestive heart failure (CHF)[2]. This research has been performed to calculate wall motion between actual and simulated LV wall motion and to show correlation study between endocardial displacements to the central axis.
II. METHOD
The main purpose of this study was to simulate the left ventricular functions and to access local left ventricular myocardial function. We used Microsoft Windows platform, Visual C ++ 6.0 for software development and OpenGL library as a tool for the 3D model. Images were obtained from the computerized tomography (CT) SIEMENS_LEOVB30B instrument provided by Taipei Veterans General Hospital. This study and the informed consent procedure were approved by the Institutional Review Board of Taipei Veterans General Hospital. In this study, thirteen subjects were involved with atrial fibrillation and left ventricular motion abnormalities. Each subject has 10 sets of timing frames, including a complete heartbeat cycle. The scanned image size was 512 × 512 (pixels). The images were read by the program and confirmed the format for the DICOM (Digital Imaging and Communications in Medicine) and stored in 512x512 gray format. 3D reorganization and image information was obtained to construct the stereoscopic model of the thoracic area. We set the left ventricular central axis and image was resampled. The left ventricle region was segmentated to enhance the Eigen value of the left ventricular edge. After that, each layer of the image was multiplied by the resample length, breadth resolution and actual layer of thickness. Endometrium was divided into 31 layers and each layer again divided into 930 points in which 30 points have been taken for our study considering 31st layer as the reference layer. After setting the
angle and height, we obtained actual left ventricular information at time 0 and calculated the rate of radius change to simulate left ventricular motion. We performed the analysis of the total volume and RVC(rate of volume change)[3,4].
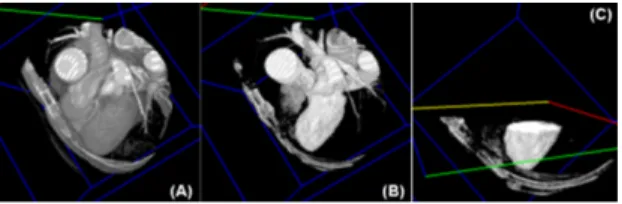
Fig1. (A) 3D view of Original image (B) Position of the left ventricle(C) LV with 3D incision
Left ventricular edge search
We used manually cutting of LV images from base to apical from the entire data set. One image was selected from the dataset and one seeded point was set to start this process. We obtained the geometrical center that connects each slice on long axis, applied regression calculation to find the line as a reference axis for LV [5].
Fig 2. Manually separated line between left ventricle and the aorta
Regional growth circle endocardial selection
The left ventricular endocardial circle was used for the regional growth of the image which located near to the edge of the image. The regional growth was required to set up the initial seed point. The initial point of the first slice was considered as the reference point of the second slice, the second reference point was set as the seeded region for other layers simultaneously (Fig 2). It was necessary to confirm that the seeded spots of each layer are in the endometrial region and if not, we need to manually correct the seed points [6].
Fig 3. Seeded point star from the first layer and the last layer
In the simulation of left ventricular motion, we got ten sequence of the LV segment from mitral valve to the apical part which represent the distance of the
long axis of the left ventricle. Left ventricle contracts with the long axis shorten and the myocardium twist towards the leftward direction then LV wall exhibit thick. The left ventricular end diastolic radius rates of change were calculated. The rate of change in radius and torsion angle were linearly divided into each degree of torsion then the LV contraction model developed shorten axis LV model and radius change torsion model.
Archimedean spiral
Left ventricular systolic contraction describes a uniform movement and relates to the Archimedean spiral equation. Archimedes spiral equation is mentioned below, each θ value has a corresponding r, and the different values of θ correspond to different r values (cot α ≠ 0). If cot α> 0, the curve converges would near the pole when θ approaches to ∞, if cot α <0, the curve farther and farther as θ approaches -∞, when applying the left ventricular simulated motion, the larger the angle of contraction changes in the larger amount. However, considering the ratio of the change of the inner r value of the Archimedes spiral at 180 degrees is too small then turn the angle of twist by 180 degrees.
... (i)
Fig.4. Archimedean Helix Radius change rate
The radius rate change was calculated by taking average of the 30 sampling points to the center of each layer and also calculated the actual average final radius of contraction. Whenever a twist occurs, the mean radius of end-diastole and R rate = (RED radius of end-diastole -RES) / RED because we set the maximum twist angle to 20 degrees as shown in equation (ii). The red is the spiral created by the
a q
g
=
ae
cotoriginal Archimedes and the blue is by adding a spiral of rate of change in radius. It shows that the radius of the blue line will vary more widely with the angle.
... (ii)
Fig.5. Archimedean spirals plus situational change rates.
Left ventricle before and after the simulation is shown in the figure. A1 represents the right half of the point and A2 represents the left half of the point. The left and right sides of A2 and the left hemisphere makes a distance contraction change in the way to the left, the left ventricle after simulation (A1) and A2 Points change to B1 and B2 respectively.
Fig.6. Left ventricle simulation (A1 and A2 before the displacement, Angle and height changes to B1 and B2 III. RESULT
We proposed a novel approach to evaluate the left ventricular myocardial functions and the normalized wall thickness, which can be used to detect wall motion abnormality. This feature considers the variations between normal and abnormal contraction by tracking the normalized thickness of all segments between the endo and epicardium during the whole cardiac cycle. Here we have discussed the result in different steps.
Simulation Interface:
The input parameters shown in the red box. The simulation was performed on 1 degree interval and one-time left-heart grid modeled with 0 to 20 degrees
of variation. Each simulated angle is shown in green box (Fig 7) (Fig 8).
Fig.7. Red box is shown angle and radius rate, Green box is shown long axis parameter. Simulated volume is shown on 0 to 20 degrees
Fig.8. Red box is shown the volume of the local 18 regions.
Parameter Analysis Display Interface
Comparison of the left ventricular function is shown. The red line represents actual VTC and RVC while the green line represents the simulated value. This observation window clearly shows that similarity between the constructed simulation system and the real left ventricle. This confirms the relevance of our system for global left ventricular function between simulated and real left ventricular changes in motion (Fig.9) .
Fig.9. RVC and VTC display interface (red line) as real data (green line) as analog data
)) 20 ( 1 ( R angle R=g´ + rate´
Dynamic and Analysis Display Interface
The dynamic interface allows observing more clearly actual and simulated left ventricular motion.
Fig.10 (i) Dynamic interface (A) Actual LV of EF(B) (C) simulated LV of EF.
Fig.11. (ii) Dynamic interface (A) Actual left ventricle 900 vector changes (B) simulated left ventricle 900 vector changes
Fig.12. Dynamic Interface (A) Actual vs. Simulated Left Ventricle (B) Separated Actual vs Simulated Left Ventricle
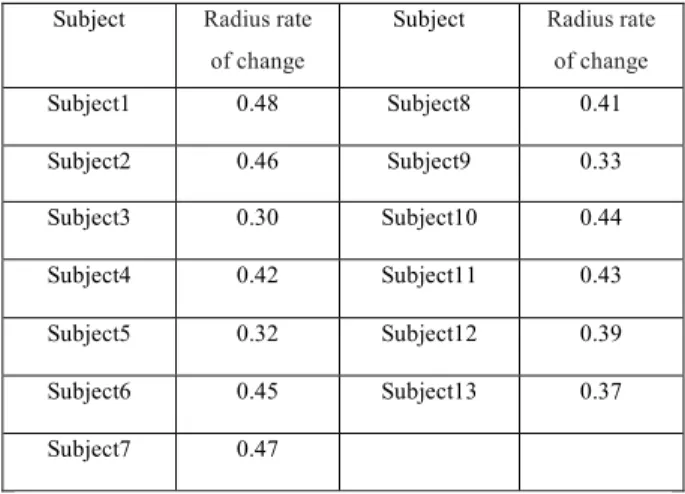
This study tested the effect of torsion angles which were set at 15, 18, and 20 degrees (Fig 13). The magnitude of left ventricular volume change is relatively smaller when the angle of the input is smaller as well. The calculation of left ventricular function may cause misjudgment. Therefore, we set the torsion angle to 20 degrees in order to meet the change of real left ventricular volume (Table1,Table 2).
Fig.13. Angle and volume changes in the relationship diagram
Subject Radius rate of change
Subject Radius rate of change Subject1 0.48 Subject8 0.41 Subject2 0.46 Subject9 0.33 Subject3 0.30 Subject10 0.44 Subject4 0.42 Subject11 0.43 Subject5 0.32 Subject12 0.39 Subject6 0.45 Subject13 0.37 Subject7 0.47
Table 1 The radius change of 13 subjects
Time Original (ml) Resample (ml) Difference (ml)
00 134.5 132.4 2.1 10 114.1 112.3 1.8 20 77.3 76.1 1.2 30 46.7 45.9 1.2 40 40.7 40.1 0.6 50 56 55.1 0.9 60 84.1 82.8 1.3 70 96.1 94.6 1.5 80 104.1 102.5 1.6 90 116.8 114.9 1.9
Table 2. left ventricular volume differences
III . CONCLUSION
In this research, we developed simulation tool using 3D images of actual left ventricular on long-axis changes that tool helps in the accurate assessment of cardiac regional function. We evaluated the difference between the actual and simulated left ventricular function. The difference with the simulated model shows to assess the myocardial position of LV. Further research will involve the integration of the heart motion, validating geometrical landmarks and integration of the motion matching. ACKNOWLEDGMENT
We are thankful to Weichihhu lab member, Chung Yuan Christian University, Taiwan for their contribution in preparing the article.
REFERENCES
1. Kannel, William B., and Daniel L. McGee. "Diabetes and cardiovascular disease: the Framingham study." Jama 241.19 (1979): 2035-2038.
2. Cicala, Silvana, et al. "Prevalence and prognostic significance of wall-motion abnormalities in adults without clinically recognized cardiovascular disease: the Strong Heart Study." Circulation 116.2 (2007): 143-150.
3. Monga and N. Ayache. From voxel to curvature. IEEE
Computer Vision and Pattern Recognition, 1991, 644-649.
4. P. T. Sander and S. W. Zucker. Inferring surface trace
and differential structure from 3D images. IEEE
Transactions on Pattern Analysis and Machine Intelligence, 1990, 12(9):833-854.
5. J. Park, D. Metaxas, A. A. Young, and L. Axel, "Deformable models with parameter functions for cardiac motion analysis from tagged MRI data, “IEEE Transactions on Medical Imaging, 1996.
6. J. Huang, D. Abendschein, V. G. Davila-Roman, and A. A. Amini, "Spatio-temporal tracking of myocardial deformations with a 4-D B-spline model from tagged MRI," IEEE Transactions on Medical Imaging, 1999. 7. Walser, H.; Hilton, P.; Pedersen, J.; Mathematical Association of America. Symmetry. Mathematical Association of America. p. 27. ISBN 9780883855324. Retrieved 2014-10-06.
About authors:
Deepa is a PhD student, working in field medical imaging. Prior to enrolling at CYCU, Taiwan, she worked as senior research fellow in India. She holds Master of technology in Bioinformatics from IIITA, India. She can be contacted at: [email protected].
Yashbir Singh is a PhD candidate, working in field Cardiac Electrophysiology using Machine learning approach. Prior to enrolling at CYCU, Taiwan, He worked as junior research fellow at Indian Institute of Technology, India. He can be contacted at: [email protected] Shi Yi Wu is a master student. She completed tertiary education in Biomedical Engineering form Chung Yuan Christian University, Taiwan. she is working in the field of Bio signal processing. She can be contacted at: [email protected].
Prof. Michael Friebe has been involved in diagnostic imaging and image guided therapeutic products and services as well as other related Medical Technology ventures, as founder / innovator / CEO and investor. Dr. Friebe currently is a Board Member of two startup R&D companies, as well as investment partner of a medical technology startup-fund. Dr. Friebe is a member of IEEE, ISMRM, RSNA, and ECR and an affiliated professor with the chair for Computer Aided Medical Procedures (CAMP) at TUM.
He can be contacted at:[email protected]
Prof. João Manuel R. S. Tavares has PhD Degrees in Electrical and Computer Engineering, and Habilitation in Mechanical Engineering from University of Porto. He is Editor-in-chief of the Computer Methods in Biomechanics and Biomedical Engineering: Imaging & Visualization and Editor of the book series Lecture Notes in Computational Vision and Biomechanics. He can be contacted at: [email protected]
Prof. Wei-Chih Hu, PhD, has been involved in Medical imaging in application of Cardiovascular Research and Instrumentation, as innovator and scientist, professor of Biomedical engineering, Chung Yuan Christian university,
Taiwan. He is listed inventor of more than 13 patent applications and the author of many papers which have good citations. He can be contacted at: [email protected].