Chitosan-Hydroxyapatite-BIT Composite Films:
Preparation and Characterization
A.G. Pinheiro,1F.F.M. Pereira,2M.R.P. Santos,2 F.N.A. Freire,2J.C. Go´es,3A.S.B. Sombra3 1Departamento de Fı´sica -FECLESC (UECE), Brazil
2Departamento de Quimica Organica e Inorgaˆnica-UFC, Brazil
3Laborato´rio de Telecomunicac¸o˜es e Ciencia e Engenharia de Materiais (LOCEM), Departamento de Fı´sica,
Universidade Federal do Ceara´, Caixa Postal 6030, CEP 60455–760, Fortaleza, Ceara´, Brazil
In this article, we present a study of chitosan-hydroxy-apatite-BIT composite films by combining chitosan (deacetylated degree, 90%) solution and two crystalline materials, HAN (hydroxyapatite (Ca10(PO4)6(OH)2) N for
nanocrystalline) and BIT (Bi4Ti3O12)). The first one (HAN),
is the mineral phase present in human bone, the second one (BIT) is a ferroelectric discovered by Aurivillius in 1949 (Fang, Robbins, and Aurivillius, Physical Review, 126, 3 (1962)). Both BIT and HAN were synthesized by our group using the ball milling process. Combining these two materials (HAN and BIT), we took a series of mea-surements to identify the composite phases present, and their electric and structural behavior. For the Chi-tosan composite Q6 (50% BITⴙ50% HAN), we achieved at 100 Hz a dielectric constantK⬃3360. The application could be a new biomembrane, which once polarized could be applied to the human skin as curatives or bio-sensors.POLYM. COMPOS., 28:582–587, 2007. © 2007 Society of Plastics Engineers
INTRODUCTION
Polymeric composite materials, both of natural and syn-thetic origin, constitute by far the broadest and most diverse class of biomaterials. Charge and polarization storage via the electret’s state has been found in many biomaterials. As biomaterials, electrets have found interesting applications as antithrombogenic surfaces, stimulation of tissue growth in bone and special artificial membranes [1, 2]. Fundamental macromolecules of biology, such as chitosan, exhibit the effect. Chitosan have great potential in the field of bioactive biomaterials, it is a polymer, which contains-1– 4 linked 2-amino-2-deoxy-D-glucopyranose repeat units and is
readily obtained by theN-deacetylation of chitin, a naturally abundant polysaccharide. This biopolymer is the structural component of the cuticles of crustaceans, insects, and mol-lusks and is also found in the cell of some microorganisms. A number of biomedical applications have also been envis-aged. Chitosan and its derivatives have explored as mem-branes for dialysis, wound healing accelerators, and carriers for controlled drug delivery [1].
The objective of this research is the study of structural and electric properties of chitosan-HAN-BIT films (HAN-hydroxyapatite (Ca10(PO4)6(OH)2) and BIT (Bi4Ti3O12)),
considering the development of new biomaterials that have potential applications in coating of cardiovascular prosthe-ses, support for cellular growth, and in systems for con-trolled drug delivery [1], medical membranes. The HAN and the BIT were synthesized by the ball milling process, or also known as mechanical alloying. HAN has biocompat-ibility with the human bone and fluids, and is very much used in the implant prostheses industry [3], BIT is a ferro-electric Aurivillius structure [4], which presents a high Curie point (675°C) and a high dielectric constant. This promising material is being studied for the application to the NVFeRAM (non volatile ferroelectric RAM), in the elec-tronic industry. Our purpose here is to combine HAN and BIT with chitosan, proceed with structural and electrical measurements, in order to implement (in a future work) a new biomembrane that once polarized could be applied to the human skin as curatives, biosensors, thick films capac-itors, etc.
EXPERIMENTAL METHODS
HA Nanocrystalline Powder Ca10(PO4)6(OH)2(HA3)
In this article, mechanical alloying has been used suc-cessfully to produce nanocrystalline powders of hydroxy-Correspondence to: A.S.B. Sombra; e-mail: [email protected]
Contract grant sponsors: Brazilian agencies FINEP, FUNCAP, CNPq, CAPES.
DOI 10.1002/pc.20267
apatite (HA3) and bismuth titanate (BIT), using the proce-dure HA3 [5]:
10Ca(OH)2⫹3P2O5O¡ IMPACTS
Ca10(PO4)6(OH)2⫹9H2O
(1)
Commercial oxides Ca(OH)2 (Vetec, 97% with 3% of
CaCO3), P2O5(Vetec, 99%) were used in the HA
prepara-tion [5]. For this reacprepara-tion, the material was ground on a Fritsch Pulverisette 5 planetary mill with the stechiometric proportionality between the oxides given in the above equa-tion. Milling was performed in sealed stainless steel vials and balls under air, with 350 rpm as rotation speed. The powder mass to the ball mass ratio used in all the experi-ments was near 1/6. To avoid excessive heat, the milling was performed in 30 min milling steps with 10 min pauses. Mechanical alloying was performed for 60 h of milling. The HA milled for 60 h (HA3/60) is called HAN in this work. In Fig. 1, we see the XRD of the HA milled for different times, compared with the commercial hydroxyapatite that pos-sesses CaHPO4 impurity. The HAN synthesized in this
work showed total agreement (XRD, Raman, IR) with the literature [3].
BIT
For the BIT, milling was performed with the commercial oxides TiO2 and Bi2O3, under the same procedures
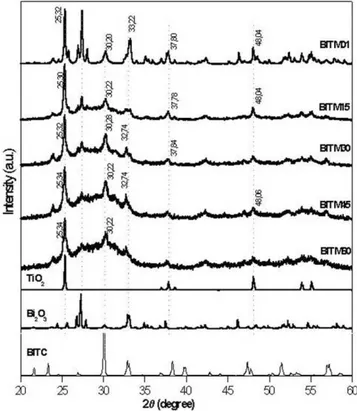
com-mented for the HAN. In Fig. 2, it is shown the XRD for the milling times was applied to the BIT reaction below (the M
stands for milled) as we can note the amorphous phase pattern increases with the milling time, this is related to decreasing size of the particles as the milling time increases, see Table 1 (the last three lines):
2Bi2O3⫹3TiO2O¡ IMPACTS
Bi4Ti3O12 (2)
BITM01 was chosen for a calcination for 1 h at 850°C, and then used with BITM01 and BITM15 to produce the chitosan composites thick films. Figure 3 shows the XRD of the calcined BITM01, now called BITC, it agrees with the JCPDS [6] orthorhombic pattern of the ferroelectric phase.
Chitosan CNH6O4
Chitosan CNH6O4 (CS), from a shrimp shell with a
molecular weight deacetylation degree of 85.5%, was ob-tained from Aldrich. CS was then combined in a set of composites including HAN and BIT, according to Table 1. For all the composites, films were dried at 18°C in a small rectangular acrylic molds, for 5 days, in a domestic refrig-erator, at a constant 20 ml volume for the chitosan. Then all the composites were taken to the measurement procedures.
X-Ray Diffraction
The X-ray diffraction (XRD) patterns were obtained at room temperature (300 K) by step scanning using powdered FIG. 1. XRD for HA at different milling times 15 h (HA3/15), 30 h
(HA3/30), 45 h (HA3/45), 60 h (HA3/60).
samples. We used 5 s for each step of counting time, with a Cu K␣ tube at 40 kV and 25 mA using the geometry of Bragg-Brentano.
Scanning Electron Microscopy
The photomicrograph of membranes of the composites were obtained on a scanning electron microscope, Phillips XL-30, operating with bunches of primary electrons ranging from 12 to 20 keV, in rectangular samples, covered with a layer of carbon of 30 nm of thickness.
Dielectric Measurements
Dielectric measurements were obtained from HP 4194 impedance analyzer, which cover the region of 100 Hz to 40 MHz. The flat faces of the samples are painted with a silver electrode.
RESULTS AND DISCUSSION
X-Ray Diffraction
Figure 1 has reaction 1. In this reaction, we used P2O5
and Ca(OH)2as our starting products. Figure 1 shows the
XRD of the milled sample of reaction (HA3). One can notice that after 15 h of milling, the HA is present. The ceramic is very stable up to 60 h of milling. After 15 h of
milling, the product of reaction HA3 is HA, with good identification of the HA phase, which has the crystallite size in an average of 40 nm. In this article, we will call the HA3/60 (milled for 60 h) as HAN.
A more meticulous study of the XRD in reaction 3 (HA3) shows that less than 15 h is necessary to obtain HA. It was observed that only 2.5 h of milling is necessary to obtain HA [7]. In Fig. 2, one has the X-ray analysis of the BIT preparation. Starting from the top of the figure, we have BITM01 to BITM60, which are the milled samples for 1, 15, 30, 45, and 60 h of milling following Eq. 2. In the bottom of the figure, one has the XRD of the starting materials TiO2 and Bi2O3and BITC, which was obtained
from the solid state procedure as described before (calcina-tion for 1 h at 850°C). Starting from BITM01, one can notice that after 60 h of milling the main peak associated to TiO2 is still present. The main peak associated to BIT is
already present in the BITM01 sample.
In Fig. 2, we can also notice that for BITM01 and BITM15 samples, the presence of the starting materials like Bi2O3and TiO2, together with peaks associated to the BIT
phase was detected.
After 60 h of milling, the sample presented a strong amorphous behavior. One can conclude that during the milling process one has the BIT formation; however, the conversion is not perfect and the presence of TiO2 was
detected.
We did a calcination procedure in the BITM01 sample. It was submitted to calcination for 1 h at 850°C. In Fig. 3, one has the XRD of the sample after the calcination procedure. The BIT phase is easily identified.
In Fig. 4A, one has the XRD of the chitosan membrane, where two peaks were observed: one is at 11.5° and the other at 18.2°. These two peaks are related to two different types of crystals: crystal (1) and crystal (2) [8]. The first peak at 11.5° is related to crystal (1) having unit cell of a ⫽ 7.76,b⫽10.91,c⫽10.30 (Å),⫽ 90°. The unit cell size of crystal (1) is larger than that of crystal (2). The unit cell of crystal (1) consists of two monomer units along the main chain axis. The peak at 18.2° is related to crystal (2) in the chitosan membrane. The unit cell of crystal (2) is of a ⫽ 4.4,b⫽10.0,c⫽10.30 (Å), and⫽ 90°.
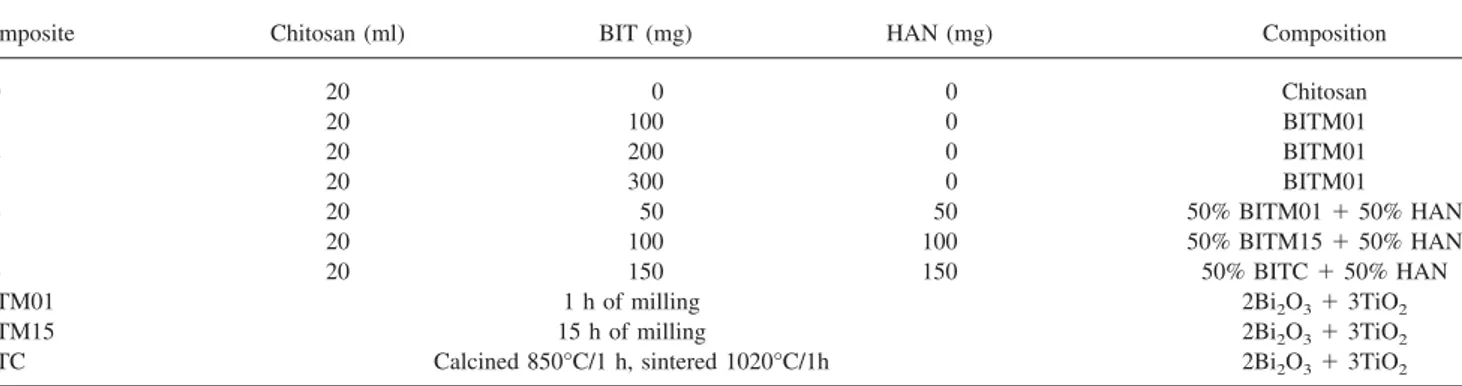
TABLE 1. Composites chemical procedure of preparation.
Composite Chitosan (ml) BIT (mg) HAN (mg) Composition
Q0 20 0 0 Chitosan
Q1 20 100 0 BITM01
Q2 20 200 0 BITM01
Q3 20 300 0 BITM01
Q4 20 50 50 50% BITM01⫹50% HAN
Q5 20 100 100 50% BITM15⫹50% HAN
Q6 20 150 150 50% BITC⫹50% HAN
BITM01 1 h of milling 2Bi2O3⫹3TiO2
BITM15 15 h of milling 2Bi2O3⫹3TiO2
BITC Calcined 850°C/1 h, sintered 1020°C/1h 2Bi2O3⫹3TiO2
In Table 1, one has a complete description of the studied samples in this article. All the composites are indicated by the symbols Q0 to Q6. Q0 is the film of pure chitosan. The films Q1 to Q3 are films prepared with the 1 h milled BIT sample (BITM01) with different amount of BITM01 (100, 200, and 300 mg, respectively). In Fig. 4B, we have the XRD for the composites Q1, Q2, Q3 of Table 1, and also for the BITM01, Q0 (chistosan), TiO2and Bi2O3as the
precur-sors elements for the composites films. The Q0 amorphous phase is contributing to the broadening of the diffraction peaks associated to BITM01 in Q1, Q2, and Q3. We can note the presence of TiO2 and Bi2O3 in Q2 and Q3 as a
result of the small BIT milling time for the BITM01 (see Fig. 2).
Figure 5 shows the XRD for the last three composites Q4, Q5, and Q6 (see Table 1). The XRD associated to sample Q6 has a good agreement with BITC. Peaks asso-ciated to HAN were not detected in Q5 and Q6. We believe that diffraction efficiency is higher for the BIT phase. This is the reason that Q6 was taken to be the central composite of this work. As will be discussed later, Q6 possesses the highest dielectric constant.
FIG. 4. (A) XRD of the chitosan film (Q0), (B) XRD for the Q1, Q2, Q3 composites. Q0 is the XRD for the commercial chitosan.
For the samples Q4 and Q5, the peak around 30° is associated to the phase BITM01 and BITM15, respectively. For the Q4 sample, a broad diffraction region around 31.7° is present and should be associated to the HAN phase.
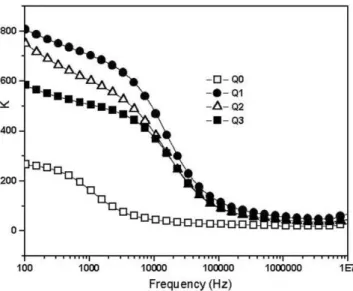
Dielectric Measurements
In Fig. 6, we have the study of the dielectric constant for the Q0, Q1, Q2, and Q3 samples. The dielectric constant decreases with the increase of frequency. The same occurs in Fig. 7 with Q4, Q5, and Q6. Table 2 shows some values of dielectric constant and dielectric loss at 100 Hz, 1 KHz, and 1 MHz. The pure chitosan film presents the lowest value for the dielectric constant (see Fig. 6 and Table 2). The Q6 sample presented the highest dielectric constant around 3,360 at 100 Hz. This composite film is presenting a quite
high value for the dielectric constant even when compared with the BIT ceramic (BITC),K⫽288.
For a composite material, the interface effects are present and could lead to a nonlinear behavior of the dielectric constant. For screen printed composite films, the composite material phase could present higher value for the dielectric constant compared with the pure phases of the composite [9]. In Figs. 6 and 7, we consider the interface effect between the bulk sample and the metallic electrode that is also present at low frequencies.
With the increase of the frequency one has a strong decrease of the dielectric constant for all the composites. For frequencies around 1 MHz, all the composites present values of the dielectric constant below the value of the ceramic sample BITC (K⫽159). The observed loss of the composite ferroelectric films could be useful for polarized bandages, promoting fast blood coagulation. In Fig. 8, the dielectric loss is shown as function of frequency. In Table 2, the BITC bulk dielectric constant is also presented for comparison.
In Fig. 8, one can also observe a peak in the loss as a function of the frequency. For all the composite samples, this peak is around 100 KHz. For sample Q0 (pure chi-FIG. 6. Dielectric constant with frequency for the Q0 trough Q3
com-posites.
FIG. 7. Dielectric constant with frequency for the Q4 trough Q6 com-posites.
TABLE 2. Electrical measurements (dielectric constant and loss)of the composites at 100 Hz, 1 KHz, and 1 MHz.
Composite
Thickness
(m) K (100 Hz)/D K (1 kHz)/D K (1 MHz)/D
Q0 48 265.1/0.20 166.1/0.61 20.3/0.18
Q1 90 806.5/0.18 705.3/0.14 56.4/0.51
Q2 90 583.6/0.20 505.7/0.12 42.9/0.53
Q3 100 725.1/0.27 602.1/0.19 43.0/0.53 Q4 128 786.5/0.63 516.9/0.30 50.1/0.46 Q5 110 559.4/0.24 469.3/0.18 51.8/0.41 Q6 90 3359.9/1.45 1159.5/0.94 46.5/0.53 BITC 500 288.1/0.62 217.4/0.24 159.0/0.027
tosan), this peak is located at a lower frequency (around 4 KHz). We believe that this peak should be associated to a dielectric relaxation of the polymer network (4 KHz). The crystalline phases, introduced in the matrix, interact with the polymer matrix, leading to a new relaxation frequency. We have just started new experiments to study the relaxation phenomena as function of the sample temperature.
Scanning Electron Microscopy
The SEM of the Q6 composite is shown in Fig. 9. As noted, there are some regions without crystalline phases. The SEM also show some cylinders, those attributed to the crystalline phases, strongly connected with our dielectric results.
CONCLUSIONS
In this work, composite films by combining chitosan (deacetylated degree, 90%) solution and two crystalline
materials, HAN and BIT, were performed. This new com-posites has not been reported in any literature. For the Q6 composite containing 50%/50%-hydroxyapatite (Ca10(PO4)6
(OH)2)-BIT respectively, a highest dielectric constant is
achieved. The Q6 sample, with the highest BIT and HA concentration, presents the highest dielectric constant around 3,300 at 100 Hz. This composite film is presenting a quite high value for the dielectric constant even when compared with the BITC,K⫽288. With the increase of the frequency, one has a strong decrease of the dielectric constant for all the composites. For frequencies around 1 MHz, all the composites present values of the dielectric constant below the value of the ceramic sample BITC (K⫽159). The composites were not polarized, and tests in vivo were not performed, this will be done in a future work.
REFERENCES
1. M.N. Taravel,Biomaterials,16(11), 865 (1995).
2. M.R. Bet, G. Goissis, and C.A. Lacerda,Biomacromolecules, 2(4), 1074 (2001).
3. L.L. Hench and J. Wilson,Bioceramics,1(1), 1 (1993). 4. W.L. Liua, H.R. Xia, H. Hand, and X.Q. Wang, J. Cryst.
Growth,12, 815 (1987).
5. C. Silva, D. Thomazini, A.G. Pinheiro, F. Lanciotti Jr., J.M. Sasaki, J.C. Go´es, and A.S.B. Sombra,J. Phys. Chem. Solids, 63(9), 1745 (2002).
6. Joint Committee on Powder Diffraction Standards (JCPDS), International Center for Diffraction Data, PA, USA (1995). 7. Estudo das Propriedades O´ pticas, Ele´tricas, e Te´rmicas da
Hidroxiapatita Obtida por Moagem de Altas Energia seus Com-po´sitos e Filmes Espessos, Cle´ber Caˆndido da Silva, Ph.D. Thesis, Universidade Federal do Ceara (2003).
8. R.J. Samuels,J. Polym. Sci. Polym. Phys.,19, 1081 (1981). 9. P.B.A. Fechine, A.F.L. Almeida, F.N.A. Freire, M.R.P. Santos,
R. Jimenez, J. Mendiola, and A.S.B, Sombra, Mater. Chem. Phys.,96, 402 (2006).