FUSION OF MULTI PRECURSORS EARTHQUAKE PARAMETERS TO ESTIMATE THE
DATE, MAGNITUDE AND AFFECTED AREA OF THE FORTHCOMING POWERFUL
EARTHQUAKES
M. Akhoondzadeh* and M.R. Saradjian
Remote Sensing Division, Surveying and Geomatics Engineering Department, University College of Engineering, University of Tehran, Iran – ([email protected])
Keywords: Hazards, earthquake, precursor, prediction, integration, satellite data, ionosphere. ABSTRACT:
Since not any individual precursor can be used as an accurate stand alone means for the earthquake prediction, it is necessary to integrate different kinds of precursors. The precursors selected for analysis in this study include electron and ion density, electron temperature, total electron content (TEC), electric and magnetic fields and land surface temperature (LST) several days before three strong earthquakes which happened in Samoa Islands, Sichuan (China) and Borujerd (Iran). The precursor’s variations were monitored using data obtained from experiments onboard DEMETER (IAP, ISL, ICE and IMSC) and Aqua-MODIS satellites. Regarding the ionospheric precursors, the geomagnetic indices Dst and Kp were used to distinguish pre-earthquake disturbed states from the other anomalies related to the geomagnetic activities. The inter-quartile range of data was utilized to construct their upper and lower bound to detect disturbed states outsides the bounds which might be associated with impending earthquakes. When the disturbed state associated with impending earthquake is detected, based on the type of precursor, the number of days relative to earthquake day is estimated. Then regarding the deviation value of the precursor from the undisturbed state the magnitude of impending earthquake is estimated. The radius of the affected area is calculated using the estimated magnitude and Dobrovolsky formula. In order to assess final earthquake parameters (which are date, magnitude and radius of the affected area) for each case study, using the median and inter-quartile range of earthquake parameters obtained from different precursors, the approximate bounds of final earthquake parameters are defined. For each studied case, a good agreement was found between the estimated and registered earthquake parameters.
1. INTRODUCTION
Many papers and special monographs have been published on satellite observation of perturbations associated with seismic activity (Hayakawa and Molchanov, 2002; Pulinets and Boyarchuk, 2004, Akhoondzadeh, 2011).
Earthquake is a dynamic phenomenon and usually happens because of crust displacement. When the earthquake happens, an energy transfer due to a break down between source and environment is made. These changes prior to the earthquake or along with it may have different physical and chemical affects on the lithosphere, atmosphere and ionosphere, and accordingly makes it possible to be detected. These variations of lithosphere, atmosphere and ionosphere parameters before the main earthquakes are considered as hint of impending earthquakes (earthquake precursors). Widespread researches on earthquake prediction over the last decades have resulted in the recognition of many earthquake precursors in the lithosphere, atmosphere and ionosphere.
Satellite experiments due to the vast coverage of the seismic zones of the Earth along with other sources of information are regarded as suitable means for earthquake study. They allow performing meaningful statistical studies with a much larger number of recorded events. If it can be shown that earthquake perturbations are real and systematic then they could be considered as short-term precursors, occurring between a few hours and a few days before the earthquakes.
1.1 Ionospheric precursors
The regional but substantially large-scale changes in atmospheric electricity over seismically active areas before the
seismic shock are transformed into the ionosphere by means of a large-scale electric field.
Pulinets et al. (2003) have shown that ionospheric anomalies have been observed in 73% of earthquakes with magnitude greater than 5Ms and 100% of earthquakes with magnitude greater than 6Ms within 5 days before the earthquake events. The ionospheric anomalies usually happen in D-layer, E-layer and F-layer, and they may be observed 1 to 10 days prior to the earthquake and stay until 1 to 2 days after the earthquake (Akhoondzadeh et al., 2011).
1.1.1 TEC Precursor
TEC is the integrated number of the electrons within the block between the satellite and receiver or between two satellites. To study TEC variations, data of GIM (Global Ionospheric Map) provided by NASA Jet Propulsion Laboratory (JPL) were used. The GIM is constructed into 5° × 2.5° (Longitude, Latitude) grid with a time resolution of 2 hours.
1.1.2 Ionospheric precursors provided by DEMETER data The French micro-satellite DEMETER was launched on June 29, 2004. The satellite's altitude is about 680 km and its measurements are made within 65°N to 65°E. One of DEMETER scientific objectives is to detect anomalous variations of electromagnetic waves, particle fluxes and thermal plasma parameters which could be related to seismic activity.
(Instrument Analyseur Plasma), and ISL (Instrument Sonde de Langmuir). ICE measures the three components of electric field in a frequency range from DC up to 3.5 MHz, IMSC measures the three components of magnetic field in ELF and VLF frequency ranges, IDP measures ionospheric particles energy (electron and proton), IAP measures temperature, density and velocity of plasma ions, and ISL measures temperature and density of plasma electrons.
1.2 Thermal anomaly precursor
Thermal anomaly is an unusual variation in surface temperature that occurs around 1-13 days prior to the earthquake with abrupt change in the temperature value of the order of 3-7° C or more and disappears a few days after the event. Some remote sensing satellites can measure the radiations coming from the earth in thermal bands and provide useful information prior the earthquakes. Due to their suitable temporal and spatial resolutions, thermal infrared bands of Aqua-MODIS data have been used.
2. APPLIED METHOD FOR ANOMALY DETECTION AND ESTIMATE EARTHQUAKE PARAMETERS In order to search for earthquake anomaly from precursor variations a reasonable range for precursor regular variations must be determined. The median and the inter-quartile range of data are utilized to construct their upper and lower bound in order to separate seismic anomalies from the background of natural variations (Liu et al., 2004).
The upper and lower bound of the mentioned range can be calculated using the following equations:
IQR
k
M
x
high=
+
×
(1)IQR
k
M
x
low=
−
×
(2)
k
IQR
M
x
Dx
k
x
x
x
low<
<
high−
<
=
−
<
(3)where
x
,x
high ,x
low ,M
,IQR
andDx
are the parameter value, upper bound, lower bound, median value, inter-quartile range and differential of x, respectively. According to this, if the absolute value of Dx is greater than k,(
Dx
>
k
), the behavior of the relevant parameter (x) isregarded as anomalous. According to Eq. (3),
(
Dx
k
)
k
p
=
±
100
×
−
/
indicates the percentage of parameter change from the undisturbed state.The results from our previous studies indicate that Dx value is relatively proportional to the earthquake magnitude (Akhoondzadeh, 2011). For instance, in large earthquakes with a Dx value between 2 and 3, the magnitude value (MW) is
estimated to be around between 7 and 8. The earthquake magnitude estimation based on Dx value is shown in Table 1. The radius of affected area can be estimated using the
Dobrovolsky formula:
R
=
10
0.414M−1.696, where R is the radius of the earthquake preparation zone, and M is the earthquake magnitude (Dobrovolsky et al., 1989).Earthquake magnitude
Dx
valueMW < 6
Dx
16 MW 7
1
Dx
27 MW 8
2
Dx
38 MW
3<
Dx
Table 1. Estimation of the earthquake magnitude.
Based on previous studies related to anomaly detection before strong earthquakes mentioned in Table 2, the earthquake anomalies may be observed 1 to 13 days prior to the earthquake. If Dx value of a given day is greater than a predefined threshold then based on the type of precursor, the earthquake date is estimated according to the relation
σ
µ
+
2
.
5
×
, (i.e. the fourth column) whereµ
and σ are the mean and standard deviation of values of the anomaly observation day relative to the earthquake day (i.e. the third column) (Akhoondzadeh, 2011).In order to assess final earthquake parameters (which are date, magnitude and radius of the affected area) for each case study, using the median and inter-quartile range of earthquake parameters obtained from different precursors, the approximate bounds of final earthquake parameters are defined. For instance, the date of impending earthquake is calculated based on
M
±
IQR
, whereM
andIQR
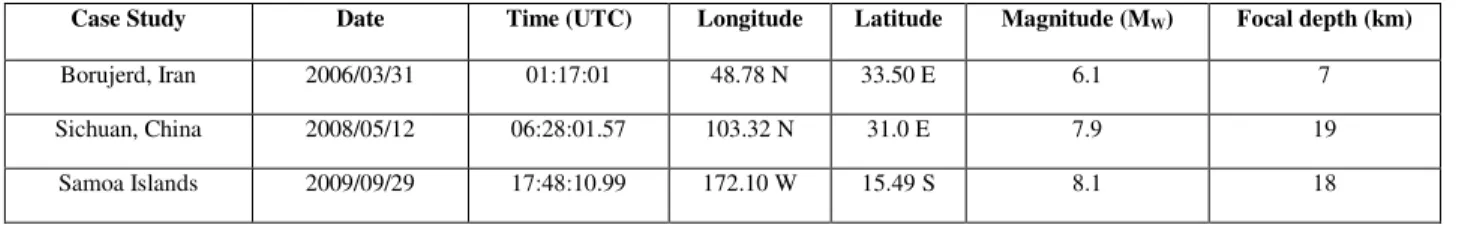
are respectively the median and inter-quartile range of the predicted values of the earthquake date for all precursors (Akhoondzadeh, 2011).3. OBSERVATIONS AND CASE STUDIES In order to clear up uncertainty to earthquake anomaly detection, our study is based on a few types of precursors, sensors and case studies. Using visual inspection in seismic databases three earthquakes which happened in Samoa Islands, Sichuan (China) and Boroujerd (Iran) have been incorporated in this analysis. Table 3 indicates some characteristics of these earthquakes.
3.1 Samoa Islands earthquake
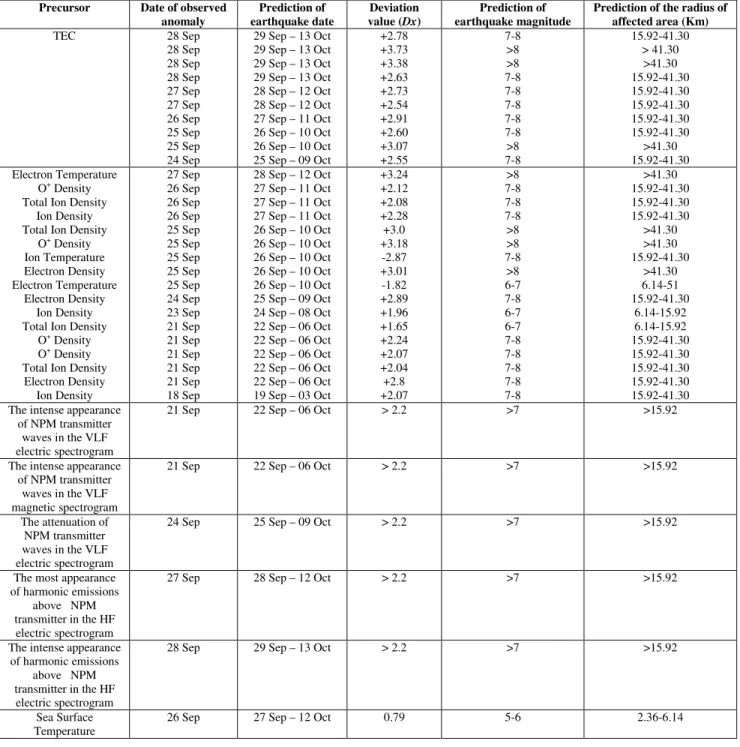
In Samoa Islands, the largest earthquake so far, took place at 06:48:11 LT on 29 Sep 2009 with a Magnitude Mw=8.1. Table 4 illustrates the observed earthquake precursors concerning Samoa earthquake.
Table 2. Estimation of the earthquake date.
Table 3. List of the earthquakes selected in this study (reported by http://earthquake.usgs. gov/)
Anomalous TEC variations of the order of 2.55 began on 24 Sep 2009. Based on proposed method, this anomaly indicates that an earthquake with a magnitude between 7 and 8 would have been happened between 25 Sep and 9 Oct 2009 and the radius of affected area would have been between 15.92 and 41.30 Km. The TEC anomaly on 28 Sep 2009 was expanded and amplified with a maximum value reaching 3.73 at 03:00 LT. For Dx=3.73 the magnitude of impending earthquake, which would have been occurred between 29 Sep and 13 Oct 2009, is estimated to be greater than Mw=8.0. Therefore, the radius of affected area is estimated to have been greater than 41.30 km.
Table 4 also illustrates variations of different parameters extracted from DEMETER experiments data over Samoa region. An increase in total ion density is clearly observed at ~10:30 LT on 25 Sep 2009. Variations of total ion density clearly exceed the upper bound of the order of 67% (Akhoondzadeh et al., 2010a). This precursor indicates that an earthquake with a magnitude greater than Mw=8.0 would have been occurred between 26 Sep and 10 Oct 2009. Similar to this, another unusual behavior is seen in electron density variations, when it reaches a maximum value, at ~10:30 LT, and exceeds the upper bound of the order of 67% on 25 Sep 2009. Because of the inverse relation between electron density and electron temperature, observed anomaly in electron density can be acknowledged by the electron temperature variations. Table 4 indicates that electron temperature has reached to its minimum value (Dx=-1.82) at ~10:30 LT, on 25 Sep 2009. This anomaly indicates that an earthquake with a magnitude between 6 and 7 would have been happened between 26 Sep and 10 Oct 2009. Irregularities of electron density also occurred at ~22:30 LT, 18, 21, 24 and 26 Sep 2009 that among them, the maximum irregularity intensity (i.e. 60.5%) was observed on 24 Sep 2009. According to this anomaly an earthquake with a magnitude between 7 and 8 would have been happened between 25 Sep
and 9 Oct 2009 and the radius of affected area to have been between 15.92 and 41.30 km.
Table 4 represents the intense appearance of the NPM transmitter waves in the VLF electric spectrogram on 21 Sep 2009. This strong electromagnetic enhancement of the VLF transmitter wave is due to the broadening of the spectral component at the transmitter frequency. This broadening is enhanced when the VLF wave crosses ionospheric irregularities (Bell and Ngo, 1988). This sharp appearance is also seen in the VLF magnetic spectrogram at the same time (Akhoondzadeh et al., 2010b). These earthquake precursors extracted using ICE and IMSC experiments indicate that an earthquake with a magnitude greater than Mw=7, would have been happened between 22 Sep and 6 Oct 2009. Table 4 also represents the attenuation of the NPM transmitter signals when they crossed the disturbed ionosphere on 24 Sep 2009. This fading of the signal can be associated to an increase of the ionospheric density because during the ionospheric propagation the signal attenuation is directly proportional to the plasma density (Cannon and Bradley, 2003). The analysis of HF electric spectrogram shows the intense appearance of harmonic emissions above NPM transmitter on 28 Sep 2009 (Akhoondzadeh et al., 2010b).
The final earthquake parameters including the date, magnitude and radius of affected area are estimated using the earthquake parameters deduced from different precursors. The bounds of the final impending earthquake parameters are calculated using the median and inter-quartile range of earthquake parameters estimated using different precursors. In this case study, it is predicted that an earthquake would have been happened with a magnitude between 7 and 8, on a date between 29 September and 6 Oct 2009, and in an affected area of radius between 15.92 and 41.30 Km. The Samoa earthquake actually happened on 29 September 2009 with a magnitude Mw=8.1.
Precursor Reference
Anomaly observation day relative to the earthquake
day
Estimated earthquake day relative to the observation day
Ionospheric Zhao et al., 2008 Liu et al., 2004 Pulinets et al., 2003 Akhoondzadeh et al., 2010a, 2010b Akhoondzadeh and Saradjian, 2010
3 4 5 11
8
15
Thermal Ouzounov and Freund, 2004 Saraf and Choudhury, 2005a
Choudhury et al., 2006 Pulinets et al., 2006 Saraf and Choudhury, 2005b
6 13
7 7 8
16
Case Study Date Time (UTC) Longitude Latitude Magnitude (MW) Focal depth (km)
Borujerd, Iran 2006/03/31 01:17:01 48.78 N 33.50 E 6.1 7
Sichuan, China 2008/05/12 06:28:01.57 103.32 N 31.0 E 7.9 19
Prediction of the radius of affected area (Km) Prediction of
earthquake magnitude Deviation
value (Dx)
Prediction of earthquake date Date of observed
anomaly Precursor 15.92-41.30 > 41.30 >41.30 15.92-41.30 15.92-41.30 15.92-41.30 15.92-41.30 15.92-41.30 >41.30 15.92-41.30 7-8 >8 >8 7-8 7-8 7-8 7-8 7-8 >8 7-8 +2.78 +3.73 +3.38 +2.63 +2.73 +2.54 +2.91 +2.60 +3.07 +2.55 29 Sep – 13 Oct
29 Sep – 13 Oct 29 Sep – 13 Oct 29 Sep – 13 Oct 28 Sep – 12 Oct 28 Sep – 12 Oct 27 Sep – 11 Oct 26 Sep – 10 Oct 26 Sep – 10 Oct 25 Sep – 09 Oct 28 Sep 28 Sep 28 Sep 28 Sep 27 Sep 27 Sep 26 Sep 25 Sep 25 Sep 24 Sep TEC >41.30 15.92-41.30 15.92-41.30 15.92-41.30 >41.30 >41.30 15.92-41.30 >41.30 6.14-51 15.92-41.30 6.14-15.92 6.14-15.92 15.92-41.30 15.92-41.30 15.92-41.30 15.92-41.30 15.92-41.30 >8 7-8 7-8 7-8 >8 >8 7-8 >8 6-7 7-8 6-7 6-7 7-8 7-8 7-8 7-8 7-8 +3.24 +2.12 +2.08 +2.28 +3.0 +3.18 -2.87 +3.01 -1.82 +2.89 +1.96 +1.65 +2.24 +2.07 +2.04 +2.8 +2.07 28 Sep – 12 Oct
27 Sep – 11 Oct 27 Sep – 11 Oct 27 Sep – 11 Oct 26 Sep – 10 Oct 26 Sep – 10 Oct 26 Sep – 10 Oct 26 Sep – 10 Oct 26 Sep – 10 Oct 25 Sep – 09 Oct 24 Sep – 08 Oct 22 Sep – 06 Oct 22 Sep – 06 Oct 22 Sep – 06 Oct 22 Sep – 06 Oct 22 Sep – 06 Oct 19 Sep – 03 Oct 27 Sep 26 Sep 26 Sep 26 Sep 25 Sep 25 Sep 25 Sep 25 Sep 25 Sep 24 Sep 23 Sep 21 Sep 21 Sep 21 Sep 21 Sep 21 Sep 18 Sep Electron Temperature
O+ Density Total Ion Density
Ion Density Total Ion Density
O+ Density
Ion Temperature Electron Density Electron Temperature
Electron Density Ion Density Total Ion Density
O+ Density
O+ Density
Total Ion Density Electron Density
Ion Density
>15.92 >7
> 2.2 22 Sep – 06 Oct
21 Sep The intense appearance
of NPM transmitter waves in the VLF electric spectrogram
>15.92 >7
> 2.2 22 Sep – 06 Oct
21 Sep The intense appearance
of NPM transmitter waves in the VLF magnetic spectrogram
>15.92 >7
> 2.2 25 Sep – 09 Oct
24 Sep The attenuation of
NPM transmitter waves in the VLF electric spectrogram
>15.92 >7
> 2.2 28 Sep – 12 Oct
27 Sep The most appearance
of harmonic emissions above NPM transmitter in the HF
electric spectrogram
>15.92 >7
> 2.2 29 Sep – 13 Oct
28 Sep The intense appearance
of harmonic emissions above NPM transmitter in the HF
electric spectrogram
2.36-6.14 5-6
0.79 27 Sep – 12 Oct
26 Sep Sea Surface
Temperature
Table 4. Different precursors concerning Samoa earthquake.
3.2 Sichuan, China earthquake
On 12 May 2008 at 14:28:01.57 LT a strong earthquake of magnitude Mw=7.9 occurred in southwest China (see Table 3). Some strong anomalies have been observed on 2 May (6:00 LT), 8 May (2, 4, 6 LTs), 9 May (12, 14, 24 LTs), 10 May (12, 14 LTs) and 11 May (12 LT) 2009. Among all above pre-earthquake anomalies, the anomalies observed on 9 and 10 May at 12:00 LT, were the strongest (the observed TEC exceeds the lower bound by -24%) (Akhoondzadeh et al., 2010a). These strong anomalies indicate that an earthquake
Prediction of the radius of affected area (Km) Prediction of earthquake
magnitude Deviation value
(Dx)
Prediction of earthquake date Date of observed
anomaly Precursor
15.92-41.30 >41.30 >41.30 >41.30 15.92-41.30 15.92-41.30 15.92-41.30 15.92-41.30 15.92-41.30 15.92-41.30 7-8
>8 >8 >8 7-8 7-8 7-8 7-8 7-8 7-8 -2.59
-03.10 -03.07 -03.10 -2.92 -2.50 -2.69 -2.87 -2.68 -2.55 12 May – 26 May
11 May – 25 May 11 May – 25 May 10 May – 24 May 10 May – 24 May 10 May – 24 May 9 May – 23 May 9 May – 23 May 9 May – 23 May 3 May – 17 May 11 May
10 May 10 May 9 May 9 May 9 May 8 May 8 May 8 May 2 May TEC
15.92-41.30 15.92-41.30 15.92-41.30 6.14-15.92 6.14-15.92 6.14-15.92 15.92-41.30 15.92-41.30 6.14-15.92 15.92-41.30 15.92-41.30 15.92-41.30 >41.30 15.92-41.30 7-8
7-8 7-8 6-7 6-7 6-7 7-8 7-8 6-7 7-8 7-8 7-8 >8 7-8 -2.18
-2.28 -2.05 +1.98 +1.73 -1.86 -2.40 -2.26 -1.70 +2.09 +2.37 +2.13 -3.22 +2.5 11 May – 25 May
11 May – 25 May 11 May – 25 May 11 May – 25 May 10 May – 24 May 10 May – 24 May 10 May – 24 May 11 May – 25 May 11 May – 25 May 4 May – 18 May 3 May – 17 May 3 May – 17 May 3 May – 17 May 2 May – 16 May 10 May
10 May 10 May 10 May 9 May 9 May 9 May 10 May 10 May 3 May 2 May 2 May 2 May 1 May O+ Density
Total Ion Density Ion Density Electron Temperature Electron Temperature Electron Density
O+ Density
Total Ion Density Electron Density Electron Density
O+ Density
Total Ion Density Electron Temperature Electron Temperature
Table 5. Different precursors concerning Sichuan earthquake (Akhoondzadeh, 2011).
reaches 15% and 29%, on 9 and 10 May 2009, respectively (Table 5). The variations of electron density also indicate an increase of the order of 39%, from the normal state on 3 May 2009 which is acknowledged by an anomaly in the total ion density of the order of 42%, at ~22:30 LT, on 2 May 2009 (Table 5). According to this anomaly an earthquake with a magnitude between 7 and 8 would have been happened between 3 and 17 May 2009 and the radius of affected area varies between 15.92 and 41.30 Km. The characteristics of other detected anomalies can be found in Table 5. The integration of earthquake parameters retrieved from different precursors indicates that an earthquake with a magnitude between 7 and 8 would have been happened between 12 and 20 May 2009. The radius of affected area is estimated to be between 15.92 and 41.30 Km.
3.3 Borujerd, Iran earthquake
Occurrence of more than 130 strong earthquakes (Mw > 7.5) in the past centuries and almost daily earthquakes of magnitude 3.0 in Iran makes it as a severe earthquake prone region. In Borujerd, an earthquake with a magnitude Mw=6.1 took place at 01:17:01 LT on 31 Mar 2006 (see Table 3). The LST variations exceed the predefind bounds on 25 March 2006 (Saradjian and Akhoondzadeh, 2010). These anomaly indicates that an earthquake of magnitude around 6 would have been happened between 26 Mar and 10 Apr 2005. The IAP experiement measurements indicate that total ion density reaches to its maximum value on 30 Mar 2006 and that ion temperature exceeds the lower bound on 29 Mar 2006 (Table 6) (Akhoondzadeh, 2011). By inspection of predicted parameters obtained from different precursors, it is predicted that an earthquake of magnitude between 6 and 7 would have been happened between 01 and 08 Apr 2006.
4. CONCLUSIONS
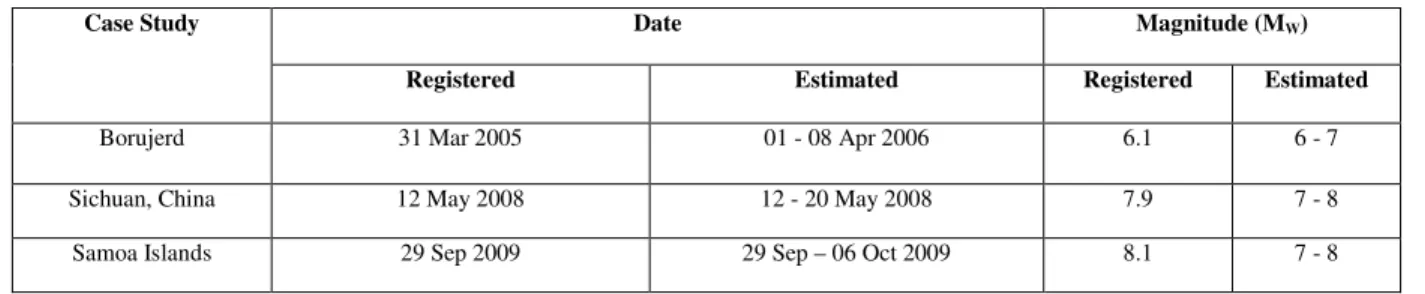
In order to detect disturbed states that might be associated to impending earthquake, the variations of different earthquake precursors regarding the three earthquakes have been analyzed in this study. It should be pointed out that one of the aims of this study is to integrate capabilities of the different earthquake precursors in appropriately detection of actual earthquake anomalies. For each precursor the date, magnitude and radius of affected area parameters concerning the impending earthquake were estimated. By integrating the earthquake parameters resulted from all precursors the final earthquake parameters were estimated. In Samoa and Sichuan earthquakes the estimated date of impending earthquake coincides exactly with registered date of earthquake (Table 7). It can be related to the different precursors (i.e. 14 and 6 precursors for Samoa and Sichuan cases, respectively) analyzed in these studied cases. It means that the number and diversity of earthquake precursors can be leaded to precise estimation of earthquake parameters. The low number of precursors in case of Bourujerd has been resulted to low precise estimation of earthquake parameters (Table 7). It should be point out that earthquake anomaly can be hidden in the high magnetic activity periods. Therefore only the pre-seismic plasma anomalies in geomagnetic quiet periods have been investigated in this study. However, it is necessary to take into account that the ionosphere has complicated behavior even under quiet geomagnetic condition and the measured parameters sometimes display variations in quiet seismic condition that can be associated to other unknown factors. The seismic anomalies represented in this paper are promising for the short term prediction but attention has to be paid that further investigation is required to obtain a very accurate regional model of quiet time for lithosphere, atmosphere and ionosphere to discriminate seismic precursors from the background of daily variations.
Table 6. Different precursors concerning Borujerd earthquake.
Table 7. Case studies accompanied by the registered and estimated earthquake parameters (Akhoondzadeh, 2011).
3.5 Acknowledgements
The authors thank M. Parrot the PI of IMSC, J. J. Berthelier the PI of IAP and ICE and J.P. Lebreton the PI of ISL for the use of the data. The authors would like to acknowledge CNRS/LPC2E for the DEMETER data, NASA Jet Propulsion Laboratory for the TEC data and NOAA for the geomagnetic indices.
3.6 References
Akhoondzadeh, M., 2011. Comparative study of the earthquake precursors obtained from satellite data. PhD thesis, University of Tehran, Surveying and Geomatics Engineering Department, Remote Sensing Division.
Akhoondzadeh, M., Parrot, M., and Saradjian, M. R., 2010a. Electron and ion density variations before strong earthquakes (M>6.0) using DEMETER and GPS data. Nat. Hazards Earth Syst. Sci., 10, pp. 7– 18.
Akhoondzadeh, M., Parrot, M., and Saradjian, M. R., 2010b. Investigation of VLF and HF waves showing seismo-ionospheric anomalies induced by the 29 September 2009 Samoa earthquake (Mw=8.1), Nat. Hazards Earth Syst. Sci., 10, pp. 1061– 1067.
Akhoondzadeh, M., and Saradjian, M. R., 2010. TEC variation analysis concerning Haiti (January 12, 2010) and Samoa (September 29, 2009) earthquakes, Advances in Space Research, 47, pp. 94-10.
Bell, T. F., and Ngo, H. D., 1988. Electrostatic waves stimulated by coherent VLF signals propagating in and near the inner radiation belt. Journal of Geophysical Research, 93, pp. 2599–2618.
Cannon, P. S., and Bradley, P.A., 2003. Ionospheric propagation, in Propagation of Radio waves. 2nd edition, ed. by L. W. Barclay, The Institution of Electrical Engineers, London, Chapter 16, pp. 313-334.
Choudhury, S., Dasgupta, S., and Saraf, A., 2006. Remote sensing observations of pre-earthquake thermal anomalies in Iran. International Journal of Remote Sensing, 27 (20), pp. 4381-4396.
Dobrovolsky, I. P., Gershenzon, N. I., and Gokhberg, M. B., 1989. Theory of electrokinetic effects occurring at the final stage in the preparation of a tectonic earthquake. Physics of the Earth and Planetary Interiors, 57, pp. 144-156.
Hayakawa, M. and Molchanov, O. A., 2002. Seismo- Electromagnetics: Lithosphere-Atmosphere-Ionosphere Coupling. Terra Scientific Publishing Co., Tokyo, 477. Liu, J. Y., Chuo, Y. J., Shan, S. J., Tsai, Y. B., Pulinets, S. A., and Yu, S. B., 2004. Pre-earthquake-ionospheric anomalies registered by continuous GPS TEC. Ann. Geophys., 22, pp. 1585-1593.
Ouzounov, D., and Freund, T., 2004. Mid-infrared emission prior to strong earthquakes analyzed remote sensing data,
Advances in Space Research, 33, pp. 268-273.
Pulinets, S. A., and Boyarchuk, K. A., 2004. Ionospheric Precursors of Earthquakes. Springer, Berlin, 288.
Pulinets, S. A., Legen, A. D., Gaivoronskaya, T. V., and Depuev, V. K., 2003. Main phenomenological features of ionospheric precursors of strong earthquakes. J. Atmos. Sol-Terr. Phy., 65, pp. 1337-1347.
Pulinets, S. A., Ouzounov, D., Ciraolo, L., Singh, R., Cervone, G., Leyva, A., Dunajecka, M., Karelin, A. V., Boyarchuk, K. A., and Kotsarenko, A., 2006. Thermal, atmospheric and ionospheric anomalies around the time of the Colima M7.8 earthquake of 21 Jan. 2003. J. Ann. Geophys., 24, pp. 835-849. Saradjian, M. R., and Akhoondzadeh, M., 2011. Thermal anomalies detection before strong earthquakes (M>6) using Interquartile, Wavelet and Kalman filter methods. Nat. Hazards Earth Syst. Sci., 11, pp. 1099– 1108.
Saraf, A. K., and Choudhury, S., 2005a. NOAA-AVHRR detects thermal anomaly associated with 26 january, 2001 Bhuj earthquake, Gujarat, India. International Journal of Remote Sensing, 26, 1065-1073.
Saraf, A. K., and Choudhury, S., 2005b. Satellite detects surface thermal anomalies associated with the Algerian earthquakes of May 2003. International Journal of Remote Sensing, 26, pp. 2705-2713.
Zhao. B., Wang. M., Yu, T., Wan, W., Lei, J., and Liu, L., 2008. Is an unusual large enhancement of ionospheric electron density linked with the 2008 great Wenchuan earthquake?, J. Geophys. Res., pp. 113, 1-6.
Prediction of the radius of affected area (Km) Prediction of earthquake
magnitude Deviation
value (Dx)
Prediction of earthquake date
Date of observed anomaly Precursor
6.14-15.92 6-7
1.31 26 Mar – 10 Apr
25 Mar LST
6.14-15.92 6.14-15.92 6-7
6-7 +1.54
1.25 31 Mar – 14 Apr
30 Mar – 13 Apr 30 Mar
29 Mar Total Ion Density
Ion Temperature
Date Magnitude (MW)
Case Study
Registered Estimated Registered Estimated
Borujerd 31 Mar 2005 01 - 08 Apr 2006 6.1 6 - 7
Sichuan, China 12 May 2008 12 - 20 May 2008 7.9 7 - 8