I.J.M.G.E., University of Tehran, Vol. 46, No. 1, June 2012, PP. 81-86 81
Amplitude versus Offset (AVO) Technique for Light
Hydrocarbon Exploration: A Case Study
Roohollah Parvizi1, Gholam Hossain Norouzi2*and Fereydoun Sahabi2 1Instructor, Islamic Azad University, Qeshm branch
2School of Mining, College of Engineering, University of Tehran
(Received 25 April 2011, Received in Revised form 27 August 2011, Accepted 28 November2011)
Abstract
AVO as a known methodology is used to identify fluid type and reservoir lithology in subsurface exploration. Method discussed in this paper, consists of three stages, including: Direct modeling, Inverse modeling and Cross plot interpretation. By direct modeling we can clarify lithology or fluid dependent attributes. Analysis performed using both P-P and P-Sv attributes. Inverse modeling deals with real data and is fed by the results of direct modeling to identify the light hydrocarbon (gas) zones. The main role of cross plot interpretation is to confirm the inverse modeling results and consequently increasing validity of performed analysis. Using Hodogram – cross plot, makes possible to identify hydrocarbon zone even in small scales. This methodology was applied in Gorgan Plain Southeast Caspian, northern Iran. It was concluded that: fluid factor, SIGN, and Poisson reflectivity are fluid dependent attributes. It was also defined that normal incidence reflectivity and P-wave impedance reflectivity are lithology dependent. Inverted sections of fluid-dependent attributes defined the existence two light hydrocarbon accumula- tion under the Tertiary-Cretaceous unconformity in the North Gorgan Plain. Two wet and gaseous zones are also confirmed by cross plot.
Keywords: Amplitude Versus Offset, Direct Modeling, Inverse Modeling, Hodogram-Cross Plot, Attributes, Light Hydrocarbon, Gorgan Plain
Introduction
The reflection amplitude plays main role in the AVO method. With taking into account that bright points in stacked section may have been created by lithological effects, should be analyzed in pre-stacked sections and as an AVO analysis. After the bright point technology has been introduced as a detecting tool in gaseous hydrocarbon reservoir, Ostrander [1] showed that presence of gas in encircled sands between shales causes significant change in amplitude of reflected seismic waves in pre-stacked data. AVO analysis was carried out in different methods such as direct modeling, inverse modeling, and cross plot [2] .The combined method which is introduced here has classified different states of amplitude changes with offset. Verm and Hilterman [3] proposed another simple approximation of Zeopritz equations which amplifies the cross plot methods. Granger [4], Garotta [5], Gassaway [6] and Frasier [7] have discussed about application of converted
and non-converted waves related to light hydrocarbon explorations. Keho [8] has presented some subjects related to application of hodogram in AVO analysis. Galen et al. [9] describe a workflow for minimizing missed potential though processing tools and interpretation techniques designed to anomalies zones. Robert and Kendall [10] have discussed about anomalies based on converted attributes. Neil et al. [11] have discussed about seismic analysis for detection of light hydrocarbons.
82 I.J.M.G.E., University of Tehran, Vol. 46, No. 1, June 2012
2. If in one method encountered with ambiguity, in that special case, we can replace the other combined methods. 3. If each of the proposed methods gives an invalid response and correctness of the responses were important (such as identification of a reservoir zone), we can examine its validity by other methods. 4. In proposed method, modeling and cross plot have been developed such that in the case of direct and inverse modeling, more attributes have been tested while converted attributes have also been involved in analysis. In previous works only gradient and intercepts was involved in cross plots. But in Gorgan Plain study, wide spectrum of attributes such as converted and non-converted ones have been plotted and acceptable results were obtained.
Introduction of AVO Method
AVO enables us to identify the type of fluid as well as lithology separation from fluid. This ability of AVO can be obtained using Aki-Richards [12] and Shuey [13] approximation, Gardner [14] and Castagna [15] equations, AVO attributes and relationship between Intercept and Gradient.
Methodology and Discussion in Gorgan Plain
The combined method introduced here, consists of direct and inverse modeling and cross plot. The aim of direct AVO modeling is identification of attributes which show better resolution of water and gas bearing reservoirs. Direct modeling requires making artifact CDPs, using density, sonic logs and shear wave velocity from well data. Using Gassman equations, proposed logs have been made in water saturated condition; consequently, we will be able to make CDPs in both water and gas saturated conditions. After making CDPs, using geological information and well reports, reservoir boundaries and water zones are been identified and attributes values are calculated along the
CDP section. Then, they are compared with their values at the top and bottom of the target zone. At this step, the characteristics of attributes were identified, and we managed to differentiate attributes affected by lithology from those affected by fluid or by both. The aim of inverse modeling process which is based on direct modeling results is to convert the real seismic data to seismic sections of different attributes that have physical concept. Therefore, input of inverse modeling is pre-stacked real data and its output is reflectivity coefficients. These coefficients are function of incidence angle, and are calculated by Zeopritz equations and other approximations. Concept of reflectivity is relative change in rock parameters.
Three main parts in calculating reflectivity coefficients are as follows:
1. Relative change in velocity of non-converted P-P.
2. Relative change in velocity of converted P-Sv.
3. Relative change in density.
Amplitude versus Offset... 83
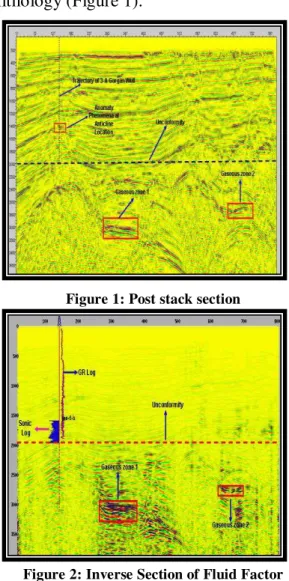
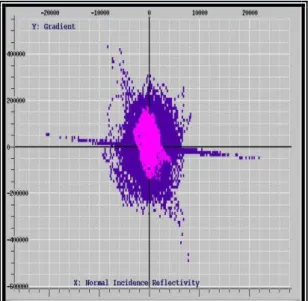
factor, Pseudo-Poisson Reflectivity, SIGN, Gradient, and Poisson Reflectivity attributes have higher ability to differentiate fluid from lithology and determination of type of fluid. Furthermore converted attributes (S-wave Impedance Reflectivity and S-wave Velocity Reflectivity) have higher ability to identify fluid from lithology with respect to non-converted attributes (P-wave Impedance Reflectivity and P-wave Velocity Reflectivity). We used the results of direct modeling and making the inverse fluid attributes section as inverse modeling. It was concluded that the main fluid accumulation occurred below Tertiary-Cretaceous unconformity and accumulation above the unconformity is negligible in the Gorgan Plain. Therefore, the observed bright spots in stacked section above the unconformity caused by lithology (Figure 1).
Figure 1: Post stack section
Figure 2: Inverse Section of Fluid Factor attribute
84 I.J.M.G.E., University of Tehran, Vol. 46, No. 1, June 2012
reservoir nature of these zones which have been made by inverse modeling. Also, linear relationship in Gradient - Normal Incidence Reflectivity cross plot in figure 6 proves the existence of water in sands under the zone 1. Now considering the reservoir nature of the zones 1and 2 and also water nature under the zone 1, and with taking into account attributes characteristic (as a result of direct modeling) we compare response of reservoir and non-reservoir in zone 1 using other attributes cross plot .Even, we will be able to identify litholog with relative validity in each required part of the seismic section with cross plot interpretation. Cross plot of P-wave velocity reflectivity versus S-wave velocity reflectivity in gaseous zone have dispersive points distribution while in water zone will have linear coincidence capability with positive polarity angle (Figures 7, 8). According to the geological reports and results of well logs cross plots, in primary parts of Gorgan-3A well (Fig.2) there are clay and shale and at the end part of it there is low shaly sand without fluid. At first we make the attributes cross plot of SIGN-Normal incidence reflectivity sections in area surrounding of the Gorgan-3A well in sand without fluid and shales and then in different subzones of zone1. Distribution of sand will be as same as zone 1 and section point's distribution of shales will be identical as top of the zone 1. Cross plot of Figure 9 shows the SIGN and Fluid Factor attributes plot. According to direct modeling results, these attributes indicate fluid. In Figure 9, point's distribution has regular trend and dispersion is lower with respect to previous cross plots. Also, point's distribution in P-wave Velocity Reflectivity-Intercept attributes cross plot (which have been resulted from direct modeling and is indication of lithology), have regular trend (Figure10).Thus, dispersion in point's distribution occurs in cross plot of attributes which at least one of them is indication of simultaneous lithology and fluid effect. In the other
word, point's dispersive distribution in these cross plots is caused by simultaneous effect of both lithology and fluid in these attributes amount. It should be noted that water does not cause point's dispersive distribution. Thus, this fluid should be gas or light hydrocarbon. Therefore, point's dispersive distribution in gaseous zone in cross plots indicates the high capability of this methodology.
Figure 3: Inverse Section of Gradient attribute
Figure 4: Inverse Section of Intercept (Normal Incidence Reflectivity) attribute
Conclusions
Amplitude versus Offset... 85
plots are examined by results of direct modeling and thus the validity of responses are controlled. Cross plot interpretation is able to investigate the validity of the responses of direct modeling related to identification of reservoir zones as well as is able to demonstrate a general sight relative to lithology type in each required part of seismic sections. Also, point's dispersive distribution in gaseous zone in cross plots has been proven and is indication of high capability of this methodology.
Figure 5: Crossplot between Gradient & Normal Incidence Incidence Reflectivity
(Gaseous Zone)
Figure 6: Crossplot between Gradient & Normal Reflectivity under zone1 (Wet Zone)
Figure 7: Crossplot between P -wave and S- wave Velocity Reflectivity under zone1
(Gaseous Zone)
Figure 8: Crossplot between P-wave and S-wave Velocity Reflectivity in sub zone1 (Wet Zone)
86 I.J.M.G.E., University of Tehran, Vol. 46, No. 1, June 2012
Figure10: Crossplot between P-wave Velocity and Normal Incidence Reflectivity
Recommendations
This methodology will have development capability. Thus, we can design it according to 3-D and 4-D conditions. In this article, analysis has been done by non-converted P-P waves. If we add the approximations of the converted P-Sv waves to analysis, the validity of attributes will increase and we will be able to estimate the hydrocarbon saturation.
Acknowledgments
We thank Mr. Mohades, Mr. Khorasani, Mr. Naeeni and Mr Maleki for their helps and support at whole steps of this research.
References
1 - Ostrander, W. J. (1984). “Plane-wave reflection coefficients for gas sands at non normal angles of incidence.”Geophysics, Vol. 49, PP. 1637-1648.
2- Rutherford, S.R. and Williams, R.H. (1989). “Amplitude-versus-offset variations in gas
sands.” Geophysics, Vol. 54, pp. 680-688.
3- Verm, R. Y. and Hilterman, F. (1995). “Lithology color-coded seismic sections the of AVO crossplotting to rock properties.”The Leading Edge, Vol.14, No.8, PP. 847-53.
4- Granger, P.Y. (1987). “Comparison of responses of compressional and converted waves on a gas sand.” 57th Annual International Meeting on Society of Exploration, Expanded
Abstracts, PP. 627–630.
5- Garotta, R. (1988). “Amplitude-versus-offset measurements involving converted waves.”
58th Annual International Meeting on Society of Exploration Geophysics, Expanded
Abstracts, PP.1357.
6- Gassaway, G.S. (1989). “Three-component AVO analysis.” 59th Ann. International
Meeting Society of Exploration,Geophysics, Expanded Abstracts, PP. 706–708.
7- Frasier, C.W. (1993). “Correlation and interpretation of P-P and P-SV data.” Zamora gas field, Yolo County, California, in Castagna, J.P. and Backus, M.M., Eds., Offset dependent
reflectivity Theory and practice of AVO analysis: Society of Exploration Geophysics, PP.
333–345.
8- Keho, T. H. (2000.) “The AVO hodogram: Using polarization to identify anomalies.”
Expanded abstracts, 2000 SEG Annual Convention, pp. 2-3.
9- Galen, T., Bruce, C., Alfred, B. and Victoria ,S. (2009). “Exploration Prospect Interpretation and Risking Using Modern Geophysical Technology- AVO Scanning- Large
Datasets and Little Time.”Offshore Technology Conference, Houston, Texas, pp.10-13.
10- Robert, R. and Kendall, J. (2011). “Shear-wave amplitude anomalies in south-central Wyoming.”Offshore Technology Conference, Houston, Texas, pp. 2-4.
11 - Neil, P., Emma, S. and Fiona, S. (2011). “Aspects Of Seismic Prospecting In Algeria.”
Society of Petroleum Engineers, Conference, Houston, Texas, pp. 3-5.
12- Aki, K. and Richards, P.G. (1980). “Quantitative seismology, theory and methods,
Volume 1, W.H. Freeman, San Francisco.
13- Shuey, R.T. (1985). “Asimplification of the Zoeppritz equations.” Geophysics, Vol. 50, PP. 609-614.
14- Gardner, G.H.F. (1979). “Formation velocity and density- the diagnostic basics for
stratigraphic traps.” Geophysics, Vol. 39, pp. 770-780.
15- Castagna, J.P. (1985). “Relationships between compressional-wave and shear-wave