Brazilian Journal of Physics, vol. 34, no. 2B, June, 2004 623
Numerical Simulation of the Optical Properties
of SiC/SiO
2
Quantum Dots
J. S. de Sousa, V. N. Freire, G. A. Farias,
Departamento de F´ısica, Universidade Federal do Cear´a, Campus do Pici, Caixa Postal 6030, 60455-900 Fortaleza, Cear ´a, Brazil
and E. F. da Silva Jr.
Departamento de F´ısica, Universidade Federal de Pernambuco, Cidade Universit´aria, 50670-901 Recife, Pernambuco, Brazil
Received on 27 March, 2003
We perform a theoretical investigation of the absorption and emission properties of quantum confined SiC/SiO2
spherical quantum dots, focusing on the the size-dependent emission and absorption spectra of an independent single dot. We observed strong oscillations in the absorption lines as a consequence of the interband transitions rules, and a blue-shift of the emission spectra lines with the decrease of the quantum dot diameter.
1
Introduction
Despite of the considerable achievements in the SiC growth technology over the recent years, several problems concern-ing the basic physical properties still stand. The electronic structure of SiC has been calculated by several mathematical methods including Orthogonalized Plane Wave [1], Empir-ical Pseudopotential [2], Density Functional Theory within the Local Density Approximation [3], among others. All these techniques predicts a high anisotropic nature of the band structure leading to a tensorial effective mass, which has been confirmed by cyclotron resonance measurements [4], and the consequences of this anisotropy on the overall electrical behavior of SiC is, up to now, far from being en-tirely understood. However, it was recently shown that the conduction band anisotropy plays an interesting role on the energy spectra of Si/SiO2nanocrystals, which consequently may affect the electrical and optical properties of devices [5]. In another recent work, the feasibility of green-to-blue light emission was explored with the calculation of the quan-tum confined exciton in SiC/SiO2quantum wires [6]. De-pending on the confinement dimension and interface width, different SiC polytypes may be used specifically for appli-cations in different spectral regions from green to ultraviolet emissions: the 3C-SiC polytype seems to be the best choice for green light emission, while 6H-SiC and 4H-SiC are more suitable for blue and blue-ultraviolet light emission, respec-tively.
In this paper, we aim into a better understanding of the optical absorption and emission spectra of SiC/SiO2 quan-tum dots (QD’s) by taking account of the tensorial nature of the effective mass of the system. Within the authors knowledge, SiC/SiO2 quantum dots were still not
synthe-sized to date, and therefore we aim also to anticipate and stimulate experimental work, on optical characteristics of the SiC/SiO2system with respect to quantum dot size and the the anisotropy of the SiC/SiO2system.
II - Numerical Model
Figure 1 exhibits the simulation unit cell used in this work. We focus on a single QD by assuming that adjacent QD’s are positioned far enough from each order in such way that the penetration of the wavefunctions into the oxide layer becomes negligible before overlapping with other lateral nanocrystal wavefunctions.
The Schrodinger equation is discretized using a finite-difference scheme in a tridimensional rectangular grid lead-ing to a sparse seven banded matrix, from which we extract the energy states and wavefunctions. The effective mass ap-proximation is used by taking into account the complicated anisotropic features of the SiC polytypes, in such way that the effective mass is no longer a number, but a tensor of first rank. Within this context, the Schrodinger equation to be solved has the following form:
[ ˆ∇TσMˆ (r)−1 ˆ
σ−1ˆ
∇+ ∆EC(r)]Ψi(r) =EiΨi(r) (1)
whereM(r)−1
is the 3x3 diagonal inverse effective mass tensor whose diagonal is given by m1(r)−1
, m2(r)−1 ,
m3(r)−
1
624 J.S. de Sousaet al.
G
K H M
L
A
k y k
x
k z
(a) (b)
X
Y
SiO 2 MATRIX
NANOCRYSTAL (c)
K X
X
X L G
W k
z
k y k
x
Figure 1. Schematics of the Brillouin zones for the 3C- (a) and Figure 1. Schematics of the Brillouin zones for the 3C- (a) and 4H-(b) SiC polytypes and the main symmetry points of both zones. It is also plotted the simulation unit cell containing a single QD (c).
energy minima. ∇ is the momentum operator represented by a column vector. The transformation matrixσˆ describes the rotation of the SiC crystallographic directions with re-spect to the dot axes. The quantity∆EC(r)accounts for the band gap discontinuity. Details on the computational model are given elsewhere [7].
The key parameters of the model discussed above are the directional effective masses of the ellipsoid of energy and their directions in the Brillouin zone. However, due to the variety of polytypes, SiC can be grown in three different crystalline structures: cubic(zincblend), hexagonal(wurzite) and rhombohedral. 4H-SiC is 100% hexagonal, 3C-SiC is 100% cubic, and the other types have a different degree of hexagonality. The band structure is highly anisotropic for all polytypes, and SiC has an indirect band gap with the min-ima of the conduction band localized in different points of the reciprocal space, depending on the crystalline structure of the polytype. For example, 4H-SiC has a minimum of energy at the highly symmetric pointM with the main axes of the energetic ellipsoid pointing toMΓ(m1),M K (m2) andM L (m3). Therefore, Schrodinger equation needs to be solved 6 times, one for each point M of the hexagonal Brillouin zone. Moreover, the ellipsoids of energy are ro-tated around the kz axis by increments 60owith respect to each other, and a different rotation operatorσˆin Eq. 1 needs to be assigned for each energy valley to match appropriate alignment with simulation cell axes (see Figure 1).
The calculations of the optical properties of the SiC QD’s is based on the Fermi’s golden rule, where the absorp-tion and emission spectra are proporabsorp-tional to the quantity:
Ru,lT (ω) =nln′
uW u,l
AB(ω)−n′lnuW u,l
EM(ω) (2) The equation above yields the net transition rate between a
lower l and an upper u confined states, and must be summed
over all six conduction band valleys, light and heavy holes bands, and subbands indexes. The quantitiesnu,l andn′
u,l indicates the occupation and de-occupation of the upper and
lower states, respectively. For higher temperatures, Fermi-Dirac statistics should be used. However, due to the low dimensionality of the structure, the energy levels inside the QD’s are reasonably well separated such that thermal fluc-tuation of the electron occupation at room temperature are negligible and the single electron charging model is still valid (Coulomb blockade regime). Details of this model are given in reference [5]. Therefore,nu,landn′
u,l assume the integer values 0,1 and 2, since individual spins are neglected. For the sake of simplicity, we also disregard the many body interactions among the carriers. WABu,l(ω) and WEMu,l (ω) represent the photon absorption and emission probabilities per unit second due to the incident light with frequencyω, respectively. The formalism used here is discussed in refer-ence [8].
2
Results
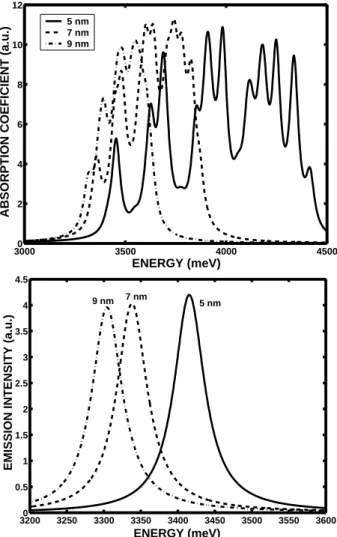
Figure 2 depicts the absorption (top) and band gap lumines-cence (bottom) spectra for an spherical 4H-SiC/SiO2 QD. Our calculations focus on the optical properties of a single QD. This fact can be observed in the absorption lines, which exhibits an strong oscillatory behavior. These oscillations are consequence of the interband transitions rules. In typ-ical experimental absorption spectra, these oscillations are not observed because of the broadening of the absorption lines caused by the size distribution of the QD’s in the sam-ple. The same broadening is commonly observed in the ex-perimental luminescence spectra. In order so simulate such experimental broadening, it is necessary to calculate a large number of confined states for an ensemble of quantum dots with a size distribution. This is computationally intense, and we reserve this topic for future study.
In Fig. 2, it is observed a strong variation on the width of the absorption lines for different QD diameters. The fig-ure shows that 5 nm wide QD’s absorb light in a range of 1.1 eV while the 9 nm absorbs in a spectral range of approx-imately 0.4 eV. This is a consequence of the limited number of calculated confined states. In this paper, we considered the total of 20 states for each band, with valence band en-tirely filled, and the conduction empty. The energy range covered by these 20 states in the 5 nm wide QD is larger than in the 9 nm case. In the case of the luminescence spec-tra, we only investigated the bandgap emission, where the assumption that electrons excited to higher states in conduc-tion band thermalize down to the ground state before recom-bining with holes in the valence band. In both cases, one can observe the expected blue-shift of the spectral lines with a decrease of the QD size.
3
Concluding Remarks
Brazilian Journal of Physics, vol. 34, no. 2B, June, 2004 625
30000 3500 4000 4500 2
4 6 8 10 12
ENERGY (meV)
ABSORPTION COEFICIENT (a.u.)
5 nm 7 nm 9 nm
32000 3250 3300 3350 3400 3450 3500 3550 3600 0.5
1 1.5 2 2.5 3 3.5 4 4.5
ENERGY (meV)
EMISSION INTENSITY (a.u.)
5 nm 7 nm
9 nm
Figure 2. Absorption(top) and emission(bottom) spectra for a spherical 4H-SiC QD with 5,7 and 9 nm of diameter.
valence bands, and a blue-shift of the spectral lines with a decrease of the QD size is observed. Since SiC QD’s were
not grown yet, these results must be faced as a preliminary study and we hope to stimulate experimental observations on this matter.
Acknowledgements
The authors would like to acknowledge the financial support received from the Science Funding Agency of the Cear´a (FUNCAP), the Brazilian National Research Council (CNPq) through grant # 550.015/01-09/NanoSemiMat, and the Ministry of Planning (FINEP) through CTPETRO under contract # 65.00.02.80.00.
References
[1] F. Herman, J. P. Van Dyke and R. L. Kortum, Mat. Res. Bull. 4, 5167 (1969).
[2] L. A. Hamstreet and C. Y. Fong, in Silicon Carbide-1973, edited by R. C. Marshall, J. W. Faust and C. E. Ryan (Univ. of South Carolina Press, Columbia, South Carolina 1974), pp. 284.
[3] W. R. L. Lambrecht, S. Limpijumnong, S. N. Rashkeev and B. Seagall, Phys. Stat. Sol. B 202, 5 (1997).
[4] W. R. L. Lambrecht and B. Seagall, Phys. Rev. B 52, 2249 (1995).
[5] A. Thean, J. P. Leburton, J. Appl. Phys. 89, 2808 (2001).
[6] J. S. de Sousa, H. Wang, V. N. Freire, G. A. Farias and E. F. da Silva Jr., Journal of the Korean Physical Society 39, 443 (2001).
[7] J. S. de Sousa, A. V. Thean, J.-P. Leburton and V. N. Freire, J. Appl. Phys. 92, 6182 (2002).