Acute Exposure of Apigenin Induces Hepatotoxicity in
Swiss Mice
Prabhat Singh, Shrawan Kumar Mishra, Sanjeev Noel, Sharad Sharma, Srikanta Kumar Rath*
Division of Toxicology, Central Drug Research Institute (CSIR), Lucknow, India
Abstract
Apigenin, a dietary flavonoid, is reported to have several therapeutic effects in different diseases including cancer. Toxicity of Apigenin is however, least explored, and reports are scanty in literature. This warrants dose-specific evaluation of toxicity in vivo. In the present study, Apigenin was administered intraperitoneally to Swiss mice at doses of 25, 50, 100 and 200 mg/ kg. Serum levels of alanine amino transferase (ALT), aspartate amino transferase (AST) and alkaline phosphatase (ALP) were measured along with the examination of liver histology, reactive oxygen species (ROS) in blood, lipid peroxidation (LPO), glutathione level, superoxide dismutase activity, catalase activity, glutathione S-transferase activity and gene expression in liver tissue. Increase in ALT, AST, ALP, ROS, ratio of oxidized to reduced glutathione (GSSG/GSH) and LPO, altered enzyme activities along with damaged histoarchitecture in the liver of 100 or 200 mg/kg Apigenin treated animals were found. Microarray analysis revealed the differential expression of genes that correspond to different biologically relevant pathways including oxidative stress and apoptosis. In conclusion, these results suggested the oxidative stress induced liver damage which may be due to the regulation of multiple genes by Apigenin at higher doses in Swiss mice.
Citation:Singh P, Mishra SK, Noel S, Sharma S, Rath SK (2012) Acute Exposure of Apigenin Induces Hepatotoxicity in Swiss Mice. PLoS ONE 7(2): e31964. doi:10.1371/journal.pone.0031964
Editor:Aamir Ahmad, Wayne State University School of Medicine, United States of America
ReceivedSeptember 20, 2011;AcceptedJanuary 16, 2012;PublishedFebruary 16, 2012
Copyright:ß2012 Singh et al. This is an open-access article distributed under the terms of the Creative Commons Attribution License, which permits unrestricted use, distribution, and reproduction in any medium, provided the original author and source are credited.
Funding:This work was supported by Council of Scientific and Industrial Research (CSIR) Network project NWP0034. The funders had no role in study design, data collection and analysis, decision to publish, or preparation of the manuscript.
Competing Interests:The authors have declared that no competing interests exist. * E-mail: [email protected]
Introduction
Apigenin (49, 5, 7-trihydroxyflavone) has been shown to possess diverse therapeutic potentials [1]. It improves cancer cell response to chemotherapy [2] and prevents tumourogenic activities by inhibiting protein kinase, MAP Kinase or chronically activates PI3K-Akt mediated nuclear factor-kappa-B [3]. Apigenin modu-lates immune cells functioning, maintains immune cells in inflammation, autoimmunity or lymphoproliferation [3] and inhibits auto antigen-presenting cells necessary for activation and expansion of auto reactive Th1 and Th17 cells and B cells in lupus [4]. Vasorelaxing and anti-platelet activities of Apigenin have also been demonstrated [5]. Recently, Apigenin has drawn attention of Scientists for its use in therapeutics [6]. However, few reports demonstrated that Apigenin produces phenoxyl radicals [7] or reactive oxygen species [8,9] and induces cytotoxicity [10] or clastogenicity [11] in differentin vitromodels. Chemical Selection Working Group of FDA, USA (2000) recommends developmental toxicity and chromosomal aberration assays for Apigenin. This study explored its toxicity on mice liver following single intraperitoneal exposure.
Materials and Methods
Animals and drug administration
10–12 weeks old male Swiss mice, weighing 25–30 g were obtained from Laboratory Animal Division of CDRI following Institutional Animals Ethics Committee clearance (114/07/ Toxicol./IAEC) and randomly allocated to the following groups containing eight animals each.
Group I: Vehicle (100ml DMSO) controls
Group II: 25 mg/kg Apigenin Group III: 50 mg/kg Apigenin Group IV: 100 mg/kg Apigenin Group V: 200 mg/kg Apigenin
Animals were treated with Apigenin once and sacrificed 24 hrs after the treatment. Animals were maintained in optimal conditions of temperature (2562uC) and 12 hrs light/dark cycles and fed with standard pelleted diet and waterad libitum. Animal ethics guidelines were followed in all animal procedures. Apigenin was administered intraperitoneally as was done in the previous studies [4,6].
Blood collection, serum biochemistry and ROS estimation At autopsy blood was withdrawn from each animal by cardiac puncture and allowed to stand undisturbed for 30 min. Serum was separated and levels of ALT, AST and ALP were estimated using an automated biochemical analyzer (Beckman Coulter, USA). Intra-cellular ROS in peripheral blood mononuclear cells (PBMC) were analyzed using fluorescent probe 29, 79 -dichlorofluorescein-diace-tate, a non-fluorescent compound under normal condition, which is converted into highly fluorescent dichlorofluorescein (DCF) by cellular peroxides. Cell-associated fluorescence was monitored on fluorescence activated cell sorter (Beckman Coulter, USA).
Liver tissue biochemistry
Lipid peroxidation; LPO) and antioxidant enzymes activities (superoxide dismutase, catalase, glutathione peroxidase, glutathi-one S-transferase) were estimated using standard tests [12–16]. GSH and GSSG contents were estimated following the instruction of Glutathione Assay Kit (BioVision, CA, USA). Total protein content was estimated according to Lowry et al. [17] using Bovine Serum Albumin as a standard.
Liver histology
Liver tissue was fixed in 10% buffered formalin for histological investigations. Fixed liver tissues were washed overnight, dehy-drated through graded alcohols and embedded in paraffin wax. Serial sections of about 5mm thickness were stained with hematoxylin and eosin (H&E) for histological examinations.
RNA isolation, Microarray, Clustering and GenMAPP analysis Total RNA was isolated from 50 mg of frozen liver and quantified by spectrophotometer and formaldehyde gel electro-phoresis. RNA samples with approximately 2:1 ratio of 28 S:18 S rRNA and 260/280 values$1.8 were used for gene expression analysis. The methodology of microarray experiments was according to Noel et al. [18]. 22.4 k mouse arrays (http://www. microarrays.ca) containing 23041 unique probes were used. Raw intensity data was analyzed with Avadis Express version 4.3 (Strand life Sciences, India) and the background corrected intensities were LOWESS normalized (Cy5 against Cy3) to obtain log (base 2) ratios. Statistically significant difference between controls and Apigenin treated mice was deduced with two sample t-test and probes with p,0.05 and 2-fold differential expression at 25, 50, 100 mg/kg doses were identified. Raw and log trans-formed data (series accession no. GSE 12716) has been submitted to Gene Expression Omnibus database (www.ncbi.nlm.nih.gov/ geo/) and conforms to MIAME guidelines developed by micro-array gene expression data (MGED) society. Clustering techniques have been applied for the identification of patterns in gene-expression. Intensity values of duplicate spots were averaged in order to get a single mean value to perform k-means clustering with MeV version 3.1 [TM4, The Institute of Genomic Research]. Each expression cluster was further clustered hierarchically with Euclidean distance matrix and average linkage to identify gene with similar expression patterns. Gene expression data of 25, 50, 100 mg/kg doses were separately listed to make a representative gene-expression dataset for identifying affected pathways using GenMAPP version 2.1. Moreover, GenMAPP gene expression dataset file (.gex) was exported to MAPPFinder to calculate the percentage of genes with significant expression change, statistical score for each Gene Ontology (GO) term and Z score.
Quantitative real time PCR analysis
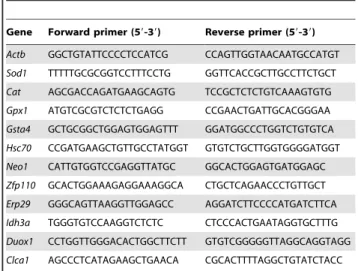
Real-time PCR was performed according to the supplier protocol (Invitrogen, California, USA). Reactions were run in Light Cycler 480 system using forward and reverse primers (Table 1 and Table S1) and analyzed by LightCyclerH 480 Software release 1.5.0. Samples were pooled group wise and experiments were carried out in triplicates.b-actinwas used as an internal control. Melting curve analysis was performed for each primer pair and relative change in mRNA level between control and treated groups were calculated by using 22DDCTmethod.
Western blot analysis
Proteins were isolated from liver tissue using the modified protocol of Ghribi et al., 2001 [19]. Tissues from control and various treatment groups were homogenized with 5–10 volumes of lysis
buffer (200 mM HEPES, 10 mM KCl, 1.5 mM MgCl2, 1 mM EDTA, 1 mM EGTA, 1 mM DTT, 2 mM PMSF, 16Protease inhibitor cocktail). Cellular debris were spun down at 20,0006g for
30 min in 4uC and supernatants were used as whole protein extract. Isolated proteins were quantified using Bradford reagent. 50mg protein from each sample was separated on 15% SDS-PAGE and transferred on to a nitrocellulose membrane using a semi-dry electro blotting apparatus (GE Healthcare, UK). Transfer was examined by Ponceau S stain and washed with triple distilled water until the stain disappeared. Membrane was blocked overnight in 5% Non-Fat dried milk at 4uC. Membrane was washed with 0.1% PBST and probed with primary antibodies (Actin, SOD1 and Hsp70). After primary antibody incubation further washing was done in 0.1% PBST. Membrane was incubated in HRP conjugated secondary antibody and washed again. Enhanced chemi-luminescent detection system (GE Healthcare, UK) was used to develop the blots. Blots were further used for densitometric analysis and normalization.
Statistical analysis
Data were expressed as mean6standard error of the means wherever required. Group means were compared by one-way analysis of variance (ANOVA) followed by Newman-Keuls Multiple Comparison Test. p,0.05 was considered significant.
Results
Serum ALT, AST and ALP
Serum ALT, AST and ALP were unaltered in 25 or 50 mg/kg dose groups as compared to control. A significant increase in serum ALT (100 mg/kg; p,0.01 and 200 mg/kg; p,0.05), AST (100 and 200 mg/kg; p,0.01) and ALP (100 and 200 mg/kg; p,0.05) was observed in animals belonging to the higher dose groups (Figures 1 A–C).
ROS generation
No significant DCF peak shift was observed in 25 mg/kg Apigenin treated group. The oxidized dichlorofluorescein (DCF) peak shifts were 2.24 (p,0.05), 5.76 and 6.56 (p,0.001) fold in 50, 100 and 200 mg/kg dose groups respectively as compared to controls (Figure 2 and Figure S1).
Table 1.List of primers used in Quantitative Real-time polymerase chain reaction.
Gene Forward primer (59-39) Reverse primer (59-39)
Actb GGCTGTATTCCCCTCCATCG CCAGTTGGTAACAATGCCATGT
Sod1 TTTTTGCGCGGTCCTTTCCTG GGTTCACCGCTTGCCTTCTGCT
Cat AGCGACCAGATGAAGCAGTG TCCGCTCTCTGTCAAAGTGTG
Gpx1 ATGTCGCGTCTCTCTGAGG CCGAACTGATTGCACGGGAA
Gsta4 GCTGCGGCTGGAGTGGAGTTT GGATGGCCCTGGTCTGTGTCA
Hsc70 CCGATGAAGCTGTTGCCTATGGT GTGTCTGCTTGGTGGGGATGGT
Neo1 CATTGTGGTCCGAGGTTATGC GGCACTGGAGTGATGGAGC
Zfp110 GCACTGGAAAGAGGAAAGGCA CTGCTCAGAACCCTGTTGCT
Erp29 GGGCAGTTAAGGTTGGAGCC AGGATCTTCCCCATGATCTTCA
Idh3a TGGGTGTCCAAGGTCTCTC CTCCCACTGAATAGGTGCTTTG
Duox1 CCTGGTTGGGACACTGGCTTCTT GTGTCGGGGGTTAGGCAGGTAGG
Clca1 AGCCCTCATAGAAGCTGAACA CGCACTTTTAGGCTGTATCTACC Note: List of other primers used in Quantitative Real-time PCR is given in Table S1.
MDA concentration
MDA concentration in the liver of 25 and 50 mg/kg groups was unaltered. Significant increase in MDA concentration was found in 200 mg/kg (p,0.05) group (Figure 3-A). An increase in MDA concentration was found in 100 mg/kg Apigenin treated animals, which was statistically non-significant as compared to controls.
GSSG and GSH ratio
A trend of increase in GSSG/GSH ratio was found along the group (25 mg/kg to 200 mg/kg) of Apigenin and it was significantly increased in 200 mg/kg group (p,0.05; Figure 3-B). GSH in liver tissue of 200 mg/kg group was significantly decreased (p,0.05) but not in other groups (25, 50 or 100 mg/kg) (Figure S2). A trend of dose dependent increase in GSSG was observed along the groups (Figure S3).
SOD activity and expression
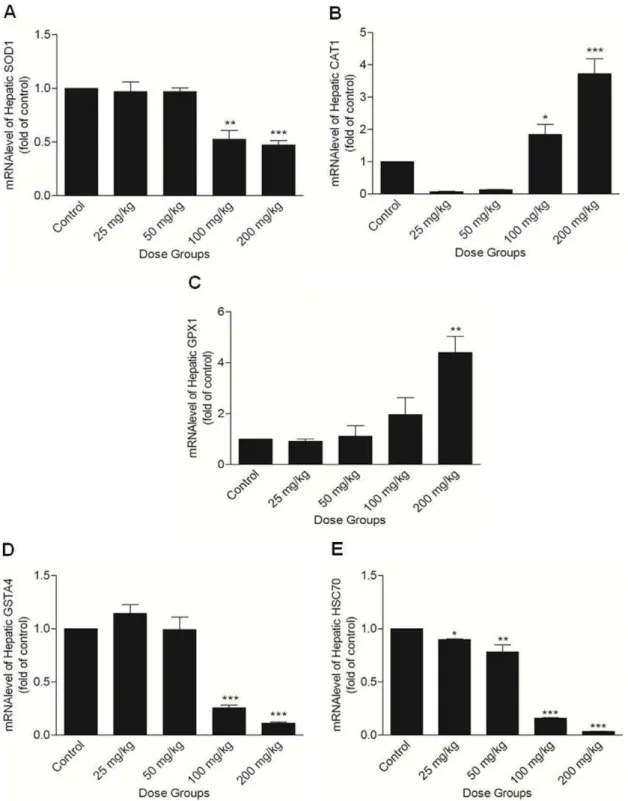
SOD activity and mRNA level were unaltered in the lower treatment groups of Apigenin (25 and 50 mg/kg) as compared to controls. Higher doses of Apigenin significantly reduced the activity (100 mg/kg; p,0.05 and 200 mg/kg; p,0.01; Figure 3-C) and expression of SOD measured at transcript (Figure 4-A) and protein (Figures 5-A and B) level as compared to controls.
Figure 2. Mean fluorescence intensity of dichlorofluorescein (DCF).Intracellular ROS in peripheral blood mononuclear cells (PBMC) were analyzed in Apigenin treated animals at different doses (Control, 25, 50, 100 and 200 mg/kg) using fluorescent probe 29, 79 -dichloro-fluorescein-diacetate. The asterisks indicate significance of differences (*-p,0.05; ** -p,0.01; ***-p,0.001) in comparison to control. doi:10.1371/journal.pone.0031964.g002
Figure 1. Levels of serum biomarkers of hepatotoxicity.(A) Alanine amino transferase (ALT), (B) Aspartate amino transferase (AST), and (C) Alkaline phosphatase (ALP) levels were estimated in serum following the administration of Apigenin at different doses (Control, 25, 50, 100 and 200 mg/kg). The asterisks indicate significance of differences (*-p,0.05; **-p,0.01; ***-p,0.001) in comparison to control.
doi:10.1371/journal.pone.0031964.g001
CAT, GPx, GST activities and mRNA level
CAT, GPx activities and mRNA level did not change in lower treatment groups (25 and 50 mg/kg) of Apigenin as compared to control. In 100 mg/kg Apigenin treated group, increase in CAT (p,0.05) and GPx (not significant) mRNA level was observed. CAT, GPx activities (Figures 3-D and E) and their mRNA levels (Figures 4-B and C) were significantly
increased in highest dose group (200 mg/kg; p,0.05). In lower treatment groups of Apigenin (25 and 50 mg/kg), activity and mRNA level of GST did not change as compared to control. Activity of GST (Figure 3-F) was decreased in both the higher treatment groups (100 and 200 mg/kg, statistically significant only in 100 mg/kg Apigenin treatment group at p,0.05). Reduction in its mRNA level in higher treatment groups Figure 3. Level of oxidative stress parameters.(A) Lipid peroxidation level, (B) Ratio of GSSG/GSH, (C) activity of SOD, (D) activity of CAT, (E) activity of GPx, and (F) activity of GST were estimated in liver following the administration of Apigenin at different doses (Control, 25, 50, 100 and 200 mg/kg). The asterisks indicate significance of differences (*-p,0.05; **-p,0.01; ***- p,0.001) in comparison to control.
(100 and 200 mg/kg) was statistically significant (p,0.001) (Figure 4-D).
Hsp70 expression
Hsp70 mRNA level showed a significant decrease along the Apigenin treated groups (25 mg/kg; p,0.05 or 50 mg/kg; p,0.01), decrease was apparent in higher treatment groups (100
and 200 mg/kg; p,0.001) as compared to control (Figure 4-E). mRNA level of other members of Hsp70 family were also decreased in higher treatment groups of Apigenin (100 and 200 mg/kg; Figure S4). Hsp70 protein content was decreased significantly in 100 and 200 mg/kg Apigenin treated groups (p,0.001) (Figures 5-A and C). A significant change in Hsp70 protein content was observed in lower treatment groups (25 mg/ Figure 4. Quantitative real time PCR analysis of stress regulated genes.(A) SOD1, (B) CAT, (C) GPx1, (D) GSTA4, and (E) Hsc70 mRNA levels in the liver of mice treated with different doses of Apigenin (Control, 25, 50, 100 and 200 mg/kg). The asterisks indicate significance of differences (*-p,0.05; **-p,0.01; ***-p,0.001) in comparison to control.
doi:10.1371/journal.pone.0031964.g004
kg; p,0.05 and 50 mg/kg; p,0.01) of Apigenin as compared to control.
Liver histology
Well distributed normal hepatocytes with central vein, bile duct and hepatic artery were observed in 25 and 50 mg/kg groups. In 100 mg/kg dose group hydropic changes were observed, these changes were eminent with ballooning and degeneration of hepatocytes in 200 mg/kg dosed animals (Figures 6 A–E).
Differential gene expression and pathway identification 48 differentially expressed genes (36 up-regulated and 12 down-regulated; Table 2) were identified. Among them few genes have not been assigned any biological function, so far. Real time PCR analysis of selected genes (Table 1 and Table S1) showed the similar trend as found in microarray results. K-mean and hierarchical clustering identified the similar pattern of expression in genes at different dose levels (Figure 7). Major pathways that showed Apigenin induced perturbations include oxidative stress, apoptosis, inflammatory and MAP Kinase related pathways. Microarray data analysis with MAPPFinder revealed the genes
involved in enzyme activities, cell proliferation, metabolic processes, cell structure and signal transduction related pathways were most affected with increased significant Z score (Z score.2) (Table 3 and Table S3).
Discussion
Apigenin at doses of 25, 50, 100 and 200 mg/kg were evaluated following acute exposure through intraperitoneal route to understand the dose dependent effects in Swiss mice. Intraperi-toneal route of exposure enables the maximum bioavailability of Apigenin in liver. Doses of Apigenin were equivalent to the human exposure of flavones [20] based on the equivalent body surface area index [21]. Male Swiss mice were used in the present study to avoid any sex dependent variations in toxic effects in female mice due to the estrogenic action of Apigenin [22].
Unaltered serum ALT, AST and ALP in 25 or 50 mg/kg Apigenin doses indicate its non toxic effect at these doses. Significantly increased serum ALT, AST and ALP in 100 and 200 mg/kg Apigenin treated groups indicate the insults to liver as increased ALT, AST and ALP in serum are typical indicators of damaged liver [23]. Galati et al. [24] also reported 4-fold increased Figure 5. Western blot analysis of SOD1 and Hsp70.(A) Western blots of SOD1, Hsp70 and Actin genes. Relative band intensity value of (B) SOD1, and (C) Hsp70 after normalization with Actin. The asterisks indicate significance of differences (*-p,0.05; **-p,0.01; ***-p,0.001) in comparison to control.
Figure 6. Histological examination of liver sections.Photomicrographs of transverse section of mice liver (A) Control, (B) 25 mg/kg, (C) 50 mg/ kg Apigenin treated groups. Slight hydropic changes and degeneration of cytoplasm within hepatocytes were observed in (D) 100 mg/kg, and (E) 200 mg/kg Apigenin treated groups respectively. Arrows indicated the degenerated hepatocytes in 200 mg/kg Apigenin treated group.
doi:10.1371/journal.pone.0031964.g006
Table 2.List of differentially expressed genes identified at p,0.05 and two fold change.
Gene Unigene ID Function Regulation P value Log value Std dev#
Neo1 Mm.42249 ATP binding, cadherin binding Up 0.015 1.185 0.995
Bnip3l Mm.29820 Positive regulator of apoptosis, integral to membrane Up 0.027 1.180 1.123
Prpsap1 Mm.25125 Extracellular space, nucleotide biosynthesis Up 0.013 1.099 0.901
Eif5b Mm.260943 GTP binding, transferase activity, translation initiation factor activity Up 0.006 1.247 0.881
Polr2h Mm.288730 DNA-directed RNA polymerase I complex, core complex Up 0.013 1.096 0.899
Zfp110 Mm.292297 DNA binding, receptor activity Up 0.034 1.373 1.374
Idh3a Mm.279195 Oxidoreductase activity Down 0.016 21.052 0.892
Ltbp1 Mm.269747 Calcium ion binding Down 0.017 21.566 1.349
Clca1 Mm.275745 Integral to plasma membrane Down 0.035 21.053 1.060
Pank2 Mm.101264 Pantothenate kinase activity Down 0.042 21.067 1.122
Duox1 Mm.108582 Calcium ion binding, electron carrier activity Down 0.001 21.084 0.579
Pkmyt1 Mm.182193 Protein amino acid phosphorylation Down 0.013 21.035 0.844 #Standard deviation.
Note: Complete list of differentially expressed genes at p,0.05 and two fold change is given in Table S2. doi:10.1371/journal.pone.0031964.t002
plasma ALT in CD-1 mice following 24 hrs of intraperitoneal injection of flavonoids like EGCG, propyl gallate, gallic acid and tannic acid. Normal liver histoarchitecture of 25 or 50 mg/kg Apigenin treated animals supports the serum findings and suggestive of non toxic effects at these doses. Hydropic changes along with ballooning and degeneration of hepatocytes in 100 and 200 mg/kg Apigenin treated groups are the signs of adverse effects on mouse liver. Five fold increased ROS level in PBMCs may be causative of damaged liver in 100 and 200 mg/kg Apigenin treated animals as ROS damages essential biological molecules like proteins, DNA and lipids. Previous studies also demonstrated ROS production by Apigenin [8,9].
LPO is initiated by the attack of free radicals on fatty acid or fatty acyl side chain of any chemical entity and is regarded as one of the basic mechanism of tissue damage [25]. The increase of LPO level in Apigenin treated mice at 100 and 200 mg/kg indicates free radical generation showing the pro-oxidant nature of Apigenin. Similar nature of Apigenin is also demonstrated in the presence of high iron concentration in rat hepatocytes [26]. Decreased GSH and increased ratio of GSSG and GSH in mice liver further supports this view. Similar observations were made by
Kachadour-ian and Day [27] in PC3 cells following Apigenin treatment. GSH is the functional anti-oxidative system in physiological conditions; its depletion might be due to its direct involvement in scavenging ROS in the process of neutralization and subsequent protection of essential thiol groups from oxidation. ROS are scavenged by cellular antioxidant defence system which includes intracellular enzymes such as SOD, CAT, GPx and GST. SOD activity and expression was decreased significantly following 100 and 200 mg/ kg Apigenin doses. As SOD dismutates superoxide into oxygen and H2O2provides an important antioxidant defence in cells exposed to oxygen, its decrease infers excessive ROS generation. Significantly increased CAT activity in 200 mg/kg Apigenin treated mice clearly indicates H2O2generation. Unaltered CAT in mice at 100 mg/kg dose may be due to more turnover of CAT in cells following Apigenin exposure. CAT is solely responsible for the destruction of H2O2while GPx has a wide spectrum of activity and reduces lipid peroxides. In the lower dose groups (25 and 50 mg/kg) CAT and GPx activities and mRNA level were not increased which might be due to insufficient ROS production in mice liver. GPx level was significantly increased in 200 mg/kg Apigenin treated mice which might be the result of decrease in GSH content. Decreased GST at
Table 3.List of most affected Gene Ontology (GO) terms (Z score.2).
Gene Ontology ID Gene Ontology name Z score Permute P
Probes involved in biological processes
22008 Neurogenesis 2.916 0.007
9987 Cellular process 2.601 0.012
6412 Translation 2.399 0.014
43170 Macromolecule metabolic process 2.263 0.014
7067 Mitosis 2.366 0.019
9888 Tissue development 2.366 0.020
904 Cellular morphogenesis during differentiation 2.410 0.026
45045 Secretory pathway 2.366 0.026
87 M phase of mitotic cell cycle 2.288 0.027
Probes involved in molecular functions
4930 G-protein coupled receptor activity 2.410 0.015
30528 Transcription regulator activity 2.431 0.018
16887 ATPase activity 2.203 0.019
3713 Transcription coactivator activity 2.521 0.022
17111 Nucleoside-triphosphatase activity 2.372 0.022
30246 Carbohydrate binding 2.512 0.023
3712 Transcription cofactor activity 2.130 0.023
16817 Hydrolase activity\, acting on acid anhydrides 2.367 0.025
5529 Sugar binding 2.591 0.033
Probes involved in cellular components
5788 Endoplasmic reticulum lumen 9.883 0.014
30529 Ribonucleoprotein complex 2.743 0.006
5829 Cytosol 2.680 0.012
5746 Mitochondrial respiratory chain 2.950 0.028
Note: Complete list of most affected Gene Ontology (GO) terms (Z score.2) is given in Table S3. doi:10.1371/journal.pone.0031964.t003
Figure 7. Cluster analysis of differentially expressed genes.K-mean and hierarchical clustering identified the similar pattern of expression in different dose groups of Apigenin (25, 50, 100 mg/kg). In heat map, intensities of red and green colours were proportional to relative gene induction and repression, respectively.
doi:10.1371/journal.pone.0031964.g007
100 and 200 mg/kg Apigenin treated groups is in accordance with the findings of Sahu and Gray [28] who reported the flavonoid induced concentration-dependent decrease in GST activity. GST protects cells against toxicants by conjugating them to GSH, thereby neutralizing their electrophilic sites, and increases their solubility in aiding excretion from cells [16]. The decrease in GST along with SOD indicates severe insult to liver tissue following acute exposure of Apigenin at higher doses. Increase in GSSG and GSH ratio further indicated a shift of biological system towards the state of apoptosis or necrosis. Dose-dependent reduction in Hsp70 mRNA and protein was observed following Apigenin treatment. Hsp70 is a multigene family and it is expressed in different isoforms in which Hsc70/Hspa8 is constitutively expressed [29]. Hsp70 is involved in the regulation of cell proliferation, differentiation and can be induced by heat stress, hypoxia, metals or amino acid analogs exposure [29]. Previous studies revealed that Hsp synthesis is blocked following the treatment of other flavonoid such as Quercetin [30,31]. Dose related decrease in Hsp70 expression indicates the involvement of heat shock and stress pathway that leads towards apoptosis [32].
Gene expression data provides insight into the ongoing molecular activities inside the cells especially in short term acute toxicity studies where the full phenotypic signs and symptoms may have not been fully developed [18]. In the present study, 48 differentially regulated genes were identified that are involved in important biological functions. Most of them (Bnip3l,Neo1,Clca1,Idh3a,Pank2,Prpsap1,
Eif5B,Polr2h,Zfp110) are engaged in regulation of apoptosis, stress and cell growth. Isocitrate dehydrogenase (Idh3a) protects cell against oxidative damage [33] has been shown to be more active in producing Nicotinamide Adenine Dinucleotide Phosphate Reduced (NADPH) than other enzymes in the previous studies [34]. Down regulation of this gene clearly indicated that cell might have undergone oxidative stress following Apigenin treatment. Interest-ingly, the simultaneous upregulation of BCL2/adenovirus E1B interacting protein 3-like (Bnip3l) [35], and Neogenin (Neo1) [36] genes that are reported to regulate apoptosis, might be involved in the induction of apoptosis in degenerated hepatocytes of Apigenin treated mice in higher dose groups. Apigenin is reported to induce apoptosis by activating different genes like PKC-dand caspases [2].
Apigenin upregulates the expression of genes involved in transcrip-tion and translatranscrip-tion machinery; Phosphoribosyl pyrophosphate synthetase associated protein 1 (Prpsap1), Eukaryotic translation initiation factor 5B (Eif5B), DNA directed polymerase (Polr2h), Zinc finger protein 110 (Zfp110). Pantothenate kinase 2 (Pank2), a mitochondrial enzyme catalyses the first regulatory step of Coenzyme A synthesis, is found to be down regulated in present study. This gene is responsible for a genetic movement disorder named Pank-associated neurodegeneration. Recent evidences sug-gest the silencing ofPank2gene is directly associated with cell growth reduction and iron deregulation in hepatic cell lines [37]. Another downregulated gene was calcium-activated chloride channel (Clca1) which is integrated to plasma membrane. Another downregulated gene was calcium-activated chloride channel (Clca1) which is integrated to plasma membrane. Differential regulation ofClca1in
normal, apoptotic and transformed mouse cells suggested its proapoptotic and antineoplastic nature [38]. Apigenin appears to affect the calcium ion homeostasis by modulating the expression of calcium ion binding proteins (Latent transforming growth factor beta binding protein;Ltbp1and Dual oxidase 1;Duox1). Further analysis of datasets on MAPPFinder identified GO terms (Z score.2) corresponding to various biological processes, molecular functions and cellular components. This provides evidences of significant change in gene expression following oxidative stress associated hepatotoxicity. Few identified genes have not been assigned any cellular functions that might be playing important role in Apigenin induced perturbations in mice liver.
Results indicate that Apigenin induces oxidative stress through different pathways ensuing liver toxicity. However, further studies are required to elucidate the detail molecular pathways of Apigenin action.
Supporting Information
Figure S1 Reactive oxygen species generation with maximum DCF peak shifts in 100 and 200 mg/kg Apigenin treated groups.
(DOC)
Figure S2 Decrease in reduced Glutathione content in 200 mg/kg Apigenin treatment group.
(DOC)
Figure S3 Increase in Oxidized Glutathione content (GSSG) along the Apigenin treatment groups.
(DOC)
Figure S4 Decrease in mRNA level of different mem-bers of Hsp70 family in higher treatment group of Apigenin (100 and 200 mg/kg).
(DOC)
Table S1 List of other primers used in Quantitative Real-time PCR.
(XLS)
Table S2 Complete list of differentially expressed genes.
(XLS)
Table S3 Complete list of most affected Gene Ontology (GO) terms (Z score.2).
(XLS)
Acknowledgments
Authors are thankful to Genotoxicity lab members for their technical support. This manuscript bears CDRI communication Number 7612.
Author Contributions
Conceived and designed the experiments: PS SN SKR. Performed the experiments: PS SKM SN. Analyzed the data: PS SKM SN. Contributed reagents/materials/analysis tools: SKR SS. Wrote the paper: PS SKM SKR SS.
References
1. Patel D, Shukla S, Gupta S (2007) Apigenin and cancer chemoprevention: progress, potential and promise (review). Int J Oncol 30: 233–245.
2. Vargo MA, Voss OH, Poustka F, Cardounel AJ, Grotewold E, et al. (2006) Apigenin-induced-apoptosis is mediated by the activation of PKCdelta and caspases in leukemia cells. Biochem Pharmacol 72: 681–692.
3. Xu L, Zhang L, Bertucci AM, Pope RM, Datta SK (2008) Apigenin, a dietary flavonoid, sensitizes human T cells for activation-induced cell death by inhibit-ing PKB/Akt and NF-kappaB activation pathway. Immunol Lett 121: 74–83.
4. Kang HK, Ecklund D, Liu M, Datta SK (2009) Apigenin, a non-mutagenic dietary flavonoid, suppresses lupus by inhibiting autoantigen presentation for expansion of autoreactive Th1 and Th17 cells. Arthritis Res Ther 11: R59. 5. Zhang YH, Park YS, Kim TJ, Fang LH, Ahn HY, et al. (2000)
Endothelium-dependent vasorelaxant and antiproliferative effects of apigenin. Gen Pharmacol 35: 341–347.
7. Galati G, Sabzevari O, Wilson JX, O’Brien PJ (2002) Prooxidant activity and cellular effects of the phenoxyl radicals of dietary flavonoids and other polyphenolics. Toxicology 177: 91–104.
8. Morrissey C, O’Neill A, Spengler B, Christoffel V, Fitzpatrick JM, et al. (2005) Apigenin drives the production of reactive oxygen species and initiates a mitochondrial mediated cell death pathway in prostate epithelial cells. Prostate 63: 131–142.
9. Miyoshi N, Naniwa K, Yamada T, Osawa T, Nakamura Y (2007) Dietary flavonoid apigenin is a potential inducer of intracellular oxidative stress: the role in the interruptive apoptotic signal. Arch Biochem Biophys 466: 274–282. 10. Tsuji PA, Walle T (2008) Cytotoxic effects of the dietary flavones chrysin and
apigenin in a normal trout liver cell line. Chem Biol Interact 171: 37–44. 11. Noel S, Kasinathan M, Rath SK (2006) Evaluation of apigenin using in vitro
cytochalasin blocked micronucleus assay. Toxicol In Vitro 20: 1168–1172. 12. Ohkawa H, Ohishi N, Yagi K (1979) Assay for lipid peroxides in animal tissues
by thiobarbituric acid reaction. Anal Biochem 95: 351–358.
13. Kakkar P, Das B, Viswanathan PN (1984) A modified spectrophotometric assay of superoxide dismutase. Indian J Biochem Biophys 21: 130–132.
14. Sinha AK (1972) Colorimetric assay of catalase. Anal Biochem 47: 389–394. 15. Wendel A (1980) Glutathione peroxidase. In Enzymatic Basis of Detoxication.
Edited by: Jakoby WB. Academic Press, New York. pp 333–348.
16. Habig WH, Pabst MJ, Jakoby WB (1974) Glutathione S-transferases. The first enzymatic step in mercapturic acid formation. J Biol Chem 249: 7130–7139. 17. Lowry OH, Rosebrough NJ, Farr AL, Randall RJ (1951) Protein measurement
with the Folin phenol reagent. J Biol Chem 193: 265–275.
18. Noel S, Sharma S, Shanker R, Rath SK (2007) Primaquine-induced differential gene expression analysis in mice liver using DNA microarrays. Toxicology 239: 96–107.
19. Ghribi O, DeWitt DA, Forbes MS, Herman MM, Savory J (2001) Co-involvement of mitochondria and endoplasmic reticulum in regulation of apoptosis: changes in cytochrome c, Bcl-2 and Bax in the hippocampus of aluminum-treated rabbits. Brain Res 903: 66–73.
20. Mullie P, Clarys P, Deriemaeker P, Hebbelinck M (2007) Estimation of Daily Human Intake of Food Flavonoids. Plant Foods Hum Nutr 62: 93–98. 21. Freireich EJ, Gehan EA, Rall DP, Schmidt LH, Skipper HE (1966) Quantitative
comparison of toxicity of anticancer agents in mouse, rat, hamster, dog, monkey, and man. Cancer Chemother Rep 50: 219–244.
22. Stroheker T, Picard K, Lhuguenot JC, Canivenc-Lavier MC, Chagnon MC (2004) Steroid activities comparison of natural and food wrap compounds in human breast cancer cell lines. Food Chem Toxicol 42: 887–897.
23. Ozer J, Ratner M, Shaw M, Bailey W, Schomaker S (2008) The current state of serum biomarkers of hepatotoxicity. Toxicology 245: 194–205.
24. Galati G, Lin A, Sultan AM, O’Brien PJ (2006) Cellular and in vivo hepatotoxicity caused by green tea phenolic acids and catechins. Free Radic Biol Med 40: 570–580.
25. de Zwart LL, Meerman JH, Commandeur JN, Vermeulen NP (1999) Biomarkers of free radical damage applications in experimental animals and in humans. Free Radic Biol Med 26: 202–226.
26. Sugihara N, Arakawa T, Ohnishi M, Furuno K (1999) Anti- and pro-oxidative effects of flavonoids on metal-induced lipid hydroperoxide-dependent lipid peroxidation in cultured hepatocytes loaded with alpha-linolenic acid. Free Radic Biol Med 27: 1313–1323.
27. Kachadourian R, Day BJ (2006) Flavonoid-induced glutathione depletion: potential implications for cancer treatment. Free Radic Biol Med 41: 65–76. 28. Sahu SC, Gray GC (1997) Lipid peroxidation and DNA damage induced by
morin and naringenin in isolated rat liver nuclei. Food Chem Toxicol 35: 443–447.
29. Evans CG, Chang L, Gestwicki JE (2010) Heat Shock Protein 70 (Hsp70) as an Emerging Drug Target. Journal of Med Chem 53: 4585–4602.
30. Hosokawa N, Hirayoshi K, Nakai A, Hosokawa Y, Marui N, et al. (1990) Flavonoids inhibit the expression of heat shock proteins. Cell Struct Funct 15: 393–401.
31. Elia G, Santoro MG (1994) Regulation of heat shock protein synthesis by quercetin in human erythroleukaemia cells. Biochem J 300: 201–209. 32. Nylandsted J, Rohde M, Brand K, Bastholm L, Elling F, et al. (2000) Selective
depletion of heat shock protein 70 (Hsp70) activates a tumor-specific death program that is independent of caspases and bypasses Bcl-2. Proc Natl Acad Sci U. S. A 97: 7871–7876.
33. Lee SM, Koh HJ, Park DC, Song BJ, Huh TL, et al. (2002) Cytosolic NADP(+)-dependent isocitrate dehydrogenase status modulates oxidative damage to cells. Free Radic Biol Med 32: 1185–1196.
34. Veech RL, Eggleston LV, Krebs HA (1969) The redox state of free nicotinamide-adenine dinucleotide phosphate in the cytoplasm of rat liver. Biochem J 115: 609–619.
35. Vande VC, Cizeau J, Dubik D, Alimonti J, Brown T, et al. (2000) BNIP3 and genetic control of necrosis-like cell death through the mitochondrial permeability transition pore. Mol Cell Biol 20: 5454–5468.
36. Matsunaga E, Chedotal A (2004) Repulsive guidance molecule/neogenin: a novel ligand-receptor system playing multiple roles in neural development. Dev Growth Differ 46: 481–486.
37. Poli M, Derosas M, Luscieti S, Cavadini P, Campanella A, et al. (2010) Pantothenate kinase-2 (Pank2) silencing causes cell growth reduction, cell-specific ferroportin upregulation and iron deregulation. Neurobiol Dis 39: 204–210.
38. Elble RC, Pauli BU (2001) Tumor suppression by a proapoptotic calcium-activated chloride channel in mammary epithelium. J Biol Chem 276: 40510–40517.