ACPD
10, 3347–3399, 2010Long-range pollution transport during the
MILAGRO-2006 campaign
P. B. Voss et al.
Title Page
Abstract Introduction
Conclusions References
Tables Figures
◭ ◮
◭ ◮
Back Close
Full Screen / Esc
Printer-friendly Version
Interactive Discussion Atmos. Chem. Phys. Discuss., 10, 3347–3399, 2010
www.atmos-chem-phys-discuss.net/10/3347/2010/ © Author(s) 2010. This work is distributed under the Creative Commons Attribution 3.0 License.
Atmospheric Chemistry and Physics Discussions
This discussion paper is/has been under review for the journal Atmospheric Chemistry and Physics (ACP). Please refer to the corresponding final paper in ACP if available.
Long-range pollution transport during the
MILAGRO-2006 campaign: a case study of
a major Mexico City outflow event using
free-floating altitude-controlled balloons
P. B. Voss1, R. A. Zaveri2, F. M. Flocke3, H. Mao4, T. P. Hartley1, P. DeAmicis1, I. Deonandan1, G. Contreras-Jim ´enez5, O. Mart´ınez-Antonio5,
M. Figueroa Estrada6, D. Greenberg7, T. L. Campos3, A. J. Weinheimer3, D. J. Knapp3, D. D. Montzka3, J. D. Crounse8, P. O. Wennberg9,10, E. Apel3, S. Madronich3, and B. de Foy11
1
Picker Engineering Program, Smith College, Northampton, MA, USA
2
Pacific Northwest National Laboratory, Richland, WA, USA
3
National Center for Atmospheric Research, Boulder, CO, USA
4
Institute for the Study of Earth, Oceans, and Space, University of New Hampshire, Durham, NH, USA
5
Centro de Investigaciones Qu´ımicas, Universidad Aut ´onoma del Estado de Morelos, Cuernavaca, Mexico
6
ACPD
10, 3347–3399, 2010Long-range pollution transport during the
MILAGRO-2006 campaign
P. B. Voss et al.
Title Page
Abstract Introduction
Conclusions References
Tables Figures
◭ ◮
◭ ◮
Back Close
Full Screen / Esc
Printer-friendly Version
Interactive Discussion 7
Mohawk Trail Regional School District, Shelburne Falls, MA, USA
8
Division of Chemistry and Chemical Engineering, California Institute of Technology, Pasadena, CA, USA
9
Division of Engineering and Applied Science and Geological Science and Planetary Science, California Institute of Technology, Pasadena, CA, USA
10
Division of Geological and Planetary Sciences, California Institute of Technology, Pasadena, CA, USA
11
Department of Earth and Atmospheric Sciences, Saint Louis University, St. Louis, MO, USA
Received: 22 January 2010 – Accepted: 24 January 2010 – Published: 9 February 2010
Correspondence to: P. B. Voss ([email protected])
ACPD
10, 3347–3399, 2010Long-range pollution transport during the
MILAGRO-2006 campaign
P. B. Voss et al.
Title Page
Abstract Introduction
Conclusions References
Tables Figures
◭ ◮
◭ ◮
Back Close
Full Screen / Esc
Printer-friendly Version
Interactive Discussion
Abstract
One of the major objectives of the Megacities Initiative: Local And Global Research Observations (MILAGRO-2006) campaign was to investigate the long-range transport of polluted Mexico City Metropolitan Area (MCMA) outflow and determine its down-wind impacts on air quality and climate. Six research aircraft, including the National 5
Center for Atmospheric Research (NCAR) C-130, made extensive chemical, aerosol, and radiation measurements above MCMA and more than 1000 km downwind in order to characterize the evolution of the outflow as it aged and dispersed over the Mesa Alta and Gulf of Mexico. As part of this effort, free-floating Controlled-Meteorological (CMET) balloons, commanded to change altitude via satellite, made repeated profile 10
measurements of winds and state variables within the advecting outflow. In this pa-per, we present an analysis based on the data from two CMET balloons that were launched near Mexico City on the afternoon of 18 March 2006 and floated downwind with the MCMA pollution for nearly 30 h. The repeating profile measurements show the evolving structure of the outflow in considerable detail: its stability and stratification, 15
interaction with other air masses, mixing episodes, and dispersion into the regional background. Air parcel trajectories, computed directly from the balloon wind profiles, show three different transport pathways on 18–19 March: (a) high-altitude advection of the top of the MCMA mixed layer, (b) mid-level outflow over the Sierra Madre Oriental followed by decoupling and isolated transport over the Gulf, and (c) low-altitude out-20
flow with entrainment into a cleaner westerly jet below the plateau. The C-130 aircraft intercepted the balloon-based trajectories three times on 19 March, once along each of these pathways. In all three cases, distinct peaks in the urban tracer signatures and LIDAR backscatter imagery were consistent with MCMA pollution. The coherence of the high-altitude outflow was well preserved after one day whereas that lower in the 25
ACPD
10, 3347–3399, 2010Long-range pollution transport during the
MILAGRO-2006 campaign
P. B. Voss et al.
Title Page
Abstract Introduction
Conclusions References
Tables Figures
◭ ◮
◭ ◮
Back Close
Full Screen / Esc
Printer-friendly Version
Interactive Discussion range of scientific questions pertaining to the transport, transformation, and downwind
impacts of megacity air pollution.
1 Introduction
Over the past half century, megacities around the world have expanded at a phenom-enal pace. These sprawling urban regions, defined as having populations exceeding 5
10 million, have grown in response to population growth compounded by mass rural-to-urban demographic shifts. Whereas New York was the only megacity in 1950, there are now more than 22 such urban amalgamations. The Mexico City Metropolitan Area (MCMA), the subject of the present study, is the second largest megacity in the world with approximately 20 million inhabitants, 3.5 million vehicles, and 40 000 industries 10
(Molina et al., 2007)
Air quality within and around these growing megacities is an issue of serious public concern. High concentrations of heavy metals, particulates, acids, and reactive gasses are well known to adversely affect human health (e.g., Holgu´ın et al., 2003; Dockery et al., 1993; Pope et al., 2009), agricultural productivity (Chameides, et al., 1999; Riley 15
et al., 2007), and ecosystem function (de Lourdes de Bauer and Hernandez-Tejeda, 2007; Feltzer et al., 2007; Sitch et al., 2007). Within the MCMA basin, pervasive air pollution can be attributed to the large number of local sources, to surrounding moun-tains that inhibit ventilation, and to intense sunlight that accelerates photochemical ozone production. Due in part to this unfortunate situation, Mexico City has gained 20
international stature as a center for atmospheric research. Several major studies, most recently the Mexico City Metropolitan Area (MCMA) campaign in 2003, have sought to better understand the sources, sinks, circulation, and transformation of pollutants in the basin (Molina et al., 2007). These studies have helped inform policy decisions that have improved air quality in Mexico City even as its population has continued to grow 25
ACPD
10, 3347–3399, 2010Long-range pollution transport during the
MILAGRO-2006 campaign
P. B. Voss et al.
Title Page
Abstract Introduction
Conclusions References
Tables Figures
◭ ◮
◭ ◮
Back Close
Full Screen / Esc
Printer-friendly Version
Interactive Discussion While air pollution chemistry and transport within the basin are now reasonably well
understood, comparatively little is known about the downwind impacts of MCMA pol-lution. How far do the airborne aerosols, acids, and reactive gasses travel? How are these pollutants transformed and dispersed into the regional background, and what are their ultimate fates? How do these pollutants impact the composition of the regional 5
atmosphere and surface air quality at locations downwind? Are pollutants from MCMA sufficiently concentrated to affect the regional radiation budget (J ´auregui and Luyando, 1999; Raga et al., 2001), agricultural productivity (Chameides, 1999), and precipitation patterns (J ´auregui and Romales, 1996)?
The Megacities Initiative: Local And Global Research Observations (MILAGRO) field 10
campaign in March of 2006 was organized to address these questions by bringing together an extensive suite of measurements from research aircraft, satellites, ground stations, and ships. A major goal of the field campaign was to characterize the air in the MCMA basin and then observe its evolution as it was transported downwind. The month of March was chosen for the field campaign because of the prevalence of the dry 15
sunny weather (J ´auregui, 2000) and the northeastward transport that occurs 20–30% of the time at that time of year (Fast et al., 2007; de Foy et al., 2008). The focus on northeastward transport permitted the development of three research supersites (T0, T1, and T2) along this axis (Doran et al., 2007) and allowed for the extensive planning needed to coordinate the MILAGRO aircraft with each other, with the surfaces sites, 20
and with satellite overpasses during transport events.
To support the goals of the MILAGRO campaign, our group contributed newly devel-oped Controlled Meteorological (CMET) balloons to measure trajectories and evolving state parameters during long-range transport events (Voss et al., 2005, 2009). Simi-lar free-floating balloons have been used for many years to characterize transport and 25
ACPD
10, 3347–3399, 2010Long-range pollution transport during the
MILAGRO-2006 campaign
P. B. Voss et al.
Title Page
Abstract Introduction
Conclusions References
Tables Figures
◭ ◮
◭ ◮
Back Close
Full Screen / Esc
Printer-friendly Version
Interactive Discussion horizontal winds; the resulting quasi-Lagrangian profiles show the evolution of thermal
stability, vertical mixing, and dispersion from a perspective that cannot presently be obtained by other means.
The principle objectives of the CMET balloon study were to (a) observe directly the transport trajectories, vertical mixing, and horizontal dispersion of the MCMA plume 5
during major northeastward outflow events, (b) characterize the coherence and terrain-following tendency of the outflow, (c) help guide MILAGRO research aircraft to the aged MCMA emissions over the Gulf of Mexico, and (d) provide a comprehensive set of in situ meteorological observations for assessing the accuracy of regional transport models during intensive study periods. This work also contributes to a companion 10
study of the photochemistry during transport (Zaveri et al., 2008) and is relevant to several other transport and transformation studies undertaken during the MILAGRO campaign (e.g., Apel et al., 2009; Subramanian et al., 2010).
2 Experimental
In this section we describe the CMET balloons and their deployment during the MI-15
LAGRO campaign. We also discuss relevant details of the research aircraft, surface stations, instrumentation, and transport models that are used in our analysis.
2.1 Controlled meteorological balloons
The CMET balloons used in the MILAGRO campaign are small altitude-controlled platforms with bi-directional satellite communication and long-duration flight capabil-20
ACPD
10, 3347–3399, 2010Long-range pollution transport during the
MILAGRO-2006 campaign
P. B. Voss et al.
Title Page
Abstract Introduction
Conclusions References
Tables Figures
◭ ◮
◭ ◮
Back Close
Full Screen / Esc
Printer-friendly Version
Interactive Discussion closely coordinated with the Servicios a la Navegaci ´on en el Espacio A ´ereo Mexicano
(SENEAM), the Mexican equivalent of the US Federal Aviation Administration (FAA). Each CMET balloon carried a 400-gram payload and measured horizontal winds, pressure, temperature, and relative humidity. The payload included an aspirated tem-perature and humidity sensor (General Electric NTC MC65 bead thermistor, ±0.2◦C 5
and Vaisala model 17204HM,±5% RH,±1◦C), a satellite modem (Iridium model A3LA-I), and a custom-built pump/valve system for altitude control. Power was provided by a thin-film photovoltaic panel (PowerFilm MPT6-150×6, 400 mA at 18 V) coupled with a lithium polymer battery array (Batteries America, 1450 mAh at 16.8 V). Position was measured by a GPS receiver (Synergy Systems model M12+,±5 m horizontal,±50 m 10
vertical) with short-term vertical resolution increased to±1.0 m by a pressure altimeter (Motorola model MPX 5100AP, ±25 mb specified accuracy, 0.035 mb bit resolution). Measurements were made at 15–30 s intervals during soundings and at 60-s intervals during float. An in-flight comparison, discussed in Sect. 3.1, shows that the meteoro-logical measurements made by the CMET balloons and those made by the research 15
aircraft are in good agreement.
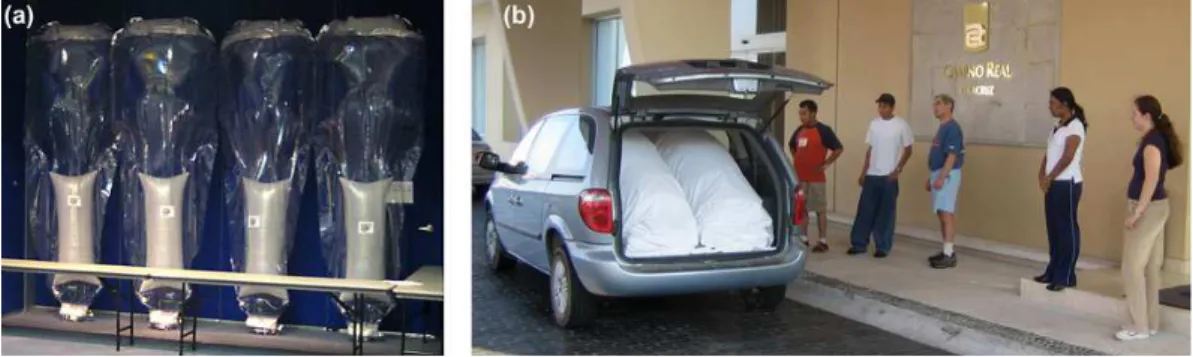
Twelve CMET balloons along with the necessary supporting equipment were trans-ported into Mexico as carry-on luggage on a commercial flight. This arrangement eliminated the delays and potential damage that can occur with customs inspections at larger shipping centers. The balloons were prepared, ballasted, and controlled from 20
the MILAGRO Aircraft Operations Center at the Hotel Camino Real in Veracruz in or-der to facilitate coordination with the modeling teams, aircraft operators, and mission scientists.
2.2 MILAGRO aircraft
Six research aircraft supported the MILAGRO campaign (Singh et al., 2009; Yokelson 25
ACPD
10, 3347–3399, 2010Long-range pollution transport during the
MILAGRO-2006 campaign
P. B. Voss et al.
Title Page
Abstract Introduction
Conclusions References
Tables Figures
◭ ◮
◭ ◮
Back Close
Full Screen / Esc
Printer-friendly Version
Interactive Discussion (MCMA basin photochemistry and transport), the NSF/NCAR C-130 (regional
pho-tochemistry and transport), the NASA J-31 (clouds and aerosols), and NASA DC-8 (photochemistry, aerosols, and long-range transport). The National Science Founda-tion/National Center for Atmospheric Research (NSF/NCAR) C-130 in particular had a comprehensive instrument package and regional range that was well matched to the 5
1000-km 24-h transport events characterized by the CMET balloons.
As configured during the MILAGRO campaign, the NSF/NCAR C-130 Hercules air-craft (hereafter C-130) measured approximately 100 chemical species including CO, CO2, O3, NO, NO2, HNO3, PAN, OH, HO2, RO2, and VOCs, aerosol size, distribution, and composition, complete meteorological parameters, photolysis rates, and radiance. 10
This comprehensive suite of instruments is well suited for addressing a broad array of question pertaining to the transport and transformation of tropospheric trace gasses and aerosols.
In this paper, we use five chemical measurements from the NSF/NCAR C-130 to help identify MCMA outflow. Hydrogen Cyanide (HCN), an indicator of biomass burning that 15
is also associated with MCMA, was measured by the California Institute of Technology Chemical Ionization Mass Spectrometer (CIMS). This measurement was carried out in air using the reagent ion CF3O- and monitoring for the cluster ion CF3O-HCN. The detection limit was 15 pptv with a 0.5-s integration time for H2O mixing ratios <0.004 (Crounse et al., 2006, 2009).
20
The other measurements (CO, NOy, O3, and MTBE) were obtained by three in-struments operated under the auspices of NCAR and NSF. CO was measured by a vacuum-ultraviolet resonance fluorescence instrument (Aero-Laser) similar to that de-scribed by Gerbig et al. (1999). The CO measurement had a precision of 3 ppbv, a resolution of 1-s, and a typical accuracy of±10%.
25
ACPD
10, 3347–3399, 2010Long-range pollution transport during the
MILAGRO-2006 campaign
P. B. Voss et al.
Title Page
Abstract Introduction
Conclusions References
Tables Figures
◭ ◮
◭ ◮
Back Close
Full Screen / Esc
Printer-friendly Version
Interactive Discussion using O3 as the excess reagent. NOy was measured at 1 Hz with a 1-s detection limit
of∼20 pptv (Ridley et al., 1994).
Methyl tertiary-butyl ether (MTBE), an oxygenating additive in gasoline used as an urban tracer, was measured by the Trace Organic Gas Analyzer (TOGA). This instru-ment, which uses a gas chromatograph and mass spectrometer (Agilent 5973) with 5
cryogenic preconcentration, was operated by NCAR and NSF-supported investigators during MILAGRO. In flight calibrations were carried out using a gravimetrically prepared mixture diluted dynamically to typical ambient mixing ratios (Apel et al., 2003, 2007).
As described in the C-130 Investigator Handbook (http://www.eol.ucar.edu/ instrumentation), relative humidity (RH) was measured by chilled mirror hygrome-10
ter (Buck 1011C). Ambient air temperature was measured by a platinum resistance thermometer (Rosemount Inc. 102E2AL,±0.5◦C), and ambient (static) pressure was measured using a DigiQuartz transducer (Paroscientific 1000, ±0.3 mb). Horizon-tal winds were measured by a Radome gust probe (±0.5 m/s). An NCAR-designed Scanning Aerosol Backscatter Lidar (SABL), operating at 532 nm and 1064 nm, pro-15
vided critical information on aerosol structure above and below the aircraft (http: //www.eol.ucar.edu/rsf/sabl).
2.3 Transport models
During the MILAGRO field campaign, ten models ranging in scale from local to synoptic were used to predict the location of the MCMA outflow, simulate its chemical transfor-20
mation, and aid in aircraft flight planning (Fast et al., 2007). These included the MM5 model (Grell et al., 1993) and the WRF model (Skamarock et al., 2005) in combination with chemical, tracer and trajectory models. The MM5-FLEXPART model (de Foy et al., 2006) was used extensively to plan the CMET balloon flights and determine the optimal times and locations for targeted launches in the MCMA basin.
25
ACPD
10, 3347–3399, 2010Long-range pollution transport during the
MILAGRO-2006 campaign
P. B. Voss et al.
Title Page
Abstract Introduction
Conclusions References
Tables Figures
◭ ◮
◭ ◮
Back Close
Full Screen / Esc
Printer-friendly Version
Interactive Discussion Acapulco, Mexico City, and Veracruz as well as from the regular once-daily launches
from four sites distributed over central Mexico. Fast et al. (2007) found that the GFS wind directions at 500 hPa agreed well with the assimilated rawinsonde data while wind speeds differed by as much as 5 m/s (up to 100% error). The balloon-derived trajec-tories were compared with WRF-Flexpart (Stohl et al., 2005; Doran et al., 2008) tra-5
jectories during the campaign (de Foy et al., 2009a). These models were evaluated using surface measurements as well as radar wind profiler data and were found to be representative of pollutant wind transport in the basin (de Foy et al., 2009a).
In the regional models, errors in the GFS boundary conditions can be compounded by the nuances of terrain following, atmospheric stability, and vertical mixing, all of 10
which influence transport and are difficult to parameterize. Some of these subtleties are highlighted later in the discussion of CMET balloon data from the major northeastward transport events on 11–12 March and 18–19 March.
2.4 CMET balloon field operations
On days when the operational models predicted northeastward outflow, pairs of CMET 15
balloons were transported via minivan from Veracruz to Mexico City for targeted launches. Typically, departures occurred in the morning (14:00 UTC) with arrival in Mexico City by mid afternoon (21:00 UTC). In central Mexico during March, Universal Coordinated Time (UTC) leads the local Central Standard Time (CST) by 6 h. Three designated launch sites and one opportunistic launch from Texcoco were approved by 20
SENEAM (Table 1). These sites allowed the balloons to be launched on the downwind side of Mexico City under a wide range of wind conditions (Fig. 2a).
The launch site on any particular day would ideally be located in a highly polluted downwind area of MCMA. Given the complex meteorology within the basin, this lo-cation was often difficult to determine; sites were ultimately selected in the last 2–3 h 25
ACPD
10, 3347–3399, 2010Long-range pollution transport during the
MILAGRO-2006 campaign
P. B. Voss et al.
Title Page
Abstract Introduction
Conclusions References
Tables Figures
◭ ◮
◭ ◮
Back Close
Full Screen / Esc
Printer-friendly Version
Interactive Discussion selection. It was not uncommon, however, for the launch team to be chasing the plume
through rush-hour traffic while simultaneously sorting through conflicting information from the models, surface stations, and the observed haze patterns.
Shortly after the team’s arrival at the chosen launch site, the CMET balloons were superheated by the vehicle’s climate control system and then hand launched (generally 5
between 21:00–01:00 UTC). They typically ascended into the polluted residual layer at a rate of 2–3 m/s and stabilized between 3400–4000 m (1200–1800 m a.g.l.) with the exact altitude determined by the flight plan. Throughout this paper, altitude is always given in meters above mean sea level (m.s.l.) unless specifically designated as above ground level (a.g.l.). The term residual layer refers to the air that comprised the mixed 10
layer during the day; it is characterized by initially uniform potential temperature, spe-cific humidity, and pollutant mixing ratios (Stull, 2000). After stabilizing in the residual layer, the balloons were controlled via satellite from the Aircraft Operations Center in Veracruz.
The initial phase of the MILAGRO balloon operation was devoted to field prepara-15
tions, meetings with SENEAM officials, and a demonstration flight required for opera-tion in MCMA airspace. The active part of the balloon study occurred during the period 7–22 March when conditions were amenable to northward transport and precipitation was minimal. During the 16 days available for the study, six CMET balloons were flown for a total 86.5 h.
20
2.5 Targeted MCMA outflow events
The meteorology during the MILAGRO balloon study was characterized by two major outflow episodes (9–12 and 18–19 March) punctuated by Norte events on 14, 21, and 23 March (Fast et al., 2007). The successive Nortes, notable for their strong northerly winds (Mosino Aleman and Garcia, 1974), brought cleaner air and steadily increasing 25
ACPD
10, 3347–3399, 2010Long-range pollution transport during the
MILAGRO-2006 campaign
P. B. Voss et al.
Title Page
Abstract Introduction
Conclusions References
Tables Figures
◭ ◮
◭ ◮
Back Close
Full Screen / Esc
Printer-friendly Version
Interactive Discussion
2.5.1 9–12 March outflow
The first northeastward outflow event occurred during the period 9–12 March when a large and weakly organized synoptic high-pressure system was centered offthe east-ern coast of Florida. By 9 March, this system brought southwesterly winds aloft over central Mexico and northeastward transport of the MCMA pollution; the operational 5
model consensus was for north and eastward transport to continue through midday on 12 March. A CMET balloon launched on 9 March into this outflow failed due to an alti-tude overshoot. Despite this setback, the C-130 successfully found the urban outflow to the northeast on 10 March, in excellent agreement with the model predictions.
On 11 March, two more CMET balloons were launched from Teotihuacan 10
(21:40 UTC) and further south from Texcoco (00:47 UTC) where the air was visibly more polluted. The first balloon ascended to 4500 m and left the MCMA basin to the east. Three hours downwind, it turned 180◦, reentered the basin headed for the Mex-ico City airport, and was terminated after 9.2 h in the air (Fig 2a). The second balloon ascended to 4100 m (1800 m a.g.l.), headed due south out of the basin, and was ter-15
minated 150 km southwest of the city after 19.2 h aloft. These unexpected trajectories, which gave the CMET balloons their Spanish moniker “Los Globos Locos”, showed that at least some of the pollution north and east of the city was reingested and then left the basin through the south gap in the late afternoon and evening of 11 March. Consistent with this scenario, the C-130 was unable to locate significant urban pollution northeast 20
of the city on 12 March.
2.5.2 18–19 March outflow
A second major outflow event occurred during the period 15–19 March as high pres-sure moved eastward across central Mexico and over the Gulf. By 18 March, the system was centered above the Yucatan Peninsula, generating southerly winds aloft 25
ACPD
10, 3347–3399, 2010Long-range pollution transport during the
MILAGRO-2006 campaign
P. B. Voss et al.
Title Page
Abstract Introduction
Conclusions References
Tables Figures
◭ ◮
◭ ◮
Back Close
Full Screen / Esc
Printer-friendly Version
Interactive Discussion a deep convective boundary layer during the day (∼4 km a.g.l.) and was then
ported northeastward out of the basin in the afternoon and evening. This overall trans-port scenario on 18–19 March was clearly evident in the SO2signature at the surface. Nighttime drainage flow was seen to transport the plume from the Tula refinery com-plex north of the city southward into the MCMA basin on 17 March. In the early hours 5
of 18 March, a wind shift brought the Popocatepetl volcanic plume over the city and then began flushing all pollution out of the basin to the north (de Foy et al., 2009b).
During the afternoon of 18 March, the DOE G-1 and C-130 made extensive mea-surements of polluted air in the MCMA basin, fresh downwind emissions to the north, and cleaner air entering the basin from the south. Flight legs over the range of 3500– 10
4000 m (1500–2000 m a.g.l.) included an east-west intercomparison over T2 (20:45– 21:35 UTC) and multiple transects within the basin and along its southern edge (21:40– 23:00 UTC).
As the aircraft were leaving the basin in the late afternoon, two CMET balloons were launched from Tepeji del R´ıo: one at 22:30 UTC on 18 March and the other 1.5 h later 15
00:00 UTC on 19 March (Fig. 2a). The balloons ascended to their nominal float altitude of 3450 m with the first briefly overshooting and making a deep sounding to 6000 m. By shortly after 00:00 UTC, the two balloons were travelling together at the nominal float altitude over the Sierra Madre Oriental. Eleven hours later, as they drifted out over the Veracruz plain, they performed another set of deep soundings and then followed 20
the coastline north over the Gulf of Mexico (Fig. 2b). The balloons remained airborne for 29.5 and 24.8 h respectively, covered distances of 995 and 760 km, and together performed more than 20 soundings; late in the flight, their locations were used to guide the C-130 along a transect through the MCMA outflow. The remainder of this paper examines this transport event in greater detail.
ACPD
10, 3347–3399, 2010Long-range pollution transport during the
MILAGRO-2006 campaign
P. B. Voss et al.
Title Page
Abstract Introduction
Conclusions References
Tables Figures
◭ ◮
◭ ◮
Back Close
Full Screen / Esc
Printer-friendly Version
Interactive Discussion
3 Results and discussion
The measurements made by the MILAGRO aircraft and two CMET balloons during 18-19 March are among the most extensive to date in an MCMA outflow event. Using these data, we examine four phases of the MCMA outflow: well-mixed air exiting the basin, nighttime transport over the Sierra Madre Oriental, stratification above the Ver-5
acruz coastal plain, and shear-induced mixing and dispersion over the Gulf of Mexico. Strong wind shear over the Veracruz plain split the outflow into two transport pathways, both of which were likely encountered by the C-130 on 19 March. A third transport pathway, high-altitude advection of the upper portion of the MCMA residual layer, was also tracked by the balloons and likely encountered by the C-130. The MCMA outflow 10
that was transported along these three pathways was subjected to different conditions of temperature, humidity, and sunlight as it mixed to varying degrees with vastly dif-ferent background air; the extensive chemical and aerosol observations made by the C-130 during these encounters should therefore be of general interest to the MILAGRO scientific community.
15
3.1 Flight validation of CMET balloon measurements
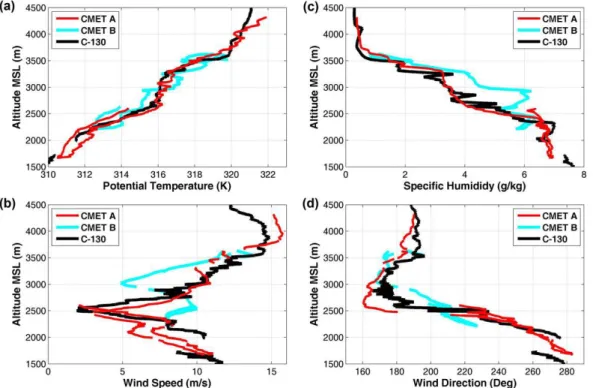
Because the ensuing analysis is dependent on the accuracy of the CMET balloon observations, the results of an opportunistic comparison with the C-130 are briefly dis-cussed. This encounter occurred between 18:15–18:24 UTC on 19 March (22.3◦N, 97.1◦W, 1500–4200 m) as the C-130 was descending over the Gulf of Mexico and both 20
CMET balloons were performing soundings. The balloons were a significant distance from each other (115 km) and from the C-130 (12–86 km for CMET A and 69–85 km for CMET B), so agreement within the reported instrument error is not expected. However, as shown in Fig. 3, the agreement among all the measurements (temperature, specific humidity, and winds) over the full altitude range of the comparison is surprisingly good. 25
ACPD
10, 3347–3399, 2010Long-range pollution transport during the
MILAGRO-2006 campaign
P. B. Voss et al.
Title Page
Abstract Introduction
Conclusions References
Tables Figures
◭ ◮
◭ ◮
Back Close
Full Screen / Esc
Printer-friendly Version
Interactive Discussion the profiles measured by the two identical balloons which are known to agree well with
each other over the longer course of the flight. In many cases, the reported instrument errors alone are much larger than the observed differences in the profiles (e.g., the er-ror on the C-130 wind speed is reported as±5 m/s). These results build confidence in the key measurements used in our study and attest to the spatial uniformity of the me-5
teorological fields during the period. Both of these conclusions strengthen the analysis of the MCMA transport on 18–19 March.
3.2 Initial conditions in the MCMA basin
The daytime conditions within the basin on 18 March were typical of a high-pollution episode in Mexico City. By mid-morning, the air in the high-altitude (2200 m) basin 10
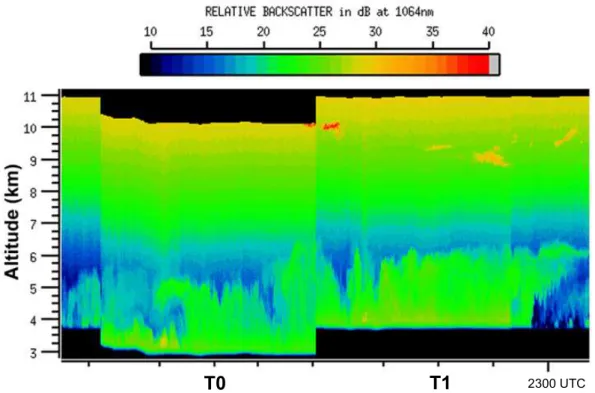
was warming rapidly under intense sunlight and moderate southwesterly winds aloft (5–10 m/s). Pollution entrained in the mixed layer (ML) was widely distributed across the north side of the basin (Fig. 4a) as evident from the C-130 tracer measurements (Fig. 5a). The Micropulse LIDAR at the T1 supersite showed the ML growing from approximately 2 km a.g.l. at 18:00 UTC (noon) to nearly 4 km a.g.l. by 23:00 UTC. In-15
frared SABL imagery from the final C-130 flight leg at approximately 23:00 UTC (Fig. 6) shows the nascent residual layer extending across the city to altitudes exceeding 6 km (4 km a.g.l.).
Intense solar heating and weak synoptic forcing typically result in high mixing heights over the MCMA basin (Whiteman et al., 2000; de Foy et al., 2006; Doran et al., 2007). 20
The mixing with very dry air aloft can associate MCMA pollution with low humidity. This can be seen in the pronounced anticorrelation between specific humidity and CO in the late afternoon on 18 March (compare Fig. 5a and b). The balloon measurements of specific humidity can therefore be used as an approximate tracer of the urban air, especially during the early portion of the flight. Furthermore, the relative humidity 25
ACPD
10, 3347–3399, 2010Long-range pollution transport during the
MILAGRO-2006 campaign
P. B. Voss et al.
Title Page
Abstract Introduction
Conclusions References
Tables Figures
◭ ◮
◭ ◮
Back Close
Full Screen / Esc
Printer-friendly Version
Interactive Discussion During the early evening, the balloon launch team observed that the air near Tepeji
del R´ıo became visibly more heterogeneous, likely as a result of drainage flows en-tering the basin and cleaner air arriving from the west (Fig. 4b). Despite this complex circulation, measurements made by the research aircraft, radar wind profilers at T1 and T2 (Fast et al., 2007), and CMET balloons all showed southerly flow above the basin 5
surface during the afternoon and evening. The winds measured by the C-130 within the core of the pollution (near T0 and T1) averaged 6.3 m/s at 173◦. These winds would carry the MCMA daytime emissions just east of the launch site as the two CMET bal-loon were released 22:30 and 00:00 UTC respectively. The balbal-loons thus marked the western side of the MCMA outflow that left the basin in the early evening.
10
3.3 Nighttime transport over complex terrain
During the night, the two CMET balloons tracked the MCMA outflow as it passed north and then turned northeast over the Sierra Madre Oriental. Repeated shallow soundings made by the balloons extended the vertical range of the measurements through a substantial layer between 2950–4400 m with less frequent soundings to as high as 15
4700 m. The resulting profile observations show that the initial nighttime phase of the transport was dominated by complex flow, mixing, and substantial heterogeneity in the meteorological fields.
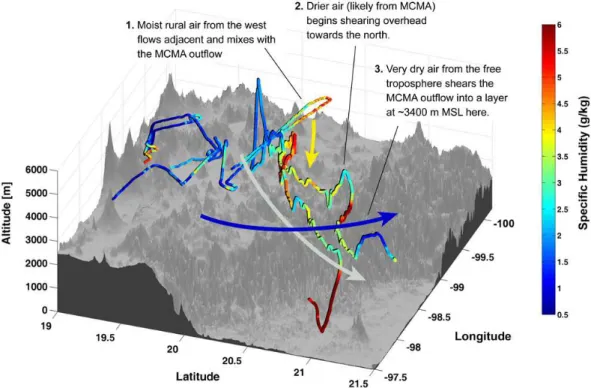
Above the Sierra Madre Oriental, the balloon observations reveal sharp gradients in the specific humidity with wet cool air at lower altitudes (reds and yellows), drier mixed 20
urban air just above (greens), and even drier air from the free troposphere (blues) at the highest altitudes observed (Fig. 7). This confluence of air masses was driven by directional wind shear with westerly flow below the balloons and southeasterly flow just above. Superimposed on this general flow regime was a complex mixing scenario driven by terrain following, thermal stratification, and possibly nocturnal jets. Through-25
ACPD
10, 3347–3399, 2010Long-range pollution transport during the
MILAGRO-2006 campaign
P. B. Voss et al.
Title Page
Abstract Introduction
Conclusions References
Tables Figures
◭ ◮
◭ ◮
Back Close
Full Screen / Esc
Printer-friendly Version
Interactive Discussion heterogeneity had little effect on the overall trajectories; the two balloons were within
10 km of each other as morning approached over the Veracruz plain 12 hours after launch.
3.4 Daytime transport over the Gulf of Mexico
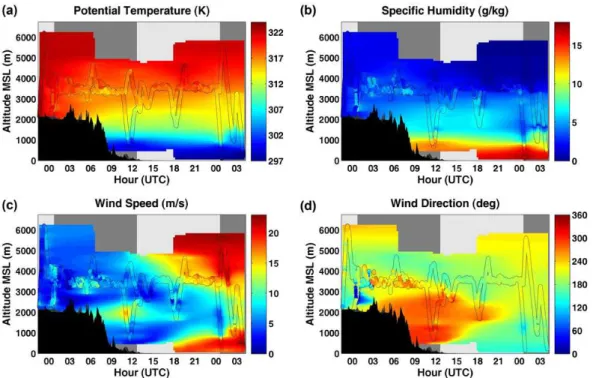
As the balloons passed over the Veracruz plain and the Gulf of Mexico, they were 5
commanded to perform periodic deep soundings to characterize the flow regime. Fig-ure 8 shows the profiles of potential temperatFig-ure, specific humidity, and winds evolv-ing in time as the outflow travelled from Mexico City (at left in plots) and approached US waters over the Gulf of Mexico 30 h later. The balloon observations are plotted as color spectra within the traces of the balloon flight paths; the background color, a two-10
dimensional linear interpolation weighted to emphasize the vertical structure, serves as an approximate visual aid.
The nighttime transport discussed previously is denoted by the dark shaded areas underlying all four plots between 00:00 and 12:00 UTC. The heterogeneity in the mete-orological fields during this period is readily apparent in all four panels a–d. In the early 15
morning hours, this partially homogenized outflow moved offthe plateau and over cool moist air being advected underneath from the northwest. The low-altitude air mass is seen in the temperature and humidity soundings at 12:00 and 18:00 UTC (light green shading in panels a–b) and especially in the wind fields (panels c–d).
The cooler air present below 2500 m established a stable thermal structure that ap-20
parently separated the outflow from the plateau terrain and sent it, at approximately constant altitude, out over the Gulf of Mexico. The lower portion of this outflow layer (2500–3500 m) appears to have been sheared to the east where it was intercepted by the C-130 at midday on 19 March. At the nominal altitude of the balloons, the outflow experienced much less shear and was transported largely intact to the north where it 25
ACPD
10, 3347–3399, 2010Long-range pollution transport during the
MILAGRO-2006 campaign
P. B. Voss et al.
Title Page
Abstract Introduction
Conclusions References
Tables Figures
◭ ◮
◭ ◮
Back Close
Full Screen / Esc
Printer-friendly Version
Interactive Discussion A more precise understanding of transport and mixing can be gained directly from
the profile observations as shown in Fig. 9. In these plots, the profiles are colored by time period and averaged to highlight the salient features. The inset (see panel a) shows the color scheme, timing, and grouping of the soundings. The averaged profiles for the two balloons are plotted separately (but not distinguished) in order to show when 5
variability is present in the meteorological fields.
The first sounding (black traces in panels a–d) occurred at launch near Mexico City and is from just one of the balloons (CMET A). The almost vertical profiles of potential temperature and specific humidity show that the air leaving the basin on 18 March was well mixed and that the top of the residual layer was above 6000 m (4000 m a.g.l.). 10
Away from the surface, the winds were light (2–5 m/s), relatively uniform, and from the south-southeast. Near the top of the residual layer, the winds increased to over 5 m/s and the direction turned towards the east. These winds would generally transport the pollution from the center of the city (Fig. 5a) towards the launch site while shearing the top of the residual layer offtowards the east.
15
A short distance downwind of MCMA, cool moist (and likely much cleaner) air began mixing into the outflow; the two balloons began reporting large differences in potential temperature, specific humidity, and wind direction, especially near the surface (diverg-ing green traces in panels a, b, and d). Above 4000 m, the balloons initially remained embedded in the undiluted outflow as evident from the consistent profiles there. Dur-20
ing the next phase of the transport (blue traces in all plots), they left the plateau and passed over the Gulf of Mexico at approximately 3400 m altitude. The cool air that ap-parently decoupled the outflow from the surface and sheared its lower reaches to the east is evident as a slight bulge in the temperature, humidity, and wind-speed profiles centered near 2000 m.
25
ACPD
10, 3347–3399, 2010Long-range pollution transport during the
MILAGRO-2006 campaign
P. B. Voss et al.
Title Page
Abstract Introduction
Conclusions References
Tables Figures
◭ ◮
◭ ◮
Back Close
Full Screen / Esc
Printer-friendly Version
Interactive Discussion at 3500 m, simply passed over a new air mass, with a different temperature structure,
and then descended into it during the soundings. However, this explanation seems unlikely given the approximate conservation of potential temperature (compare blue and red lines in panel a and specific humidity in panel b) in the layer. A more plausible explanation is that this flattening of the profiles represents a large-scale mixing event. 5
This vertical mixing may have been caused by warm-air advection as evident in the high wind speed and steep positive temperature gradient near the surface (red lines in Figs. 9a and c). This apparent mixing nearly reached the altitude of the balloons and their associated outflow; if the mixing had propagated a hundred meters or so higher, it likely would have dissipated the pollution encountered by the C-130 during one of the 10
key intercepts of the 19 March flight.
The evolution of the MCMA outflow at higher altitudes is less certain because there are only a few CMET balloon soundings above 4500 m. However, it is known that the residual layer was well mixed with a potential temperature of approximately 322 K and relative humidity less than 65% up to at least 6200 m. Near the top of the residual 15
layer, this potential temperature is similar to that of the surrounding free troposphere. At lower altitudes, the outflow is 1–5 K warmer than the surrounding air as evident from rawinsonde profiles (Mexico City and Acapulco stations) as well as from the CMET balloon soundings further downwind; the resulting buoyancy (3–15 g/kg lift in balloon lexicon) likely makes the lower altitude outflow more susceptible to lofting and upward 20
mixing into any cooler air advected overhead. The upper portions of the residual layer, which are similar in potential temperature to the free troposphere, may therefore be better preserved during long-range transport.
The most important information from the profile analysis, however, is that there ap-pears to be no large-scale ascent or descent during the transport event. The profiles 25
ACPD
10, 3347–3399, 2010Long-range pollution transport during the
MILAGRO-2006 campaign
P. B. Voss et al.
Title Page
Abstract Introduction
Conclusions References
Tables Figures
◭ ◮
◭ ◮
Back Close
Full Screen / Esc
Printer-friendly Version
Interactive Discussion (Fig. 8) reinforces this view that the MCMA outflow decoupled from the surface as it
moved out over the Gulf of Mexico. Some vertical motion in the form of orographic waves, terrain following, and synoptic-scale convergence certainly does occur and is a significant uncertainty in the ensuing trajectory analysis. Overall, however, the effect of vertical motion appears to be small and a meaningful understanding of transport can be 5
gained by assuming constant-altitude flow on 18–19 March. With this understanding, the evolving wind profiles can be used to calculate trajectories in the general vicinity of the balloons over the entire altitude range of the soundings.
3.5 Balloon-based trajectories
In this section, horizontal trajectories are computed directly from the balloon wind pro-10
files and used to advect the MCMA outflow over a period of approximately 30 h. While such an approach may appear to be simplistic in comparison to more sophisticated transport models, it has the benefit of being tied irrefutably to observations: thousands of individual wind measurements made at approximately the right place and time for quantifying a transport event.
15
3.5.1 Trajectory calculations
The details of the trajectory calculations are briefly described here. First, time and altitude bins are established over the range of the balloon flight and then mean wind speeds (zonal and meridional) are calculated for each bin for which data are available. Wind speeds for each of the bins that do not contain data are then estimated from the 20
mean (weighted by inverse-distance) of the nearby bins that do. Time and distance are weighted by different constants so that the fit approximates the horizontal structure seen in the balloon soundings. Figure 8c–d shows a similar fit for wind speed and di-rection. Once the fit is established, zonal and meridional winds can then be estimated at any time or altitude during the flight and integrated in time to create trajectories. The 25
ACPD
10, 3347–3399, 2010Long-range pollution transport during the
MILAGRO-2006 campaign
P. B. Voss et al.
Title Page
Abstract Introduction
Conclusions References
Tables Figures
◭ ◮
◭ ◮
Back Close
Full Screen / Esc
Printer-friendly Version
Interactive Discussion field is uniform (a function of time only). The distance between the trajectories and the
balloons is generally small because they are following the same air mass. The unifor-mity of the wind field is also known, to a degree, due to the horizontal separation of the two balloons. In the end, the trajectories at each altitude are computed individually us-ing independent wind observations at each altitude level; their subsequent stackus-ing to 5
form coherent structures attests to the validity of the technique and the high accuracy of the GPS wind data.
The overall spatial uniformity of the flow is verified by the measured wind profiles in Fig. 9; profiles from the two balloons (lines of the same color) almost invariably have the same magnitudes and vertical structure. The exceptions occur in the complex flow over 10
the Sierra Madre Oriental (green lines diverge) and at the end of the flight when the flow is accelerating and the profiles are simply measured at different times (red lines). The many small differences in the wind profiles average out during the integration of the trajectories and therefore have little effect on the overall results. In the vertical dimension, the trajectories are constrained to constant altitudes based on the analysis 15
of the profile data in the previous section. With no evidence for widespread ascent or descent, the constant-altitude trajectories are expected to be generally representative of the bulk transport.
3.5.2 Trajectory intercepts with the C-130
The computed trajectories for the 18–19 March transport event are shown in Fig. 10. 20
Low-altitude trajectories (black) were initialized from the Tepeji del R´ıo launch site at 00:00 UTC on 18 March and then advected along with the balloons. High-altitude tra-jectories (blue) were started in the center of the city one hour earlier when the polluted residual layer was known to be at that location. The trajectories are shown as the thicker horizontally oriented lines at 100-m (black) or 200-m (blue) altitude intervals; 25
ACPD
10, 3347–3399, 2010Long-range pollution transport during the
MILAGRO-2006 campaign
P. B. Voss et al.
Title Page
Abstract Introduction
Conclusions References
Tables Figures
◭ ◮
◭ ◮
Back Close
Full Screen / Esc
Printer-friendly Version
Interactive Discussion and are therefore addressed separately in the discussion. Trajectories between these
levels have been left offthe plot to preserve its visual clarity.
When the balloon trajectories are run forward from Mexico City, they intercept the C-130 flight track on three occasions at approximately the correct latitude, longitude, altitude, and time. These intercepts include a dive and subsequent ascent near 22◦N 5
latitude (18:18–18:23 UTC and 18:53–18:5 UTC respectively), a pair of high-altitude transects near 27.5◦N (21:19–21:35 UTC and 22:07–22:18 UTC respectively), and a mid-level transect that deliberately crossed the paths of the two CMET balloons near 24◦N latitude (23:25–23:33 UTC). In all three of these intercepts, the urban tracer species measured by the C-130 peak at almost the exact times expected from the 10
trajectories. In Fig. 10, ozone is used as the tracer because it is measured at high time resolution and the data are available during all three intercepts. To keep the im-age readable, the flight track of the C-130 (red line) is colored by the measured ozone mixing ratio only in the vicinity of the intercepts.
The intentional mid-level transect is the most certain of three intercept groups be-15
cause it is well aligned in space and time and because the CMET balloons were gener-ally in close proximity to the outflow at this altitude. Trajectories from the Tepeji del R´ıo launch site arrive at the C-130 intercept location after 22.5 h (1 h ahead of the aircraft). Trajectories from the center of MCMA, while less exact in their timing, arrive after 24 h (0.5 h after the aircraft has passed). As discussed in Sect. 3.7, the trajectories and the 20
CMET B balloon both cross the C-130 transect near the point where the mixing ratios of urban tracers peak.
The dive and ascent intercepts, in comparison, were not as well matched in time or as close to the CMET balloons during transit. The dive occurred 2–4 h before the 20-h trajectories from the center of MCMA arrived. The subsequent ascent occurred 1–3 h 25
ACPD
10, 3347–3399, 2010Long-range pollution transport during the
MILAGRO-2006 campaign
P. B. Voss et al.
Title Page
Abstract Introduction
Conclusions References
Tables Figures
◭ ◮
◭ ◮
Back Close
Full Screen / Esc
Printer-friendly Version
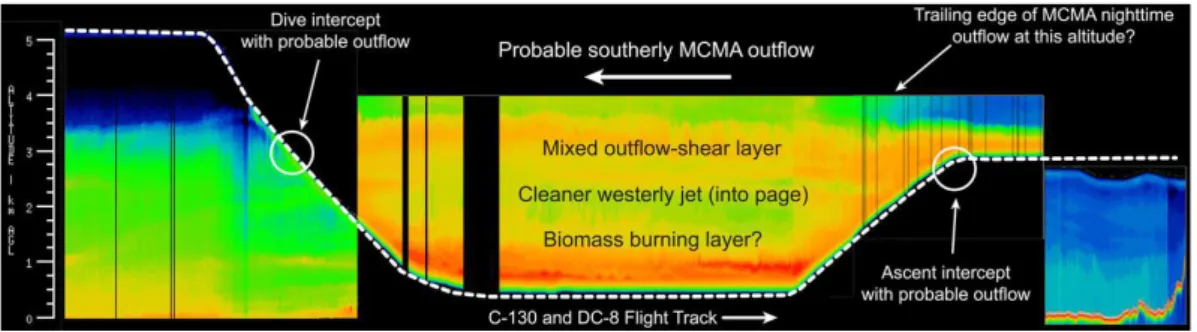
Interactive Discussion and time to have sampled low-level MCMA outflow from the previous afternoon and
evening as it was being sheared by the westerly jet. Figure 11 shows the SABL (lidar) imagery from the C-130 as it flew in tandem with the NASA DC-8 directly underneath the predicted location of the outflow. The dive and ascent intercepts bracket this un-derpass, increasing our confidence in the overall interpretation.
5
The high-altitude trajectories, which show the probable path of upper residual layer, are also subject to significant uncertainty. These trajectories are at the upper end of the CMET balloon altitude range and are therefore based largely on two deep sound-ings: one at launch near Mexico City (23:30 UTC on 18 March) and the other over the Gulf of Mexico (20 March at 00:30 UTC). During this period, the wind direction was re-10
markably steady over the altitude range 5000–5600 m (Fig. 9d). The wind speed, while increasing with time, was nearly constant with altitude over the range 4000–5600 m (black, red, and right blue lines in Fig. 9c). These attributes of the upper level winds on 18–19 March allow trajectories to be calculated directly from the two soundings. The simplest calculation advects the MCMA residual layer using wind speed and direction 15
estimated by linear interpolation between the sounding times. The resulting trajecto-ries directly intercept the most heavily polluted air observed over the Gulf of Mexico on 19 March. The trajectories, however, are too long and arrive at the C-130 intercept location approximately 2 h before the aircraft.
These linearly interpolated trajectories represent an upper bound with respect to 20
length because the actual wind speed increases only near the end of the flight, at least over the range 4000–4500 m where sufficient data are available to determine the time dependence (Fig. 9c). A more nuanced trajectory calculation takes the observed ac-celeration into account by using the measured wind speed from a third sounding (up to 4640 m at 18:20 UTC) as a lower-bound estimate of the wind speed at 5000 m at this 25
ACPD
10, 3347–3399, 2010Long-range pollution transport during the
MILAGRO-2006 campaign
P. B. Voss et al.
Title Page
Abstract Introduction
Conclusions References
Tables Figures
◭ ◮
◭ ◮
Back Close
Full Screen / Esc
Printer-friendly Version
Interactive Discussion the aircraft has past. Trajectories between these upper and lower bounds, originating
over the center of MCMA at 22:30 UTC on 18 March, plausibly intercept the C-130 over the Gulf of Mexico at the correct time of 21:30 UTC on 19 March. We note that the un-certainty in the high-altitude trajectories is substantial and caution against interpreting the timing of the intercept too exactly. However, since the mixed layer over MCMA only 5
exceeded 5000 m altitude late in the afternoon on 19 March (after ∼22:00 UTC), the intercepted outflow would likely have begun its journey at approximately this time.
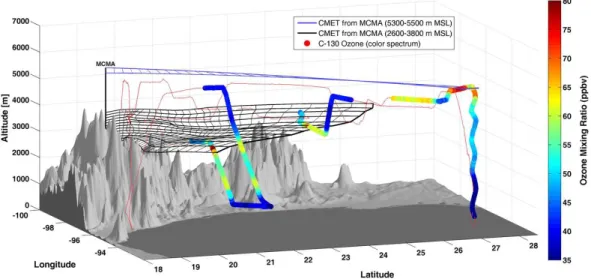
Figure 12 shows an elevation view of the high-altitude trajectories superimposed the C-130 ozone measurements. The blue mesh shows trajectories originating at the cen-ter of MCMA while the green line shows the ending location for trajectories originating 10
from Puebla, approximately 150 km to the east. The shear in the calculated trajecto-ries matches almost exactly the diagonal structure in the ozone observations and in the SABL imagery (Fig. 13). The agreement between the observed and calculated shear indicate that the transit time and shearing rate estimated from the balloons is likely the same as that in the real atmosphere.
15
Given the uncertainties in the high-altitude trajectories, however, it is not possible to attribute this intercept definitively to MCMA. Trajectories run from Puebla/Atlixco area (pop. 1.6 million), while much less certain due to their distance from the balloons, also intercept the apparent outflow. Even so, the large size of the polluted air mass, its better alignment with the MCMA trajectories, and C-130 SABL imagery showing only 20
clean air above are more consistent with an MCMA intercept. If the intercepted air can be linked to MCMA with certainty, then the trajectories show that it is very likely the top of the residual layer that would have left MCMA approximately 23 h earlier.
The persistent wind shear can also be used to identify C-130 measurements that are unlikely to have originated in Mexico City. For example, the strong easterly shear 25
ACPD
10, 3347–3399, 2010Long-range pollution transport during the
MILAGRO-2006 campaign
P. B. Voss et al.
Title Page
Abstract Introduction
Conclusions References
Tables Figures
◭ ◮
◭ ◮
Back Close
Full Screen / Esc
Printer-friendly Version
Interactive Discussion the east of Mexico City. Balloon-based trajectories originating from this plateau are
too uncertain to pinpoint the source of the emissions; however, they indicate the MTBE emissions may be from either the Puebla/Atlixco area or the Xalapa/C ´ordoba/Tehauc ´an region (pop. 850 000) further to the east.
3.6 WRF-FLEXPART model trajectories
5
The transport models employed for the MILAGRO campaign predicted the same over-all northward transport that was observed by the CMET bover-alloons on 18–19 March. The models, however, differ considerably from the balloon observations in some of the de-tails. Figure 14, for example, shows WRF-FLEXPART model predictions (here based on WRF using the GFS analysis step) for an ensemble of particles released at 3400 m 10
altitude at the time and location of the CMET balloon launch. Viewed from above (Fig. 14a), the model trajectories overlay the balloon tracks with high fidelity. Further-more, the model captures some of the mixing and dispersion that is occurring in the atmosphere but is not measured by the balloons or captured in the simple trajectories in Figs. 10 and 12. As shown in Fig. 14b, however, the WRF-FLEXPART trajectories 15
do not decouple from the plateau, but rather follow the terrain down over the Veracruz plain and decouple over the much lower marine boundary layer as described by Fast et al. (2007). This difference in terrain-following behavior may be caused in part by the cool westerly jet that is seen in the balloon profiles but appears to be absent in the models. These two scenarios describe the same general transport to the northeast, 20
but have somewhat different implications for the dispersion of the MCMA pollutants and potential impact on surface-level air quality downwind. It remains to be determined how the MCMA outflow typically behaves and if the event of 18–19 March was representa-tive of northeastward transport more generally. It is apparent, however, that mesoscale thermal structure can have substantial effects on the MCMA outflow by modulating both 25
ACPD
10, 3347–3399, 2010Long-range pollution transport during the
MILAGRO-2006 campaign
P. B. Voss et al.
Title Page
Abstract Introduction
Conclusions References
Tables Figures
◭ ◮
◭ ◮
Back Close
Full Screen / Esc
Printer-friendly Version
Interactive Discussion al., 2005), the thermal structure and winds of the larger Mesa Alta may have significant
effects on regional transport.
3.7 Aircraft tracer observations during trajectory intercepts
The three aircraft intercepts with balloon-based trajectories are examined more closely here using a small subset of the chemical and tracer measurements on the C-130. 5
The goal of the analysis was to determine if the trajectory intercepts are aligned with features in the tracer field that are consistent with MCMA air. Such alignment would generally increase confidence in the balloon-based trajectories and the transport sce-narios described in this paper. The first of the trajectory intercepts, a C-130 dive early in the flight, likely sampled the layer of sheared outflow being transported over the Ve-10
racruz plain. The second intercept, discussed last below, was the highest in altitude and furthest downwind; it is linked by the trajectories to the top of the MCMA residual layer from the previous day. The final intercept, the transect deliberately made by the C-130 across the path of the balloons, also occurred over the Gulf of Mexico but at much lower altitudes (3240 m) and approximately 400 km closer to Mexico City.
15
During the dive intercept (the ascent is not shown here), the C-130 passed through a substantial layer of urban pollution (Fig. 15a) near the top of the westerly shear layer (2500–3200 m). The balloon trajectories suggest that this air likely left Mexico City approximately 18–24 h prior to sampling, most probably in the afternoon. The profile shows marked increases in both MTBE (an urban tracer) and HCN (and indicator of 20
biomass burning) in what appears to be the MCMA layer. Below this, the aforemen-tioned westerly jet isolates the MCMA outflow from another polluted layer centered at 1500 m and arriving from the west (see also Fig. 10). This lower layer may be biomass burning pollution or, perhaps less likely, a branch of the MCMA outflow that followed the terrain down from the plateau and spread out over the marine boundary layer (e.g., 25
ACPD
10, 3347–3399, 2010Long-range pollution transport during the
MILAGRO-2006 campaign
P. B. Voss et al.
Title Page
Abstract Introduction
Conclusions References
Tables Figures
◭ ◮
◭ ◮
Back Close
Full Screen / Esc
Printer-friendly Version
Interactive Discussion species, NOy tends to be conserved during transport and therefore acts as an
approx-imate tracer of combustion. Ozone is not considered to be a reliable tracer due to the significant production and loss that can occur on a time scale of hours; it is, however, an indicator of anthropogentic influence, a criteria pollutant, and a reactive trace gas that has substantial influence on the overall chemistry. The heavy biomass burning in and 5
around the MCMA basin (Yokelson, 2007; Crounse et al., 2009) typically confounds the urban and rural signatures, especially during the dry season in March. The elevated concentrations of both HCN and MTBE in the upper layer are therefore consistent with the conflated signature of MCMA air. The much lower concentration of MTBE (relative to HCN) in the lower layer suggests it may be of rural origin.
10
The third intercept in sequence on 19 March is linked by the trajectories to mid-level outflow just above the shear layer. Figure 15c shows the tracer data from this intercept. The balloon-based trajectories (not shown in the figure) are towards the viewer and slice through the plot at approximately the same point as the actual CMET B balloon (denoted by a red circle). The alignment is not quite as exact as it may appear 15
because the balloon is believed to have marked the western portion of the outflow. Furthermore, the width of the urban feature is approximately 20% narrower than the width of the polluted MCMA air mass on 18 March (Fig. 5b). The MCMA trajectories, however, are approximately an hour downwind (∼50 km) at the time of the intercept, so it is conceivable that the tracer spike in Fig. 15c represents the narrower trailing portion 20
of the MCMA residual layer. It is also entirely possible that this apparent intercept is simply an improbable coincidence. Arguing against this notion is the fact that the CMET balloons made 30 shallow soundings and 150 independent wind measurements, evenly distributed in time, at the level of the intercept (3240±50 m). The cumulative wind shear during transit was moderate at this level (Fig. 12) and the large-scale mixing 25
ACPD
10, 3347–3399, 2010Long-range pollution transport during the
MILAGRO-2006 campaign
P. B. Voss et al.
Title Page
Abstract Introduction
Conclusions References
Tables Figures
◭ ◮
◭ ◮
Back Close
Full Screen / Esc
Printer-friendly Version
Interactive Discussion background pollution (to the left of the intercept in Fig. 15c) is less certain; it should
not be considered a priori to have originated from MCMA without careful analysis of its chemical and physical composition.
The second trajectory intercept with the C-130 differs substantially from first and the third. Occurring at 5400 m, it is linked by the balloon-based trajectories to the top of the 5
MCMA residual layer from the previous day. Figure 15b shows that this intercept had higher levels of all urban tracers than the others, possibly because it was transported at high altitude with relatively less wind shear and thermal buoyancy (Fig. 9). The elevated ozone mixing ratio (∼80 ppbv) is also consistent with the faster photochemical forma-tion rates that have been observed at the top of the mixed later in Mexico City (Raga 10
and Raga, 2000). While CO, O3, and HCN were all elevated in comparison with the other intercepts (e.g., 161 ppbv CO vs. 160 and 151 from the Fig. 15 caption), MTBE was more than double that measured during the other intercepts (39.5 pptv vs. 14.0 and 10.5). This may be an indication that the high-altitude mixed layer over Mexico City was more influenced by the urban activities directly beneath it. Alternatively, the 15
low-altitude transport pathways may simply mix with more biomass emissions on their way out of the city and over the plateau. Confounding this situation is the fact that many of the urban species in the high-altitude outflow are being diluted by much lower background concentrations. For example, the 160 ppbv CO in the aged outflow is be-ing mixed with 65 ppbv CO background air in the high-altitude scenario but 110 ppbv 20
(or more) in the low-altitude outflow. The mixing must be substantially slower at high altitude just to maintain the same dilution rate. These questions about the formation and transport of the upper residual layer are beyond the scope of this paper.
All three C-130 intercepts are notable in that the urban tracer concentrations peak where the trajectories predict they should and not at other locations nearby. In every 25
ACPD
10, 3347–3399, 2010Long-range pollution transport during the
MILAGRO-2006 campaign
P. B. Voss et al.
Title Page
Abstract Introduction
Conclusions References
Tables Figures
◭ ◮
◭ ◮
Back Close
Full Screen / Esc
Printer-friendly Version
Interactive Discussion calculations were tested with different fitting schemes, initializations, and assumptions.
Invariably, all of these tests arrived at approximately the same result showing the three intercepts described in this paper. This consistency may be attributable to the large amount of in-situ profile data constraining the trajectories, the uniformity of the wind fields on 18–19 March, and the substantial size of the MCMA outflow, which dwarfs the 5
many smaller anomalies in the meteorological fields. Collectively, these factors make the case that the transport of MCMA pollution on 18–19 March is understood with a reasonably high degree of certainty.
4 Summary and conclusions
A major goal of the MILAGRO campaign was to determine the regional impacts of air 10
pollution from Mexico City, one of the largest megacities in the western hemisphere. This paper focuses on a single event on 18–19 March that carried polluted MCMA out-flow northward over the Gulf of Mexico. The event was observed directly by two small balloons that drifted downwind with the outflow for 29 h while performing 20 soundings and making 4850 observations of winds and state variables. Through these data, we 15
witness the MCMA outflow churned over the Sierra Madre Oriental, sheared into a thin layer over the Veracruz plain, and dispersed widely across the Gulf of Mexico.
Trajectories computed directly from the balloon winds identify three transport path-ways on 18–19 March: low-altitude outflow that was sheared over the Veracruz plain by a strong jet below, mid-level outflow that travelled north along coastline with little 20
shear, and high-altitude outflow that carried the upper portion of the MCMA residual layer across the Gulf of Mexico and nearly into Texas in a single day. The three C-130 aircraft intercepts with the balloon-based trajectories, all of which have high levels of urban tracers, suggest that the overall transport on 18–19 March is being described accurately. Confidence in these results is enhanced by the two independent balloons, 25
ACPD
10, 3347–3399, 2010Long-range pollution transport during the
MILAGRO-2006 campaign
P. B. Voss et al.
Title Page
Abstract Introduction
Conclusions References
Tables Figures
◭ ◮
◭ ◮
Back Close
Full Screen / Esc
Printer-friendly Version
Interactive Discussion The high-altitude transport pathway, in particular, is also consistent with recent
find-ings by Subramanian et al. (2010) that show the intercepted aerosols appear to be one day old. Previous estimates of a two-day transit time did not take into account the bino-mial age distribution predicted by the WRF-FLEXPART model or the faster winds aloft that are not represented in the balloon position data. Preliminary Lagrangian model 5
runs using the G-1/C-130 aircraft data and trajectories presented here, also appear to be self-consistent (Zaveri et al., 2008). A detailed investigation of the evolution of aerosols and trace gases in the 18–19 March outflow will be presented in a subsequent publication by Zaveri et al.
An image that emerged early during the MILAGRO campaign was that of the Gulf 10
of Mexico as a brew of pollution that lacked discernable source-receptor relationships. Our results challenge this notion by suggesting that polluted air originating from the larger source regions can retain its identity for more than 24 h and, at higher altitudes, likely much longer. These results complement the global and regional models used to understand transport by providing a detailed view of one event, limited in time and 15
space, but likely representative of certain aspects of Mexico City outflow more broadly; the role of mesoscale thermal structure in decoupling the outflow from the plateau is an example of these more general findings.
The MILAGRO campaign, in addition to its scientific success, reached new mile-stones in the efficient integration and dissemination of data from a wide array of plat-20
forms and instrumentation. The ways in which data can be distributed, processed and visualized, however, are rapidly evolving due, in part, to the phenomenal growth of Unmanned Aerial Systems (UAS). The CMET balloons share with UAS some of the same challenges of communication, data visualization, and long-distance control. The balloon operations have therefore followed a similar path and can now generate, during 25
ACPD
10, 3347–3399, 2010Long-range pollution transport during the
MILAGRO-2006 campaign
P. B. Voss et al.
Title Page
Abstract Introduction
Conclusions References
Tables Figures
◭ ◮
◭ ◮
Back Close
Full Screen / Esc
Printer-friendly Version
Interactive Discussion
Acknowledgements. We gratefully acknowledge the support of the National Science
Foun-dation Atmospheric Chemistry Program (Grant Numbers: ATM-0511833, ATM-0810950, and ATM-0511803), the National Center for Atmospheric Research (NCAR), the Servicios a la Navegaci ´on en el Espacio A ´ereo Mexicano (SENEAM), Instituto Nacional de Ecolog´ıa (INE), pilots and crew of the C-130, Jos ´e Meit´ın at NCAR, Sandra I. Ram´ırez Jim ´enez at the Centro
5
de Ciencias de la Atm ´osfera, Universidad Nacional Aut ´onoma de M ´exico, and our many gra-cious hosts in Mexico. Data provided by NCAR/EOL under sponsorship of the National Science Foundation.
References
Apel, E. C., Hills, A. J., Lueb, R., Zindel, S., Eisele, S., and Riemer, D. D.: A Fast-GC/MS
10
system to measure C2 to C4 carbonyls, and methanol aboard aircraft, J. Geophys. Res., 108, 8794, doi:10.1029/2002JD003199, 2003.
Apel, E. C., Hills, A. J., Flocke, F., Zheng, W., Fried, A., Weibring, P., McKenna, D., Emmons, L., Orlando, J., Karl, T., Campos, T., Riemer, D. D., Atlas, E., Blake, D., Olson, J., Chen, G., Crawford, J., and Sive, B.: Observations of volatile organic compounds downwind of
15
Mexico 20 City during MIRAGE-MEX, Eos Trans. AGU, 88(52), Fall Meet. Suppl., Abstract A41F-02, 2007.
Apel, E. C., Emmons, L. K., Karl, T., Flocke, F., Hills, A. J., Madronich, S., Lee-Taylor, J., Fried, A., Weibring, P., Walega, J., Richter, D., Tie, X., Mauldin, L., Campos, T., Sive, B., Kleinman, L., Springston, S., Zaveri, R., Ortega, J., Voss, P., Blake, D., Baker, A., Warneke,
20
C., Welsh-Bon, D., de Gouw, J., Zheng, J., Zhang, R., Rudolph, J., Junkermann, W., and Riemer, D. D.: Chemical evolution of volatile organic compounds in the outflow of the Mexico City Metropolitan area, Atmos. Chem. Phys. Discuss., 9, 24085–24143, 2009,
http://www.atmos-chem-phys-discuss.net/9/24085/2009/.
Banta, R. M.: Vertical wind velocities from superpressure balloons: A case study using Eole
25
data, Mon. Weather Rev., 104, 628–640, 1976.