www.atmos-chem-phys.net/16/9003/2016/ doi:10.5194/acp-16-9003-2016
© Author(s) 2016. CC Attribution 3.0 License.
Linking variations in sea spray aerosol particle hygroscopicity to
composition during two microcosm experiments
Sara D. Forestieri1, Gavin C. Cornwell2, Taylor M. Helgestad1, Kathryn A. Moore2, Christopher Lee2, Gordon A. Novak3, Camille M. Sultana2, Xiaofei Wang2, Timothy H. Bertram2,3, Kimberly A. Prather2,4, and Christopher D. Cappa1
1Department of Civil and Environmental Engineering, University of California, Davis, CA 95616, USA 2Department of Chemistry and Biochemistry, University of California, San Diego, La Jolla, CA 92093, USA 3Department of Chemistry, University of Wisconsin, Madison, WI 53706, USA
4Scripps Institution of Oceanography, 9500 Gilman Drive, La Jolla, CA 92093, USA
Correspondence to:Christopher D. Cappa ([email protected])
Received: 14 January 2016 – Published in Atmos. Chem. Phys. Discuss.: 25 January 2016 Revised: 20 June 2016 – Accepted: 21 June 2016 – Published: 22 July 2016
Abstract. The extent to which water uptake influences the light scattering ability of marine sea spray aerosol (SSA) par-ticles depends critically on SSA chemical composition. The organic fraction of SSA can increase during phytoplankton blooms, decreasing the salt content and therefore the scopicity of the particles. In this study, subsaturated hygro-scopic growth factors at 85 % relative humidity (GF(85 %)) of predominately submicron SSA particles were quantified during two induced phytoplankton blooms in marine aerosol reference tanks (MARTs). One MART was illuminated with fluorescent lights and the other was illuminated with sun-light, referred to as the “indoor” and “outdoor” MARTs, re-spectively. Optically weighted GF(85 %) values for SSA par-ticles were derived from measurements of light scattering and particle size distributions. The mean optically weighted SSA diameters were 530 and 570 nm for the indoor and outdoor MARTs, respectively. The GF(85 %) measurements were made concurrently with online particle composition measurements, including bulk composition (using an Aero-dyne high-resolution aerosol mass spectrometer) and single particle (using an aerosol time-of-flight mass spectrometer) measurement, and a variety of water-composition measure-ments. During both microcosm experiments, the observed optically weighted GF(85 %) values were depressed substan-tially relative to pure inorganic sea salt by 5 to 15 %. There was also a time lag between GF(85 %) depression and the peak chlorophyll a (Chla) concentrations by either 1 (in-door MART) or 3-to-6 (out(in-door MART) days. The fraction
of organic matter in the SSA particles generally increased after the Chl a peaked, also with a time lag, and ranged from about 0.25 to 0.5 by volume. The observed depres-sion in the GF(85 %) values (relative to pure sea salt) is consistent with the large observed volume fractions of non-refractory organic matter (NR-OM) comprising the SSA. The GF(85 %) values exhibited a reasonable negative correlation with the SSA NR-OM volume fractions after the peak of the blooms (i.e., Chla maxima); i.e., the GF(85 %) values generally decreased when the NR-OM volume fractions in-creased. The GF(85 %) vs. NR-OM volume fraction relation-ship was interpreted using the Zdanovskii–Stokes–Robinson (ZSR) mixing rule and used to estimate the GF(85 %) of the organic matter in the nascent SSA. The estimated pure NR-OM GF(85 %) values were 1.16±0.09 and 1.23±0.10 for the indoor and outdoor MARTS, respectively. These mea-surements demonstrate a clear relationship between SSA par-ticle composition and the sensitivity of light scattering to variations in relative humidity. The implications of these ob-servations to the direct climate effects of SSA particles are discussed.
1 Introduction
source of natural aerosols to the atmosphere and dominate the pre-industrial clear-sky direct radiative effects over the ocean (Haywood et al., 1999). Breaking waves in the ocean entrain air into seawater, leading to the formation of bubbles, which burst at the ocean’s surface and produce SSA particles (Lewis and Schwartz, 2004). The climate impacts of SSA particles depend critically on their composition, shape, and size (Carslaw et al., 2013; Pilinis et al., 1995). Given typical size distributions for particles in the marine boundary layer, both the submicron (300–1000 nm) and supermicron (∼1– 5 µm) size ranges contribute to light scattering, with the rel-ative contributions varying depending on location and con-ditions (Kleefeld et al., 2002). Under humidified concon-ditions, the size of SSA particles is modified through water uptake and loss, which are strong functions of chemical composition (Saxena et al., 1995). The overall mass of SSA particles is dominated by sodium chloride and other inorganic ions, but organic compounds can also contribute substantially to the total mass, especially in the submicron size regime (Facchini et al., 2008; Keene et al., 2007; O’Dowd et al., 2004). Larger organic-matter-to-salt ratios occur in the submicron mode through the formation of film drops, since surface-active or-ganics can become enriched in the thin film prior to bubble bursting (Skop et al., 1994; Stefan and Szeri, 1999; Tseng et al., 1992), but it has also been shown that supermicron par-ticles can contain organic and biological markers (Quinn et al., 2015). Since organic compounds are universally less hy-groscopic than inorganic sea salt (Petters and Kreidenweis, 2007), their transfer to SSA will lead to less water uptake and, thus, less scattering than in the case of pure inorganic sea salt particles of the same size.
Previous studies have linked the suppression of water up-take of ambient SSA particles to increasing fractions of marine-derived organic matter in the ambient atmosphere (Vaishya et al., 2013; Ovadnevaite et al., 2011; Lawler et al., 2014; Hegg et al., 2008; Zhang et al., 2014). Phyto-plankton blooms lead to chemical changes in seawater and serve as a source of particulate and dissolved organic car-bon (DOC) to the system, which is then processed by other micro-organisms as part of the microbial loop (Pomeroy et al., 2007). These chemical and biological changes in the sea-water can impact SSA particle composition (Prather et al., 2013; Lee et al., 2015; O’Dowd et al., 2004). The organic fraction of SSA particles has been correlated to metrics for high biological activity, such as chlorophylla, in some stud-ies (O’Dowd et al., 2004; Facchini et al., 2008) but not oth-ers (Quinn et al., 2014). Some lab studies have observed small depressions in water uptake by SSA particles produced from natural seawater relative to synthetic, inorganic seawa-ter (Sellegri et al., 2008; Modini et al., 2010; Fuentes et al., 2011; Park et al., 2014). However, all of these studies have focused on particles smaller than∼150 nm, for which varia-tions in composition have bigger impacts on cloud condensa-tion nuclei concentracondensa-tions (Dusek et al., 2006; Farmer et al., 2015). Substantially less is understood about the connections
between seawater composition and the water uptake prop-erties of the larger submicron particles that contribute more to light scattering. The connection between biological and chemical characteristics of seawater and the resulting SSA particle composition, and consequently hygroscopicity, has therefore not been fully established.
To better understand the connection between SSA particle composition and water uptake as it relates to light scattering in particular, two microcosm experiments were conducted in July 2014 as part of IMPACTS (Investigation into Ma-rine Particle Chemistry and Transfer Science). Through the addition of light and nutrients, phytoplankton blooms were induced in natural seawater. Marine aerosol reference tanks (MARTs) were used to produce SSA particles via intermit-tent plunging of a sheet of water, which reproduces the bub-ble size distribution of whitecaps in the ocean (Lee et al., 2015; Stokes et al., 2013). Studying the SSA particles pro-duced during these microcosm studies can provide insights into the linkage between hygroscopicity of nascent SSA par-ticles and ocean biology in an environment that is isolated from anthropogenic influence or background particles. The simultaneous measurement of submicron SSA particle wa-ter uptake and of particle composition here demonstrate that variations in seawater biology and composition influence wa-ter uptake by SSA particles.
2 Methods
2.1 MART description and operation
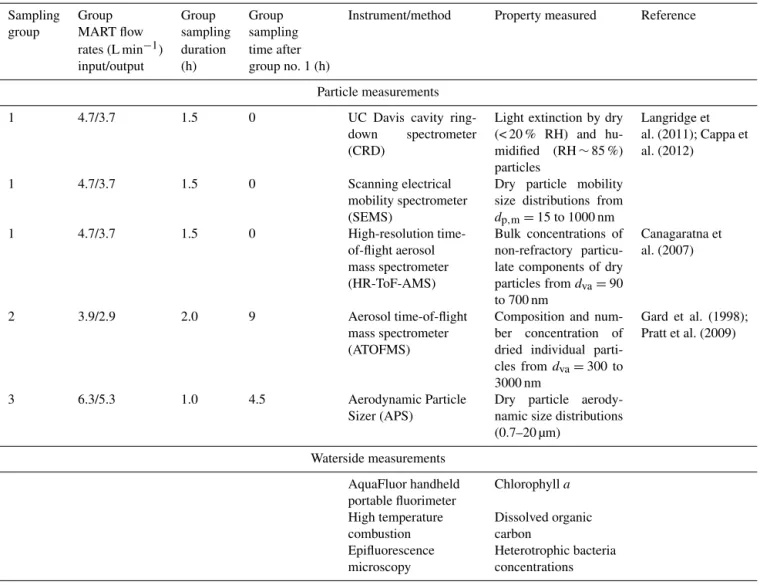
Table 1.Summary of all instrumentation used in this study.
Sampling Group Group Group Instrument/method Property measured Reference group MART flow sampling sampling
rates (L min−1) duration time after input/output (h) group no. 1 (h)
Particle measurements 1 4.7/3.7 1.5 0 UC Davis cavity
ring-down spectrometer (CRD)
Light extinction by dry (< 20 % RH) and hu-midified (RH∼85 %) particles
Langridge et al. (2011); Cappa et al. (2012)
1 4.7/3.7 1.5 0 Scanning electrical mobility spectrometer (SEMS)
Dry particle mobility size distributions from
dp,m=15 to 1000 nm
1 4.7/3.7 1.5 0 High-resolution time-of-flight aerosol mass spectrometer (HR-ToF-AMS)
Bulk concentrations of non-refractory particu-late components of dry particles fromdva=90
to 700 nm
Canagaratna et al. (2007)
2 3.9/2.9 2.0 9 Aerosol time-of-flight mass spectrometer (ATOFMS)
Composition and num-ber concentration of dried individual parti-cles fromdva=300 to 3000 nm
Gard et al. (1998); Pratt et al. (2009)
3 6.3/5.3 1.0 4.5 Aerodynamic Particle Sizer (APS)
Dry particle aerody-namic size distributions (0.7–20 µm)
Waterside measurements AquaFluor handheld portable fluorimeter
Chlorophylla
High temperature combustion
Dissolved organic carbon
Epifluorescence microscopy
Heterotrophic bacteria concentrations
which the instruments sampled. The flow rates to each in-strument (or group of inin-struments) from ports in the man-ifold differed (e.g., 1 L min−1 to the high-resolution time-of-flight aerosol mass spectrometer (HR-ToF-AMS, hence-forth AMS) vs. 3 L min−1to the cavity ring-down spectrom-eter (CRD)+scanning electrical mobility sizer (SEMS)). Al-though the airstreams were not split isokinetically, the aspi-ration efficiency was calculated to be near 100 % for the size range of particles sampled here (Kulkarni et al., 2011). Thus, the different instrument groups sampled similar particle pop-ulations from the manifold. Due to the limited headspace volume and flow restrictions, not all instruments in this study could sample simultaneously. During individual pling periods, only a subset of the full instrument suite sam-pled from the MARTs. The flow rate of zero air going into the MART and the flow being pulled from the MART by the instruments, as well as sampling times for each group of instruments, are provided in Table 1. The flow into the MART was always 1 L min−1greater than the combined
in-strument pull to ensure positive pressure in the headspace, which eliminated possibility of sampling of room air. The shape of the measured particle size distributions was rela-tively independent of flow rate for the range of flow rates considered while sampling from the MARTs, although the residence time of individual particles decreases as the flow rate increases (Stokes et al., 2013). The air pushed into the MART was produced by a zero-air generator (Sabio Instru-ments, Model 1001), with air flow controlled by a mass flow controller. The excess flow was released through a vent on the MART. The different flow rates through the MART and through the sample tubing for each sampling configuration led to some differences in the size distribution sampled by the downstream instrumentation.
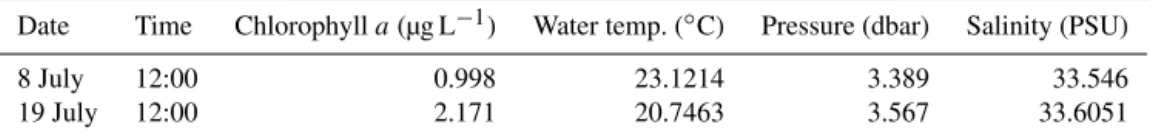
Table 2.Seawater conditions at the time of collection.
Date Time Chlorophylla(µg L−1) Water temp. (◦C) Pressure (dbar) Salinity (PSU) 8 July 12:00 0.998 23.1214 3.389 33.546 19 July 12:00 2.171 20.7463 3.567 33.6051
California, USA (32◦51′56.8′′N, 117◦15′38.48′′W). Debris and zooplankton were filtered out of the seawater with 50 µm mesh. Phytoplankton growth was induced by exposure to ar-tificial or natural light and the addition of growth media, which is described further in Lee et al. (2015). The two in-dependent MART experiments will be referred to, according to the MART location during the growth phase, as either “in-door” or “out“in-door”. The indoor MART was illuminated us-ing 5700 K full spectrum lights, while the outdoor MART was illuminated with sunlight. A key difference between these two experiments is the intensity of the photosynthet-ically active radiation (PAR) during growth. The PAR was much greater for the outdoor MART compared to the indoor MART (PAR∼1000–1500 µE m−2s−1(Bouvet et al., 2002) vs.∼70 µE m−2s−1), which likely resulted in a much larger peak Chla concentration for the outdoor MART, 51 µg L−1 (outdoor) vs. 10 µg L−1 (indoor). An additional difference between the two microcosms was that the seawater was col-lected on different days: 8 July for the indoor MART and 19 July for the outdoor MART. The conditions of the seawa-ter at time of collection are detailed in Table 2.
On 9 July, particles from the indoor MART were pled immediately following nutrient addition. Further sam-pling was delayed until chlorophylla(Chla) concentrations exceeded approximately 12 µg L−1, which occurred 7 days
after nutrient addition. (The same seawater as used in the in-door MART was added to a separate MART and sampled im-mediately after collection and before nutrient addition. How-ever, the resulting particle size distribution from this MART differed substantially from those measured from the indoor MART, with a much greater contribution of large particles. Thus, the measurements from this separate MART are not directly comparable to the measurements from the indoor MART and are not considered further.) The outdoor MART was only sampled after Chl a concentrations exceeded ap-proximately 12 µg L−1, which occurred 3 days after nutrient addition. This delay in sampling from when the water and nutrients were first added to the MARTs is necessary be-cause the plunging process can lead to lysis of the phyto-plankton cells during this vulnerable growth period, which will inhibit phytoplankton growth (Lee et al., 2015). Ulti-mately, SSA from the initially collected water from the in-door MART was sampled on 9 July, and subsequent sampling commenced periodically from 19 July through 31 July, i.e., beginning 11 days after the water was collected. Sampling from the outdoor MART did not commence until 22 July, continuing through 1 August. During the growth period and
the off-sampling periods, air was gently bubbled through the tank to provide aeration. Sampling from the MARTs was per-formed daily once the threshold Chla concentrations were reached.
2.2 Instrumentation
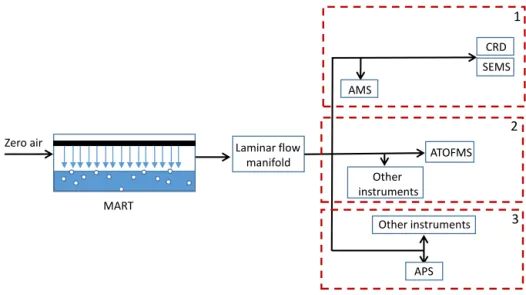
A variety of online and offline measurements were made to characterize water composition and particles generated within the MARTs. A general sampling schematic is shown in Fig. 1 and a list of the instrumentation used is given in Table 1. As only a limited number of instruments were able to sample concurrently from the MART due to flow limita-tions, the individual sampling configurations (i.e., groupings of instruments sampling at the same time) are indicated; three specific instrument groupings are considered. The sampling times of each group relative to Group 1 are listed in Table 1 and a more detailed schematic of Group 1 optical and siz-ing measurements is provided in Fig. S1 in the Supplement. (The specific timing was dictated by the broader goals of IM-PACTS.) A general description of the key instrumentation used as part of this study is provided below. Group 1 sampled for 1.5 h, Group 2 sampled for 2 h, and Group 3 sampled for 1 h each day that sampling was conducted.
2.2.1 Online particle measurements
Size distributions for dried particles (relative humidity (RH) < 20 %) were measured with an SEMS (BMI, model 2002), and an aerodynamic particle sizer (APS; TSI Inc., model 3321). The SEMS combines a differential mobility analyzer (DMA) and a mixing condensation particle counter to characterize particles according to their mobility diame-ter (dp,m). The APS characterizes particles according to their
aerodynamic diameter (dp,a). The SEMS characterized
parti-cles over the range 10 nm <dp,m< 1900 nm and the APS over
the range 0.7 µm <dp,a< 20 µm. The SEMS size distributions
distribu-Laminar flow manifold Zero air
MART
AMS
CRD
SEMS
1
Other instruments
APS
3
ATOFMS
Other
instruments
2
Figure 1.Experimental schematic for MART sampling during the IMPACTS 2014 study, with boxes labeled 1, 2, and 3 corresponding to
different sampling configurations.
tion at larger diameters. The APSdp,avalues were converted
to mobility equivalent values assuming a particle density of 1.8 g cm−3.
The hygroscopicity of the SSA particles was characterized through simultaneous measurement of light extinction coeffi-cients (bext)for particles that were either dried to RH < 20 %
(“dry”) or humidified to RH ∼85 % (“wet”) using the UC Davis CRD (Langridge et al., 2011; Cappa et al., 2012). Light absorption by the SSA particles was negligible, and thus extinction is equal to scattering, i.e., bext=bsca. The
dry particle measurements were made at wavelengths of 532 and 405 nm, while the wet particle measurements were made only at 532 nm. It should be noted that the humidified particle stream was generated without first drying the particles, and thus it is unlikely that the sampled particles had effloresced. Humidification was achieved by passing the particles through a Nafion humidifier (Perma Pure, MD-110-12) while drying was achieved by passing the particles through a diffusion de-nuder filled with Drierite. Both the humidifier and drier were oriented vertically to prevent differential losses due to sedi-mentation, which could bias the measurements. The funda-mental performance of the CRD method for wet particles is the same for dry particles, but variations and uncertainty in the RH contribute to the uncertainty in the measuredbext. The
RH for the humidified channel varied between 80 and 87 % due to challenges in maintaining a constant temperature in the open-air Scripps Hydraulics Lab; these variations are ac-counted for in the analysis as described below. The RH of the air was measured directly in the CRD cells using RH probes (Vaisala, HMP50) that were calibrated against saturated salt solutions. The wet (high RH) and dry (low RH) particle mea-surements are combined to provide a characterization of the extent of water uptake at a given RH, which causes particles
to grow through the parameterf(RH), where
f (RH)=bext RHhigh
bext(RHlow)
=bsca RHhigh
bsca(RHlow)
. (1)
The parameterf(RH) is RH specific and is most appropri-ate when RHlowis sufficiently low that there is little, if any,
particle-phase water. The accuracy of the f(RH) measure-ments, as well as the conversion to equivalent growth factors (GFs, Sect. 2.2.3), was tested through measurements made using sodium chloride and ammonium sulfate particles that were generated using an atomizer.
The CRD (and SEMS) alternated between sampling be-hind a PM2.5cyclone and with no explicit size cut (referred
to as PMall)every 10 min to try and determinef(RH) and
GF values separately for smaller and larger particles. Note that particles were sampled through the PM2.5cyclone prior
to being dried (RH∼70 %) and thus the effective size cut for the subsequently dried particles is somewhat less than 2.5 µm, depending on the exact water content of the particles at 70 % RH. Since the measured size distributions indicate minimal contributions from particles withdp,a> 2.5 µm, the
PM2.5and PMallmeasurements will generally be considered
together.
An aerosol time-of-flight mass spectrometer (ATOFMS) (Gard et al., 1998; Pratt et al., 2009) was used to characterize the composition of individual dried SSA particles with vac-uum aerodynamic diameters (dva)from∼300 nm to 3 µm,
with the highest transmission and sampling of particles with
dva∼1–2 µm (Wang et al., 2015). The ATOFMS single
carbon (OC), containing a large iron peak (Fe), and contain-ing a large magnesium peak (Mg) (Lee et al., 2015; Sultana et al., 2016; Wang et al., 2015). A campaign-average spectrum for each category is shown in Fig. S2. The combination of the aerodynamic lens transmission and the input particle size distribution determines the particular weighting of the aver-age fractions of the ATOFMS particle types (see Fig. S3); in this study, the results are for the sampling-weighted average, which corresponds approximately to a sampling-weighted averagedva=1.5 µm.
An Aerodyne AMS quantified mass concentrations of non-refractory (NR) components of dried SSA particles, in particular NR organic matter (NR-OM) but also other non-refractory (NR-PM) components (Canagaratna et al., 2007). NR-PM species are defined as those that volatilize at∼600◦C on a timescale of a few seconds under vacuum (10−4torr) conditions. No cyclone was used in front of the
AMS, and thus the size range of sampled SSA particles was determined by the size-dependent transmission of the aero-dynamic lens, which nominally allowed for quantitative sam-pling of particles with dva between 90 and 700 nm (50 %
cut points at∼40 nm and∼1 micron), although some frac-tion of even larger particles were characterized (Wang et al., 2015). The AMS data were analyzed using the SQUIRREL toolkit. The high-resolution mass spectra were analyzed us-ing the PIKA toolkit to determineO/Catomic ratios for the NR-OM components. The NR-OM fraction of total sampled PM was estimated by normalizing the NR-OM mass con-centrations by PM1concentrations determined from
integra-tion of the SEMS particle size distribuintegra-tions using an assumed density of 1.8 g cm−3. Since ad
va of 1 µm corresponds
ap-proximately to a dp,m=560 nm, the use of the SEMS size
distribution is appropriate and the derived NR-OM fractions can be considered reflective of the submicron SSA compo-sition. It is important to note that while the temporal trends of the AMS NR-OM/PM1 fractions are likely reflective of
the general behavior, the absolute values are more difficult to quantify because NR-OM associated with particles contain-ing high sea salt fractions may not be vaporized efficiently by the AMS due to the refractory nature of sea salt (Frossard et al., 2014) and to the susceptibility of SSA particles to par-ticle “bounce” in the AMS. Consequently, the SSA parpar-ticles, including the NR-OM component, are detected with a collec-tion efficiency (CE) lower than unity (Frossard et al., 2014). One previous study (Ovadnevaite et al., 2012) determined the CE value for organic-free sea salt sampled when RH < 70 % is approximately 0.25. However, they also note that the CE is potentially instrument dependent and, furthermore, may not be applicable to the organic fraction in sea spray particles due to differences in ionization efficiency (which is a com-ponent of the overall CE) (Ovadnevaite et al., 2012). It is also possible that the CE differs between particles that have differing relative amounts of OM and sea salt. Despite such uncertainties in quantification of NR-OM by the AMS for sea spray particles, the NR-OM mass concentrations for the
sam-pled SSA particles were determined in this study assuming CE=0.25. The measured NR-OM mass concentrations were used to calculate NR-OM volume concentrations, assuming a density (ρ)of 1.0 g cm−3. A value of 1.0 g cm−3forρOMis
consistent with that of fatty acids (ρ< 1 g cm−3), which are a significant fraction of marine-derived OM (Cochran et al., 2016; Mochida et al., 2002). However, this value serves as a lower bound forρOM because OM with higher densities,
such as sugars (ρ∼1.7 g cm−3), has also been observed in SSA (Quinn et al., 2015). The NR-OM volume fractions of SSA (εorg)were calculated as the ratio between the observed
NR-OM volume concentrations and the integrated total par-ticle volume concentrations from the size distribution mea-surements. Given the use of a lower-limit value forρOMthe εorgare likely upper limits (not accounting for uncertainty in
the assumed CE).
2.2.2 Optical closure methods
Thef(RH) values measured using the CRD instrument have been used to determine optically weighted physical GFs. For particles of a given size, the GF is defined as
GF(RH)=dp RHhigh
dp(RHlow)
, (2)
wheredpis the geometric particle diameter, which is
equiv-alent todp,mfor spherical particles. For clarity, in this work
the optically weighted GF will be indicated simply as GF, while size-specific GF values will be indicated as GFx. SSA
particle composition can vary with size (e.g., O’Dowd et al., 2004), and thus GFx values may vary with size. The
opti-cally weighted GF averages across size-dependent variations in composition and GFx to focus on the chemical changes
that most influence water uptake by the particles that most contribute to light scattering. Unlikef(RH), GFxvalues are
independent of the dry particle size (above about 100 nm di-ameter) for particles of a given composition. Thus, variations in the optically weighted GF values are driven only by vari-ations in particle composition, specifically varivari-ations in the average composition of particles in the size range over which the optical measurements are most sensitive. For the mea-surements here, the sensitive size range is between about 400 and 800 nm, with particles below 200 nm contributing almost 0 to the observed scattering (see Sect. 3.1 below).
The observedf(RH) values are converted to GF(RH) val-ues via optical closure. The optical closure technique uses spherical particle Mie theory calculations and the measured size distributions and f(RH) values to derive equivalent GF(RH) values. This methodology is described in detail in Zhang et al. (2014). In brief, the dry scattering is first calcu-lated from the measured dry particle size distribution assum-ing a refractive index of 1.55 (the refractive index for NaCl), as
bsca= Z
σsca dp,m
· dN
dlogdp,m
whereσscais the size-dependent scattering cross section and dN/dlogdp,mis the number-weighted size distribution. Then,
each diameter for the dry distribution is multiplied by a trial value for GF(RH), the refractive index of the particles is ad-justed to account for the resulting volume fraction of water, and the scattering by the resulting “wet” distribution is cal-culated, from which a theoreticalf(RH) value is determined. The calculatedf(RH) is compared to the observedf(RH), and if the two do not agree to within 0.01 the trial GF(RH) is increased until closure is obtained. It is assumed that the growth factors are size independent, namely that GFx=GF
for alldp. Thus, this method retrieves an effective, optically
weighted GF value that explains the observed influence of water uptake on light scattering for the sampled size distri-bution. An alternative approach was considered in which the GFxwere assumed to vary with size, specifically as GFx=
2.1−b (log(1.8 µm)−log(dp,m)), and where the value of b was allowed to vary during the optical closure, with the condition that GFx≥0. (This expression assumes that
parti-cles withdp,m=1.8 have GFx=2.1, i.e., that of NaCl. The
GFx decrease as size decreases.) The derived b values
ex-hibit a similar temporal dependence as the derived optically weighted GF values. The general conclusions reached in this study are therefore independent of the assumptions made re-garding the size-dependent behavior of GFx. Thus, rather
than introducing an uncertain functional form, the simpler assumption (namely, size-independent GFx) is used here.
As the RH of the humidified channel was not per-fectly constant during measurements, the derived individual GF(RH) values have been adjusted to 85 % by using Eq. (4):
RH exp
A dd·GF(RH)
=
GF(RH)3−1
GF(RH)3−(1−κ), (4)
whereAis a constant, RH is relative humidity,ddis the dry
particle diameter, and κ is the effective hygroscopicity pa-rameter, which is assumed to be RH independent (Petters and Kreidenweis, 2007). Here, theddvalues used are the
op-tically weighted median diameters, which are calculated by integrating the concentration-weighted size-dependent cross sections (σsca(dp)). GF(85 %) values were determined by
first calculatingκ based on the measured GF(RH) and then recalculating the GF at 85 % RH.
The accuracy of this optical closure method, as well as of the initial f(RH) measurements, was assessed by com-paring the GF(85 %) values determined for polydisperse dis-tributions of NaCl and (NH4)2SO4test particles, for which
GF(85 %) values are known. The measured GF(85 %) for NaCl was 2.09±0.03 and for (NH4)2SO4was 1.59±0.05,
which compare very well with literature values of∼2.1 for NaCl (Cruz and Pandis, 2000; Laskina et al., 2015; Hansson et al., 1998) for particle sizes ranging from 100 to 300 nm and
∼1.55 for ammonium sulfate (Laskina et al., 2015; Wise et al., 2003) for 100 nm particles. (The reported experimental
uncertainties are 1σ standard deviation over each measure-ment period.)
GF calculations for PMall utilized a combined size
distri-bution from the SEMS and the APS, with the merge point at
dp,m=1000 nm. The APS sampled at a separate time from
the CRD (see Table 1). The CRD setup also required dilu-tion due to the 3 L min−1required for the cyclone and a total pull of∼6.3 L min−1. Therefore, a dilution correction was applied to the APS distributions to account for the different sampling scheme. Although this adjustment adds some un-certainty to the PMallsize distributions, the concentrations at
larger sizes were very small and thus had minimal influence on the derived GFs. For the PM2.5 sampling periods, only
SEMS distributions were used.
3 Results
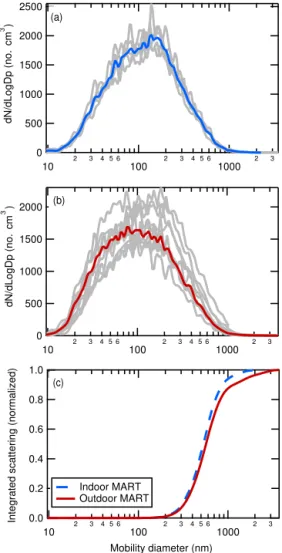
3.1 Size distributions and dry particle optical closure The daily and study average merged size distributions for each MART are shown in Fig. 2a (indoor MART) and b (outdoor MART). The day-to-day variations in the size distributions were generally small. The average SSA particle number-weighted size distributions from both MARTs peaked around dp,m=100 nm and were relatively
broad. The observed concentration of supermicron particles (dp,m> 1000 nm) was somewhat lower than that previously
reported from a MART (Stokes et al., 2013) and likely re-flects greater gravitational losses of supermicron particles in the long sampling line used here (Fig. S4). Since the hy-groscopicity measurements discussed in this study are based on measurements made using polydisperse distributions, it is useful to determine the effective scattering-weighted parti-cle diameters that characterize the MART size distributions. The study-average integrated scattering for each MART was calculated from Mie theory using the observed dry parti-cle size distributions (Fig. 2c). The dp,m at which 50 %
of the total scattering occurs were 570 nm for the outdoor MART and 530 nm for the indoor MART and particles with
dp,m> 1000 nm contributed < 10 % of the total scattering in
both MARTs, indicating that the derived GF(85 %) values for these two experiments are most sensitive to submicron particles withdp,mvalues between about 400 and 800 nm.
The extent of agreement between the observed bsca for
dry particles and the values calculated from Mie theory us-ing measured size distributions (Eq. 3) has been assessed (Fig. S5). The calculatedbscaare∼15 % lower than the
ob-servedbsca for both PMall and PM2.5, which is outside the
2500
2000
1500
1000
500
0
dN/dLogDp
(no. cm )
3
10 2 3 4 5 6 100 2 3 4 5 6 1000 2 3
Mobility Diameter (nm)
2000
1500
1000
500
0
dN/dLogDp
(no. cm
)
3
10 2 3 4 5 6 100 2 3 4 5 6 1000 2 3
Mobility Diameter (nm) (a)
(b)
1.0
0.8
0.6
0.4
0.2
0.0
Integrated scattering (normalized)
10
2 3 4 5 6
100
2 3 4 5 6
1000
2 3
Mobility diameter (nm) Indoor MART
Outdoor MART (c)
Figure 2.Single (gray) and average (red or blue) number-weighted
merged size distributions for the (a)“indoor” and(b) “outdoor” MARTs averaged over the MART sampling period (1.5 h) and
(c)normalized integrated scattering as a function of dry mobility diameter for the merged size distribution. The optically weighted median diameters are 530 nm for the indoor MART and 570 nm for the outdoor MART.
There is greater scatter in the PMall light scattering
compar-ison than there is from the PM2.5comparison, which likely
results both from the APS measurements being made at a different time than the CRD and SEMS measurements and the need for dilution correction. Some of the difference be-tween the observed and calculatedbscamay be attributable to
the assumption of spherical particles in the calculations, al-though similar closure was obtained (within 16 %) between observed and calculatedbscafor atomized NaCl, suggesting
that this is unlikely to explain the difference. It is possible that the diameters measured by the SEMS may have been too small. Wiedensohler et al. (2012) reported that sizing er-rors between instruments can be up to 10 %. If the measured diameters are increased by 8 %, then a 1:1 agreement be-tween the measured and calculated extinction values is
ob-tained. However, tests conducted during the study in which a second DMA was used to size-select monodisperse particles in the range 100–300 nm indicated agreement between the instruments to within 1 %. Additional tests after the study us-ing 220 nm monodisperse polystyrene latex spheres demon-strated the SEMS sizing was good to better than 1 %, sug-gesting that sizing inaccuracies cannot explain the difference absent some fundamental problem with the data inversion procedure for size distributions (Lopez-Yglesias et al., 2014), which seems unlikely. Uncertainty in the assumed refractive index value for the dry particles may explain a small fraction (< 5 %) of the difference. Additionally, if the dry particles had retained some water in the CRD but not the SEMS, then the observedbscawould be larger than the calculated value.
However, the RH in the CRD dry channel is much lower than the efflorescence RH for NaCl (∼45 %, Biskos et al., 2006), and thus it seems unlikely that residual water would have contributed substantially to the difference. Regardless of the explicit reason for the difference in calculated and observed absolute values ofbsca, since the calculation off(RH)
de-pends on the ratio between thebscafor wet and dry particles,
such absolute differences do not strongly affect the retrieval of GF(85 %) values. We have tested the sensitivity of the re-trieval method to an 8 % increase in the particle diameters. The retrieved GF values are increased by a marginal amount (0.015–0.03) when the diameters are increased, and thus such potential sizing uncertainty does not affect the main conclu-sions presented here.
3.2 Indoor MART
The temporal variation in Chl a concentrations, the de-rived GF(85 %), and various particle composition metrics are shown in Fig. 3 for the indoor MART. As has been previously observed in microcosm experiments, the measured Chl a
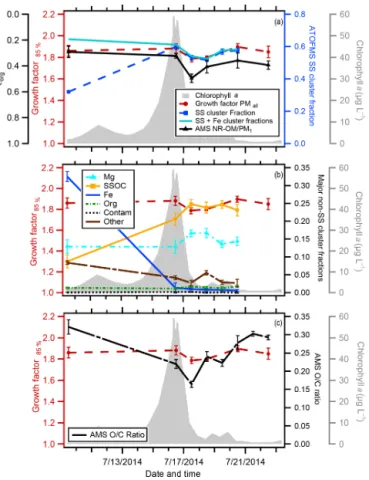
Figure 3.Time series for the indoor MART chlorophylla(gray), PMall GF(85 %) (red circles), and (a) organic volume fraction
(εorg) estimated from AMS non-refractory organic matter (NR-POM)/PM1mass (solid black line), ATOFMS sea salt (SS)
parti-cle type fractions (blue dashed line), and ATOFMS SS+iron-type (Fe) particle type fractions;(b)dominant non-sea salt particle type fractions magnesium (Mg) type (dashed turquoise line), Fe, “other” type, and contamination (black line) and sea salt with organic car-bon (SSOC) (orange line) particle type fractions; and(c)the AMS O/C ratio (dashed black line). Note that the axis forεiis reversed
to facilitate comparison to GF(85 %) values. The reported standard deviation for all properties is 1σ of the individual measurements over each sampling period.
The GF(85 %) values determined for the indoor MART ranged from 1.79 to 1.9 and exhibited distinct temporal variations, decreasing from 1.88±0.04 on 16 July, just as the Chl a peaked, to a minimum range of 1.79±0.03 to 1.80±0.01 from 17 July to 18 July when the Chl a con-centration dropped to 3.41±1.89 µg L−1 and then
recover-ing back to 1.90±0.03 on 7/20 (Fig. 3a). The range of these values is 10–15 % lower than the value of∼2.1 for pure (in-organic) sea salt (Ming and Russell, 2001). There is a 1-day lag between the peak in Chlaand the (temporary) depression in GF(85 %).
The NR-OM volume fractions of SSA varied from 0.29 to 0.50 throughout the course of the indoor MART micro-cosm experiment (Fig. 3). The observation of such largeεorg
values is consistent with the substantial depressions in the GF(85 %) values relative to pure inorganic sea salt (2.1). The temporal variation in theεorg was generally similar to that
of the GF(85 %) values, with smaller GF(85 %) values cor-responding to largerεorgvalues, although the peak inεorgis
somewhat sharper than the dip in the GF(85 %). The inverse relationship between the GF(85 %) andεorgis consistent with
organic compounds being less hygroscopic than sea salt. The O : C ratio of the NR-OM had an average value of 0.25±0.05 (1σ ), which is similar to the value of 0.20±0.08 reported by Frossard et al. (2014) for primary NR-OM that was gener-ated from the open ocean using the “sea sweep” (Bates et al., 2012). The O : C ratio of NR-OM in the indoor MART gener-ally increased with time, from 0.17 to 0.30, but also exhibited a temporary decrease on 17 July, the day when the GF(85 %) andεorgboth first dropped. Since O : C often correlates with
hygroscopicity for organics (at least for multi-component mixtures), this behavior may indicate a general increase in the hygroscopicity of the NR-OM with time (Cappa et al., 2011; Massoli et al., 2010). However, since the hygroscop-icity of organic aerosol with O : C values in this range has generally been found to be small, the observed variations in O : C may not have a noticeable impact on the overall behav-ior of the GF(85 %) values.
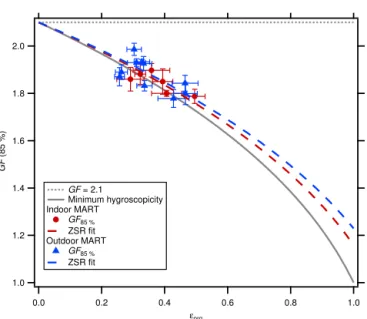
The explicit co-variation ofεorgand the GF(85 %) values
is shown in Fig. 4. Assuming that volume mixing rules apply (i.e., the Zdanovskii–Stokes–Robinson (ZSR) mixing rules; Stokes and Robinson, 1966), the overall effective GF (GFobs)
can be estimated as GFobs=
(1−εorg)·GFsea salt3+εorg·GForg3 1/3
, (5)
where GForgis the GF value for pure OM and GFsea saltis the
GF value expected for pure sea salt. The ZSR line connect-ing GFsea salt(85 %)=2.1 and GForg(85 %)=1.0 provides
the minimum value expected for any fraction of OM relative to sea salt. Low GForg(85 %) values (∼1.0) have been
ob-served for fatty acids (Vesna et al., 2008), which have been found in SSA particles in the atmosphere (Mochida et al., 2002) and were observed in SSA produced in a related meso-cosm experiment (Wang et al., 2015; Cochran et al., 2016). Values above this line indicate that the GF of the OM in the sampled SSA particles is, on average, greater than 1. Equa-tion (5) was fit to the data shown in Fig. 4 to determine an average value for GForg(85 %) for the indoor MART. The
best-fit GForg(85 %) was 1.16±0.09, which falls between
GForg=1.0 expected for non-hygroscopic OM, such as fatty
acids, and GForgexpected for more soluble OM, such as
sug-ars (e.g., GForg(85 %)=1.24±0.04 has been observed for
glucose; Mochida and Kawamura, 2004). (The uncertainty on GForg(85 %) is the fit uncertainty and does not account for
uncertainties in either the CE for SSA particles orρOM.) This
value for GForg can be interpreted as an optically weighted
2.0
1.8
1.6
1.4
1.2
1.0
GF
(85 %)
1.0 0.8
0.6 0.4
0.2 0.0
εorg
GF = 2.1
Minimum hygroscopicity Indoor MART
GF85 %
ZSR fit Outdoor MART
GF85 %
ZSR fit
Figure 4. PMall GF(85 %) as a function of the organic volume
fraction estimated from AMS non-refractory organic matter (NR-POM)/PM1mass for the indoor (red circles) and the outdoor (blue triangles) MARTs. ZSR fits to the data using Eq. (5) are shown for the indoor (dashed red line) and outdoor (dashed blue line) MARTs, assuming GFsea salt(85 %)=2.1 (dotted gray line). The overall
re-trieved GForg(85 %) values were 1.16±0.09 and 1.23±0.10 for
the indoor and outdoor MARTs, respectively. The gray solid line connecting GF(85 %)=2.1 and GForg(85 %)=1.0 provides the
minimum value expected for any combination of GF(85 %).
the CE is relatively uncertain for sea spray particles (Ovad-nevaite et al., 2012; Frossard et al., 2014) and theρOMis also
uncertain, the derived value for GForg should be viewed as
suggestive only.
One important issue to consider in assessing the quanti-tative nature of the derived GForg(85 %) value is that the
mass-weighted organic fractions used to determine εorg do
not necessarily have the same weighting with respect to par-ticle size as the GF(85 %) values do. The scattering-weighted median diameter, relevant to the GF(85 %) measurements, wasdp,m=530 nm. The mass-weighted size distribution of
OM can be estimated from the size distribution of a particular tracer ion in the AMS mass spectrum, specifically the ion at
m/z=43, which is indicative of total organic mass (Fig. S7). (Interference from the large signal contribution from inor-ganic ions prohibited explicit determination of the total NR-OM size distribution, and thus only the m/z =43 ion is used.) The peak in the NR-OM mode occurs atdva∼1 µm,
which corresponds todp,m=560 nm. This is comparable to
the scattering-weighted median diameter, suggesting that the temporal variations in the GF(85 %) and εorg can be
com-pared. However, the AMS aerodynamic lens imposes a 50 % cut diameter of ∼1 µm (Canagaratna et al., 2007) and thus the observed peak inm/z43 likely occurs at a diameter that is somewhat too small compared to the actual distribution.
There was also a strong temporal correlation observed between the GF(85 %) values and the number fractions of ATOFMS mass spectra categories. Specifically, the decrease in GF(85 %) values after the bloom peak corresponded to a shift from particles that generated mass spectra dominated by sea salt ion markers (SS type) to particles with strong spec-tral signatures indicative of organic or biological influence (SSOC and Mg type). (The measurements made just after nutrient addition on 9 July are a notable exception, discussed below.) The inverse relationship between the GF(85 %) and the SS-type particle spectra is consistent with the inverse re-lationship between the GF(85 %) andεorg, providing
addi-tional confidence that the temporal variations in GF(85 %) are driven by variations in particle composition. The SSOC mass spectral type is identified in large part by the pres-ence of carbon-containing peaks (CN−and CNO−)and K+ and Ca+ in the mass spectrum (see Fig. S2). The Mg-type spectra are characterized by their large Mg+ peak, which has been previously attributed to the presence of biological material (e.g., bacteria) (Guasco et al., 2013; Prather et al., 2013), as well as by smaller Ca+ and K+peaks (Fig. S2). Both the SSOC and Mg spectral types are depleted in peaks corresponding to Na or NaCl. It is important to note, how-ever, that dried SSA particles sampled by the ATOFMS can be spatially chemically heterogeneous, with shells depleted in Na and rich in Mg, K, and Ca (Ault et al., 2013). Thus, some fraction of the particles identified as having Mg- or SSOC-type spectra may be partially explained by the incom-plete ionization of sea salt particles (Sultana et al., 2016). However, variations in the thickness of this Na-depleted shell likely reflect variations in the total particle organic content. Therefore, increases in the fraction of SSOC- or Mg-type mass spectra generated suggest a net increase in SSA par-ticle organic content. On 9 July a substantial fraction of particles containing large Fe+ peaks were observed; on all other days the Fe spectral-type particle fraction was negligi-ble. The Fe spectral-type particles may have had an influence on the observed GF(85 %) values when present with high rel-ative abundance. However, their large fraction on 9 July is a result of nutrient addition and not biological changes in the seawater.
3.3 Outdoor MART
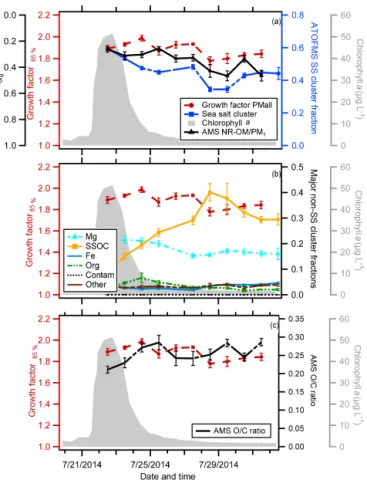
Figure 5.Same as Fig. 3 above but for the outdoor MART.
next week to < 1.5 µg L−1. Both DOC and heterotrophic
bac-teria concentrations increased as the bloom progressed until they stabilized around the point when Chl a concentrations had returned approximately to their pre-bloom levels, with DOC concentrations ranging from 200 to 300 µM C and het-erotrophic bacteria concentrations from 1×10⁶to a peak of 1.7×10⁷mL−1(Fig. S6B).
The GF(85 %) values ranged from a maximum of 1.99±0.03 to a minimum of 1.78±0.04, again lower than what would be expected for pure sea salt (by 5–15 %). Unfor-tunately, no pre-bloom measurements were possible for this experiment, with the first particle measurements made for all instruments when the Chlaconcentration was peaking. The smallest GF(85 %) values were observed towards the end of the microcosm, when the Chla concentrations were at their lowest point (< 1.5 µg L−1). The GF(85 %) values exhibited
two sequential decreases after the Chla peak, the first after 3 days and the second after 6 days. The range of GF(85 %) values for the SSA particles from the outdoor MART was similar to that for the indoor MART.
The observedεorgvalues for the SSA particles were
simi-larly comparable to the indoor MART (0.26 to 0.46). In gen-eral, decreases in GF(85 %) values corresponded to increases in εorg values, with the exception of the measurements on
7/30 (Fig. 5c). Following the peak in Chla, theεorgvalues
increase gradually over a few days, then stabilize, and finally exhibit an additional increase 6 days after the bloom peak (Fig. 5a). The temporal variations inεorg tracks neither the
Chlanor DOC concentrations. This suggests that, perhaps, biological processing and its impact on the composition of organics in the sea water, more so than absolute organic con-centrations, is important for determining the abundance of organic matter transferred into SSA particles (Rinaldi et al., 2013; Lee et al., 2015; Quinn et al., 2014). However, further experiments will be needed to confirm this hypothesis.
Values of GForg(85 %) have again been estimated using
the ZSR relationship (Eq. 5) and the observed GF(85 %) and εorg. Assuming GFsea salt (85 %)=2.1, the derived
GForg(85 %)=1.23±0.10 (Fig. 4). This GForg(85 %) for the
outdoor MART is comparable to that obtained from the in-door MART, suggesting that the OM generated from the out-door MART has similar hygroscopicity as the OM sampled from the indoor MART.
As with the indoor MART, there was a reasonable tempo-ral correlation between the GF(85 %) values and the num-ber concentration of SS spectral-type particles from the ATOFMS. The two most abundant non-SS particle mass spectra types were SSOC type and Mg type, with all other types contributing negligibly. This is again an indication that the temporal variation in the GF(85 %) values corresponds to an evolution of the composition of the SSA particle popula-tion and is consistent with the variapopula-tion inεorg.
4 Implications and conclusions
The two MART microcosm studies provide two case studies relating variations in the optically weighted GF(85 %) values and SSA particle composition for predominately submicrom-eter SSA particles. For both microcosms, clear depression of the GF(85 %) values, relative to that for pure sea salt, oc-curred following the peak in Chla concentrations and upon the death of both phytoplankton blooms, but with differing time lags between peak Chla and the minimum GF(85 %) between the experiments. This depression in GF(85 %) val-ues is consistent with largeεorg(0.25–0.50) values estimated
using the NR-OM/PM1. The similar temporal variations in
GF(85 %) and εorg, as well as with the ATOFMS particle
mass spectra types, demonstrate a clear link between SSA hygroscopicity and composition. For a given microcosm ex-periment, the estimated hygroscopicity of OM components is similar, with GF(85 %)=1.16 for the indoor MART and 1.23 for the outdoor MART.
ob-served substantial differences in GF(90 %) and f(RH) val-ues for submicron particles with very different εorg
frac-tions in what were identified as clean marine air masses. (Their GF(90 %) values were measured using a hygro-scopic tandem DMA for size-selected particles with 35 nm
≤dp,m≤165 nm. Their f(RH) values were measured for
PM1.) They observed that increases inεorg had no effect on
the GF(90 %) until a thresholdεorgwas reached, specifically εorg>∼55 %. Below this value, they measured GF(90 %)
value of ∼2.3, which is the expected value for pure sea salt at RH=90 %. Above this value, the observed a rapid fall off in GF(90 %) to a plateau at 1.22. This reported be-havior differs from that observed for nascent SSA particles sampled in the current study. Here, substantial depressions in GF(85 %) (andf(RH)) relative to inorganic sea salt were observed when theεorgwas only∼25 %, and a co-variation
between GF(85 %) andεorg (and the ATOFMS SS
spectral-type fraction) was observed. One plausible reason for this difference is that nascent (freshly emitted) SSA particles are measured here whereas Vaishya et al. (2013) measured ambi-ent particles that could be subject to photochemical process-ing. Secondary organic aerosol formed from gases, such as monoterpenes and isoprene, emitted from the ocean (Shaw et al., 2010) could have contributed to the NR-OM, although Vaishya et al. (2013) argue that this influence was negligi-ble based on the literature. Emission rates of such species from the ocean and their relationship with oceanic processes are not well established. Although Vaishya et al. (2013) at-tempted to remove the influence of secondary organics in their analysis (as well as the influence of non-sea salt sul-fate), it is possible that their analysis was complicated by the impacts of atmospheric processing. Another key difference is that relationship between the GF(85 %) values andεorg
ob-served in the current study is consistent with ZSR behavior, while Vaishya et al. (2013) reported “bistable” behavior of the GF(90 %) values as a functionεorg(i.e., the flat behavior
atεorg< 55 % and the steep fall off above). The physical
ba-sis of this bistable behavior, and the functional form implied by their measurements, is not easily explained. Finally, the GF(90 %) measurements by Vaishya et al. were made for par-ticles withdp,m< 165 nm, while the composition was
charac-terized with an HR-AMS. It is possible that size mismatch between these measurements influenced their analysis. Mass-weighted size distributions were not shown by Vaishya et al. (2013), but Frossard et al. showed mass-weighted size dis-tributions for ambient particles sampled in the remote marine boundary layer that suggest that much of the organic mass is contained in particles > 165 nm. Our results clearly indicate that compositional changes to nascent SSA particles, driven by variation in physical and biochemical processes in seawa-ter, can impact the influence of water uptake on scattering by submicron SSA even whenεorg< 55 %. The comparison
with the Vaishya et al. (2013) measurements suggests that this initial state can be further modified through atmospheric processing.
1.0
0.8
0.6
0.4
0.2
Fraction of scattering at RH = 85 %
relative to pure sea salt
1.0 0.8
0.6 0.4
0.2 0.0
εorg
Increasing GF(85 %)
2.0 1.8 1.6 1.4 1.2 1.0
GForg(85 %)
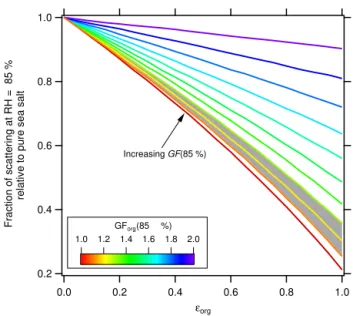
Figure 6.Calculated fraction of scattering relative to pure sea salt
particles at 85 % RH as a function ofεorg, assuming the OM
com-ponent of the SSA particles have the same constant hygroscopic-ity and a refractive index of 1.55 and the SSA particles follow the ZSR mixing rules. The different curves are colored according to the assumed GForg(85 %) value, ranging from 1.0 to 2.0, given
GFsea salt(85 %)=2.1. The gray band shows the range of GForg
val-ues indicated by the current measurements.
The implications of these results are explored here through calculations of the net decrease (relative to pure sea salt) in the average per particle scattering that would theoreti-cally result from increasing amounts of OM in SSA parti-cles, assuming that the SSA particles follow the ZSR mix-ing rules (see Fig. 6). This has been done for different as-sumed GF(85 %)org values as a function of εorg using the
average size distribution for the outdoor MART shown in Fig. 2b. Given the particle size distributions measured here, this assessment pertains to submicron SSA, not the entire SSA particle size distribution observed over the ocean (which includes contributions from supermicron particles; Kleefeld et al., 2002). The range ofεorgand GForg(85 %) values
de-termined here (about 0.25–0.50 and 1.16–1.23, respectively) correspond to decreases in scattering of about 15 to 30 %. Thus, climate models that assume SSA particles behave like pure sea salt or NaCl (Stier et al., 2005; Schmidt et al., 2006) may over-predict SSA particle scattering, depending upon the exact RH fields in the model. However, the range ofεorg
have a non-negligible, yet variable, impact on the light scat-tering by SSA particles in the ambient atmosphere (Fig. S8). Most likely, the simulated cooling effect of SSA particles due to aerosol–radiation interactions (i.e., the “direct effect”) would be decreased relative to the assumption that all SSA behaves as sea salt. Recent climate modeling studies (Par-tanen et al., 2014; O’Dowd et al., 2008) have attempted to account for variability in OM fractions of SSA particles by parameterizing OM fraction as a function of Chl a. How-ever, relating the OM fraction of SSA particles to simple ocean biological metrics like Chl a still remains challeng-ing, as these metrics are often insufficient predictors for SSA particle composition (Quinn et al., 2014; Wang et al., 2015), and the measurements reported here indicate a clear lag be-tween the peak in Chla and the minimum in the GF(85 %) values. Quantitative understanding of the climate impacts of SSA particles will require further understanding of the timing and relationships between ocean biogeochemistry and SSA properties.
Information about the Supplement
The Supplement consists of six figures that provide addi-tional support of the conclusions presented in the paper.
The Supplement related to this article is available online at doi:10.5194/acp-16-9003-2016-supplement.
Acknowledgements. This study was funded by the Center for Aerosol Impacts on Climate and Environment (CAICE), an NSF Center for Chemical Innovation (CHE-1305427). The authors thank all IMPACTS participants and the SIO hydraulics facility staff. SDF and CDC additionally thank the students in ECI 247L during spring quarter 2015 at UC Davis, who validated the SEMS sizing.
Edited by: D. Knopf
Reviewed by: two anonymous referees
References
Ault, A. P., Guasco, T. L., Ryder, O. S., Baltrusaitis, J., Cuadra-Rodriguez, L. A., Collins, D. B., Ruppel, M. J., Bertram, T. H., Prather, K. A., and Grassian, V. H.: Inside versus outside: Ion redistribution in nitric acid reacted sea spray aerosol particles as determined by single particle analysis, J. Am. Chem. Soc., 135, 14528–14531, doi:10.1021/ja407117x, 2013.
Bates, T., Quinn, P., Frossard, A., Russell, L., Hakala, J., Petäjä, T., Kulmala, M., Covert, D., Cappa, C., and Li, S. M.: Measurements of ocean derived aerosol off the coast of california, J. Geophys. Res.-Atmos., 117, D00V15, doi:10.1029/2012JD017588, 2012.
Biskos, G., Malinowski, A., Russell, L., Buseck, P., and Martin, S.: Nanosize effect on the deliquescence and the efflorescence of sodium chloride particles, Aerosol Sci. Tech., 40, 97–106, doi:10.1080/02786820500484396, 2006.
Bouvet, M., Hoepffner, N., and Dowell, M. D.: Parameterization of a spectral solar irradiance model for the global ocean using multiple satellite sensors, J. Geophys. Res.-Oceans, 107, 8-1–8-18, doi:10.1029/2001JC001126, 2002.
Canagaratna, M. R., Jayne, J. T., Jimenez, J. L., Allan, J. D., Al-farra, M. R., Zhang, Q., Onasch, T. B., Drewnick, F., Coe, H., Middlebrook, A., Delia, A., Williams, L. R., Trimborn, A. M., Northway, M. J., DeCarlo, P. F., Kolb, C. E., Davidovits, P., and Worsnop, D. R.: Chemical and microphysical characterization of ambient aerosols with the aerodyne aerosol mass spectrome-ter, Mass Spectrom. Rev., 26, 185–222, doi:10.1002/mas.20115, 2007.
Cappa, C. D., Che, D. L., Kessler, S. H., Kroll, J. H., and Wilson, K. R.: Variations in organic aerosol optical and hygroscopic proper-ties upon heterogeneous oh oxidation, J. Geophys. Res.-Atmos., 116, D15204, doi:10.1029/2011JD015918, 2011.
Cappa, C. D., Onasch, T. B., Massoli, P., Worsnop, D., Bates, T. S., Cross, E., Davidovits, P., Hakala, J., Hayden, K., Jobson, B. T., Kolesar, K. R., Lack, D. A., Lerner, B., Li, S. M., Mellon, D., Nuaanman, I., Olfert, J., Petaja, T., Quinn, P. K., Song, C., Subra-manian, R., Williams, E. J., and Zaveri, R. A.: Radiative absorp-tion enhancements due to the mixing state of atmospheric black carbon, Science, 337, 1078–1081, doi:10.1126/science.1223447, 2012.
Carslaw, K., Lee, L., Reddington, C., Pringle, K., Rap, A., Forster, P., Mann, G., Spracklen, D., Woodhouse, M., and Regayre, L.: Large contribution of natural aerosols to uncertainty in indirect forcing, Nature, 503, 67–71, doi:10.1038/nature12674, 2013. Cochran, R., Laskina, O., Jayarathne, T., Laskin, A., Laskin, J., Lin,
P., Sultana, C. M., Moore, K. A., Cappa, C., Bertram, T., Prather, K. A., and Grassian, V. H.: Analysis of organic anionic surfac-tants in fine (pm2.5) and coarse (pm10) fractions of freshly emit-ted sea spray aerosol, Environ. Sci. Technol., 50, 2477–2486, doi:10.1021/acs.est.5b04053, 2016.
Collins, D. B., Ault, A. P., Moffet, R. C., Ruppel, M. J., Cuadra-Rodriguez, L. A., Guasco, T. L., Corrigan, C. E., Pedler, B. E., Azam, F., and Aluwihare, L. I.: Impact of marine biogeochem-istry on the chemical mixing state and cloud forming ability of nascent sea spray aerosol, J. Geophys. Res.-Atmos., 118, 8553– 8565, doi:10.1002/jgrd.50598, 2013.
Cruz, C. N. and Pandis, S. N.: Deliquescence and hygroscopic growth of mixed inorganic-organic atmospheric aerosol, En-viron. Sci. Technol., 34, 4313–4319, doi:10.1021/es9907109, 2000.
Dusek, U., Frank, G., Hildebrandt, L., Curtius, J., Schnei-der, J., Walter, S., Chand, D., Drewnick, F., Hings, S., and Jung, D.: Size matters more than chemistry for cloud-nucleating ability of aerosol particles, Science, 312, 1375–1378, doi:10.1126/science.1125261, 2006.
Farmer, D. K., Cappa, C. D., and Kreidenweis, S. M.: At-mospheric processes and their controlling influence on cloud condensation nuclei activity, Chem. Rev., 115, 4199–4217, doi:10.1021/cr5006292, 2015.
Frossard, A. A., Russell, L. M., Massoli, P., Bates, T. S., and Quinn, P. K.: Side-by-side comparison of four techniques explains the apparent differences in the organic composition of generated and ambient marine aerosol particles, Aerosol Sci. Tech., 48, v–x, doi:10.1080/02786826.2013.879979, 2014.
Fuentes, E., Coe, H., Green, D., and McFiggans, G.: On the impacts of phytoplankton-derived organic matter on the properties of the primary marine aerosol – Part 2: Composition, hygroscopicity and cloud condensation activity, Atmos. Chem. Phys., 11, 2585– 2602, doi:10.5194/acp-11-2585-2011, 2011.
Gard, E. E., Kleeman, M. J., Gross, D. S., Hughes, L. S., Allen, J. O., Morrical, B. D., Fergenson, D. P., Dienes, T., Galli, M. E., Johnson, R. J., Cass, G. R., and Prather, K. A.: Direct observa-tion of heterogeneous chemistry in the atmosphere, Science, 279, 1184–1187, doi:10.1126/science.279.5354.1184, 1998. Guasco, T. L., Cuadra-Rodriguez, L. A., Pedler, B. E., Ault, A.
P., Collins, D. B., Zhao, D., Kim, M. J., Ruppel, M. J., Wil-son, S. C., and Pomeroy, R. S.: Transition metal associations with primary biological particles in sea spray aerosol gener-ated in a wave channel, Environ. Sci. Technol., 48, 1324–1333, doi:10.1021/es403203d, 2013.
Hansson, H.-C., Rood, M., Koloutsou-Vakakis, S., Hämeri, K., Orsini, D., and Wiedensohler, A.: Nacl aerosol particle hy-groscopicity dependence on mixing with organic compounds, J. Atmos. Chem., 31, 321–346, doi:10.1023/A:1006174514022, 1998.
Haywood, J., Ramaswamy, V., and Soden, B.: Tropo-spheric aerosol climate forcing in clear-sky satellite ob-servations over the oceans, Science, 283, 1299–1303, doi:10.1126/science.283.5406.1299, 1999.
Hegg, D. A., Covert, D. S., and Jonsson, H. H.: Measurements of size-resolved hygroscopicity in the California coastal zone, At-mos. Chem. Phys., 8, 7193–7203, doi:10.5194/acp-8-7193-2008, 2008.
IPCC: Climate change 2013: The physical science basis. Contribu-tion of working group i to the fifth assessment report of the in-tergovernmental panel on climate change, Cambridge University Press, Cambridge, United Kingdom and New York, NY, USA, 1535 pp., 2013.
Keene, W. C., Maring, H., Maben, J. R., Kieber, D. J., Pszenny, A. A., Dahl, E. E., Izaguirre, M. A., Davis, A. J., Long, M. S., and Zhou, X.: Chemical and physical characteris-tics of nascent aerosols produced by bursting bubbles at a model air-sea interface, J. Geophys. Res.-Atmos., 112, D21202, doi:10.1029/2007JD008464, 2007.
Kirchman, D. L., Suzuki, Y., Garside, C., and Ducklow, H. W.: High turnover rates of dissolved organic carbon during a spring phyto-plankton bloom, Nature, 352, 612–614, doi:10.1038/352612a0, 1991.
Kleefeld, C., O’Dowd, C. D., O’Reilly, S., Jennings, S. G., Aalto, P., Becker, E., Kunz, G., and de Leeuw, G.: Relative contribution of submicron and supermicron particles to aerosol light scattering in the marine boundary layer, J. Geophys. Res.-Atmos., 107, PAR 8-1–PAR 8-13, doi:10.1029/2000JD000262, 2002.
Kulkarni, P., Baron, P. A., and Willeke, K.: Aerosol measurement: Principles, techniques, and applications, John Wiley & Sons, ISBN-13: 9780470387412, 2011.
Langridge, J. M., Richardson, M. S., Lack, D., Law, D., and Mur-phy, D. M.: Aircraft instrument for comprehensive characteriza-tion of aerosol optical properties, part i: Wavelength-dependent optical extinction and its relative humidity dependence mea-sured using cavity ringdown spectroscopy, Aerosol Sci. Tech., 45, 1305–1318, doi:10.1080/02786826.2011.592745, 2011. Laskina, O., Morris, H. S., Grandquist, J. R., Qin, Z., Stone, E. A.,
Tivanski, A. V., and Grassian, V. H.: Size matters in the water uptake and hygroscopic growth of atmospherically relevant mul-ticomponent aerosol particles, The Journal of Physical Chemistry A, 119, 4489–4497, doi:10.1021/jp510268p, 2015.
Lawler, M. J., Whitehead, J., O’Dowd, C., Monahan, C., Mc-Figgans, G., and Smith, J. N.: Composition of 15–85 nm par-ticles in marine air, Atmos. Chem. Phys., 14, 11557–11569, doi:10.5194/acp-14-11557-2014, 2014.
Lee, C., Sultana, C. M., Collins, D. B., Santander, M. V., Axson, J. L., Malfatti, F., Cornwell, G. C., Grandquist, J. R., Deane, G. B., Stokes, M. D., Azam, F., Grassian, V. H., and Prather, K. A.: Ad-vancing model systems for fundamental laboratory studies of sea spray aerosol using the microbial loop, The Journal of Physical Chemistry A, 119, 8860–8870, doi:10.1021/acs.jpca.5b03488, 2015.
Lewis, E. R. and Schwartz, S. E.: Sea salt aerosol production: Mechanisms, methods, measurements, and models-a critical re-view, American Geophysical Union, Washington, DC, ISBN-10: 087590-417-3, 2004.
Li, W. K.: Annual average abundance of heterotrophic bacteria and synechococcus in surface ocean waters, Limnol. Oceanogr., 43, 1746–1753, doi:10.4319/lo.1998.43.7.1746, 1998.
Lopez-Yglesias, X. F., Yeung, M. C., Dey, S. E., Brechtel, F. J., and Chan, C. K.: Performance evaluation of the brechtel mfg. Hu-midified tandem differential mobility analyzer (bmi htdma) for studying hygroscopic properties of aerosol particles, Aerosol Sci. Tech., 48, 969–980, doi:10.1080/02786826.2014.952366, 2014. Massoli, P., Lambe, A., Ahern, A., Williams, L., Ehn, M.,
Mikkilä, J., Canagaratna, M., Brune, W., Onasch, T., and Jayne, J.: Relationship between aerosol oxidation level and hygroscopic properties of laboratory generated secondary or-ganic aerosol (soa) particles, Geophys. Res. Lett., 37, L24801, doi:10.1029/2010GL045258, 2010.
Ming, Y. and Russell, L. M.: Predicted hygroscopic growth of sea salt aerosol, J. Geophys. Res.-Atmos., 106, 28259–28274, doi:10.1029/2001JD000454, 2001.
Mochida, M. and Kawamura, K.: Hygroscopic properties of lev-oglucosan and related organic compounds characteristic to biomass burning aerosol particles, J. Geophys. Res.-Atmos., 109, D21202, doi:10.1029/2004jd004962, 2004.
Norrman, B., Zwelfel, U. L., Hopkinson, C. S., and Brian, F.: Pro-duction and utilization of dissolved organic carbon during an experimental diatom bloom, Limnol. Oceanogr., 40, 898–907, doi:10.4319/lo.1995.40.5.0898, 1995.
O’Dowd, C. D., Facchini, M. C., Cavalli, F., Ceburnis, D., Mircea, M., Decesari, S., Fuzzi, S., Yoon, Y. J., and Putaud, J.-P.: Bio-genically driven organic contribution to marine aerosol, Nature, 431, 676–680, doi:10.1038/nature02959, 2004.
O’Dowd, C. D., Langmann, B., Varghese, S., Scannell, C., Ce-burnis, D., and Facchini, M. C.: A combined organic-inorganic sea-spray source function, Geophys. Res. Lett., 35, L01801, doi:10.1029/2007GL030331, 2008.
O’Reilly, J. E., Maritorena, S., Mitchell, B. G., Siegel, D. A., Carder, K. L., Garver, S. A., Kahru, M., and McClain, C.: Ocean color chlorophyll algorithms for seawifs, J. Geophys. Res.-Oceans, 103, 24937-24953, doi:10.1029/98JC02160, 1998. Ovadnevaite, J., Ceburnis, D., Martucci, G., Bialek, J., Monahan, C., Rinaldi, M., Facchini, M. C., Berresheim, H., Worsnop, D. R., and O’Dowd, C.: Primary marine organic aerosol: A dichotomy of low hygroscopicity and high ccn activity, Geophys. Res. Lett., 38, L21806, doi:10.1029/2011GL048869, 2011.
Ovadnevaite, J., Ceburnis, D., Canagaratna, M., Berresheim, H., Bialek, J., Martucci, G., Worsnop, D. R., and O’Dowd, C.: On the effect of wind speed on submicron sea salt mass concentra-tions and source fluxes, J. Geophys. Res.-Atmos., 117, D16201„ doi:10.1029/2011jd017379, 2012.
Park, J. Y., Lim, S., and Park, K.: Mixing state of submicrome-ter sea spray particles enriched by insoluble species in bubble-bursting experiments, J. Atmos. Ocean. Tech., 31, 93–104, doi:10.1175/JTECH-D-13-00086.1, 2014.
Partanen, A.-I., Dunne, E. M., Bergman, T., Laakso, A., Kokkola, H., Ovadnevaite, J., Sogacheva, L., Baisnée, D., Sciare, J., Man-ders, A., O’Dowd, C., de Leeuw, G., and Korhonen, H.: Global modelling of direct and indirect effects of sea spray aerosol using a source function encapsulating wave state, Atmos. Chem. Phys., 14, 11731–11752, doi:10.5194/acp-14-11731-2014, 2014. Petters, M. D. and Kreidenweis, S. M.: A single parameter
repre-sentation of hygroscopic growth and cloud condensation nucleus activity, Atmos. Chem. Phys., 7, 1961–1971, doi:10.5194/acp-7-1961-2007, 2007.
Pilinis, C., Pandis, S. N., and Seinfeld, J. H.: Sensitivity of di-rect climate forcing by atmospheric aerosols to aerosol size and composition, J. Geophys. Res.-Atmos., 100, 18739–18754, doi:10.1029/95JD02119, 1995.
Pomeroy, L. R., Williams, P. J. L. B., Azam, F., and Hob-bie, J. E.: The microbial loop, Oceanography, 20, 28–33, doi:10.5670/oceanog.2007.45, 2007.
Prather, K. A., Bertram, T. H., Grassian, V. H., Deane, G. B., Stokes, M. D., DeMott, P. J., Aluwihare, L. I., Palenik, B. P., Azam, F., and Seinfeld, J. H.: Bringing the ocean into the laboratory to probe the chemical complexity of sea spray aerosol, P. Natl. Acad. Sci. USA, 110, 7550–7555, doi:10.1073/pnas.1300262110, 2013.
Pratt, K. A., DeMott, P. J., French, J. R., Wang, Z., Westphal, D. L., Heymsfield, A. J., Twohy, C. H., Prenni, A. J., and Prather, K. A.: In situ detection of biological particles in cloud ice-crystals, Nat. Geosci., 2, 397–400, doi:10.1038/ngeo521, 2009.
Quinn, P. K., Bates, T. S., Schulz, K. S., Coffman, D. J., Frossard, A. A., Russell, L. M., Keene, W. C., and Kieber, D. J.:
Con-tribution of sea surface carbon pool to organic matter en-richment in sea spray aerosol, Nature Geosci, 7, 228–232, doi:10.1038/ngeo2092, 2014.
Quinn, P. K., Collins, D. B., Grassian, V. H., Prather, K. A., and Bates, T. S.: Chemistry and related properties of freshly emitted sea spray aerosol, Chem. Rev., 115, 4383–4399, doi:10.1021/cr500713g, 2015.
Rinaldi, M., Fuzzi, S., Decesari, S., Marullo, S., Santoleri, R., Provenzale, A., Hardenberg, J., Ceburnis, D., Vaishya, A., and O’Dowd, C. D.: Is chlorophyllathe best surrogate for organic matter enrichment in submicron primary marine aerosol?, J. Geo-phys. Res.-Atmos., 118, 4964–4973, doi:10.1002/jgrd.50417, 2013.
Saxena, P., Hildemann, L. M., McMurry, P. H., and Sein-feld, J. H.: Organics alter hygroscopic behavior of atmo-spheric particles, J. Geophys. Res.-Atmos., 100, 18755–18770, doi:10.1029/95JD01835, 1995.
Schmidt, G. A., Ruedy, R., Hansen, J. E., Aleinov, I., Bell, N., Bauer, M., Bauer, S., Cairns, B., Canuto, V., and Cheng, Y.: Present-day atmospheric simulations using giss modele: Com-parison to in situ, satellite, and reanalysis data, J. Climate, 19, 153–192, 2006.
Sellegri, K., Villani, P., Picard, D., Dupuy, R., O’Dowd, C., and Laj, P.: Role of the volatile fraction of submicron marine aerosol on its hygroscopic properties, Atmos. Res., 90, 272–277, doi:10.1016/j.atmosres.2008.04.004, 2008.
Shaw, S. L., Gantt, B., and Meskhidze, N.: Production and emis-sions of marine isoprene and monoterpenes: A review, Adv. Me-teorol., 2010, 408696, doi:10.1155/2010/408696, 2010. Skop, R. A., Viechnicki, J. T., and Brown, J. W.: A model
for microbubble scavenging of surface-active lipid molecules from seawater, J. Geophys. Res.-Oceans, 99, 16395–16402, doi:10.1029/94JC01199, 1994.
Stefan, R. L. and Szeri, A. J.: Surfactant scavenging and surface deposition by rising bubbles, Journal of colloid and interface sci-ence, 212, 1–13, doi:10.1006/jcis.1998.6037, 1999.
Stier, P., Feichter, J., Kinne, S., Kloster, S., Vignati, E., Wilson, J., Ganzeveld, L., Tegen, I., Werner, M., Balkanski, Y., Schulz, M., Boucher, O., Minikin, A., and Petzold, A.: The aerosol-climate model ECHAM5-HAM, Atmos. Chem. Phys., 5, 1125–1156, doi:10.5194/acp-5-1125-2005, 2005.
Stokes, M. D., Deane, G. B., Prather, K., Bertram, T. H., Ruppel, M. J., Ryder, O. S., Brady, J. M., and Zhao, D.: A Marine Aerosol Reference Tank system as a breaking wave analogue for the pro-duction of foam and sea-spray aerosols, Atmos. Meas. Tech., 6, 1085–1094, doi:10.5194/amt-6-1085-2013, 2013.
Stokes, R. and Robinson, R.: Interactions in aqueous nonelectrolyte solutions. I. Solute-solvent equilibria, The Journal of Physical Chemistry, 70, 2126–2131, doi:10.1021/j100879a010, 1966. Sultana, C. M., Collins, D. B., and Prather, K. A.: The Effect of
Structural Heterogeneity in Chemical Composition on Online Analysis of Sea Spray Aerosol Particles, in preparation, 2016. Tseng, R. S., Viechnicki, J. T., Skop, R. A., and Brown, J.
W.: Sea-to-air transfer of surface-active organic compounds by bursting bubbles, J. Geophys. Res.-Oceans, 97, 5201–5206, doi:10.1029/91JC00954, 1992.
on sea spray radiative properties, Geophys. Res. Lett., 40, 6395– 6398, doi:10.1002/2013GL058452, 2013.
Vesna, O., Sjogren, S., Weingartner, E., Samburova, V., Kalberer, M., Gäggeler, H. W., and Ammann, M.: Changes of fatty acid aerosol hygroscopicity induced by ozonolysis under humid con-ditions, Atmos. Chem. Phys., 8, 4683–4690, doi:10.5194/acp-8-4683-2008, 2008.
Wang, X., Sultana, C. M., Trueblood, J., Hill, T. C. J., Malfatti, F., Lee, C., Laskina, O., Moore, K. A., Beall, C. M., McCluskey, C. S., Cornwell, G. C., Zhou, Y., Cox, J. L., Pendergraft, M. A., San-tander, M. V., Bertram, T. H., Cappa, C. D., Azam, F., DeMott, P. J., Grassian, V. H., and Prather, K. A.: Microbial control of sea spray aerosol composition: A tale of two blooms, ACS Central Science, 1, 124–131, doi:10.1021/acscentsci.5b00148, 2015. Wiedensohler, A., Birmili, W., Nowak, A., Sonntag, A., Weinhold,
K., Merkel, M., Wehner, B., Tuch, T., Pfeifer, S., Fiebig, M., Fjäraa, A. M., Asmi, E., Sellegri, K., Depuy, R., Venzac, H., Vil-lani, P., Laj, P., Aalto, P., Ogren, J. A., Swietlicki, E., Williams, P., Roldin, P., Quincey, P., Hüglin, C., Fierz-Schmidhauser, R., Gysel, M., Weingartner, E., Riccobono, F., Santos, S., Grüning, C., Faloon, K., Beddows, D., Harrison, R., Monahan, C., Jen-nings, S. G., O’Dowd, C. D., Marinoni, A., Horn, H.-G., Keck, L., Jiang, J., Scheckman, J., McMurry, P. H., Deng, Z., Zhao, C. S., Moerman, M., Henzing, B., de Leeuw, G., Löschau, G., and Bastian, S.: Mobility particle size spectrometers: harmonization of technical standards and data structure to facilitate high qual-ity long-term observations of atmospheric particle number size distributions, Atmos. Meas. Tech., 5, 657–685, doi:10.5194/amt-5-657-2012, 2012.
Wise, M. E., Surratt, J. D., Curtis, D. B., Shilling, J. E., and Tolbert, M. A.: Hygroscopic growth of ammonium sul-fate/dicarboxylic acids, J. Geophys. Res.-Atmos., 108, D204638, doi:10.1029/2003jd003775, 2003.
Zhang, X., Massoli, P., Quinn, P. K., Bates, T. S., and Cappa, C. D.: Hygroscopic growth of submicron and supermicron aerosols in the marine boundary layer, J. Geophys. Res.-Atmos., 119, 8384– 8399, doi:10.1002/2013JD021213, 2014.