www.atmos-chem-phys.net/11/13047/2011/ doi:10.5194/acp-11-13047-2011
© Author(s) 2011. CC Attribution 3.0 License.
Chemistry
and Physics
Seasonal variations in aerosol particle composition at the
puy-de-Dˆome research station in France
E. J. Freney1, K. Sellegri1, F. Canonaco2, J. Boulon1, M. Hervo1, R. Weigel1,*, J. M. Pichon1, A. Colomb1, A. S. H. Pr´evˆot2, and P. Laj1,**
1Laboratoire de M´et´eorologie Physique, CNRS-Universit´e Blaise Pascal, UMR6016, 63117, Clermont Ferrand, France 2Laboratory of Atmospheric Chemistry, Paul Scherrer Institut, 5232 Villigen, Switzerland
*now at: Institute for Physics of the Atmosphere, Johannes Gutenberg University Mainz, Germany
**now at: Laboratoire de Glaciologie et G´eophysique de l’Environnement, CNRS UMR5183, Universit´e Joseph Frourier
Grenoble 1, Saint Martin d’H´eres, France
Received: 8 August 2011 – Published in Atmos. Chem. Phys. Discuss.: 4 October 2011 Revised: 13 December 2011 – Accepted: 13 December 2011 – Published: 21 December 2011
Abstract. Detailed investigations of the chemical and microphysical properties of atmospheric aerosol particles were performed at the puy-de-Dˆome (pdD) research station (1465 m) in autumn (September and October 2008), winter (February and March 2009), and summer (June 2010) using a compact Time-of-Flight Aerosol Mass Spectrometer (cToF-AMS). Over the three campaigns, the average mass con-centrations of the non-refractory submicron particles ranged from 10 µg m−3up to 27 µg m−3. Highest nitrate and ammo-nium mass concentrations were measured during the winter and during periods when marine modified airmasses were ar-riving at the site, whereas highest concentrations of organic particles were measured during the summer and during peri-ods when continental airmasses arrived at the site. The mea-surements reported in this paper show that atmospheric par-ticle composition is strongly influenced by both the season and the origin of the airmass. The total organic mass spectra were analysed using positive matrix factorisation to separate individual organic components contributing to the overall or-ganic particle mass concentrations. These oror-ganic compo-nents include a low volatility oxygenated organic aerosol par-ticle (LV-OOA) and a semi-volatile organic aerosol parpar-ticle (SV-OOA). Correlations of the LV-OOA components with fragments ofm/z60 andm/z 73 (mass spectral markers of wood burning) during the winter campaign suggest that win-tertime LV-OOA are related to aged biomass burning emis-sions, whereas organic aerosol particles measured during the
Correspondence to:E. J. Freney (e.freney@opgc.univ-bpclermont.fr)
summer are likely linked to biogenic sources. Equivalent po-tential temperature calculations, gas-phase, and LIDAR mea-surements define whether the research site is in the planetary boundary layer (PBL) or in the free troposphere (FT)/residual layer (RL). We observe that SV-OOA and nitrate particles are associated with air masses arriving from the PBL where as particle composition measured from RL/FT airmasses con-tain high mass fractions of sulphate and LV-OOA. This study provides unique insights into the effects of season and air-mass variability on regional aerosol particles measured at an elevated site.
1 Introduction
Submicron atmospheric aerosols exert a highly uncertain ef-fect on radiative climate forcing and can have serious impacts on human health. For this reason, detailed and long-term analysis of the physicochemical properties of atmospheric aerosol particles is crucial to understand their processes and lifetime in the atmosphere. A network of both high (>2000 m) and low (<1000 m) elevation measurement sites have provided the opportunity to study the long-term vari-ability of aerosol particle properties in Europe. These urban and rural research sites are most commonly equipped with size distribution measurements and filters for offline particle composition measurements (Nyeki et al., 1998; Weingartner et al., 1999; Gelencser et al., 2007; Venzac et al., 2009).
environments. However, the coarse time and size resolution of these measurements limits our knowledge on the physi-cal and chemiphysi-cal properties of aerosol particles. In the last decade, online aerosol mass spectrometers have been used to provide highly time resolved quantitative data on submicron inorganic and organic aerosol species. There have recently been several reports summarizing aerosol mass spectrome-try measurements made in the Northern Hemisphere (Zhang et al., 2005; Jimenez et al., 2009; Ng et al., 2010), showing that aged organic compounds are the largest contributor to the submicron particle mass. In Europe, Lanz et al. (2010) overviewed the results of several campaigns carried out in the alpine region over a number of different seasons, provid-ing detailed information on the aerosol particle chemical and physical properties at both high- and low-altitude sites and during several different seasons of the year. Similar to previ-ous observations they showed that organic compounds were the most abundant species in the submicron particle fraction, with biomass burning organic aerosol particles being impor-tant during the winter and low-volatility organic aerosol (LV-OOA) dominating during the spring and summer. Although these studies provide information on the background com-position during different seasons they are unable to provide information on the seasonal variability at the same site.
The puy-de-Dˆome (pdD) research site is classified as a mid-altitude site (1465 m) where at night the research site is commonly in the residual layer (RL) or in the free tropo-sphere (FT), but during the day it is exposed to airmasses arriving from the planetary boundary layer (PBL) (Venzac et al., 2009). Therefore, at the pdD site, measured particle composition during the day can be representative of bound-ary layer air masses, whereas at night particle composition is representative of regional air masses. These features make the pdD research site an ideal place to characterise both re-gional and local boundary layer pollution conditions through examining the diurnal variability of aerosol particle proper-ties. A compact Time-of-Flight Aerosol Mass Spectrometer (cToF-AMS) was deployed at the pdD site during three dif-ferent seasons of the year as part of the European monitor-ing and evaluation program (EMEP). The aim of EMEP is to characterise the physical and chemical properties of the aerosol population in Europe through carrying out simulta-neous aerosol composition measurements at several different research sites. In this paper, we report the chemical com-position, concentrations, and temporal variations of the non-refractory particle components at the pdD site. The focus of this study was to characterise the seasonal variability in the chemistry of both long-range transported and less aged PBL airmasses with high-time resolution, and thereby offering in-sights into the sources and properties of aerosol particles ar-riving at an elevated background site.
2 Experimental
2.1 Sampling site
The pdD research station is located in central France (45◦46 N, 2◦57 E). The station is surrounded by agricultural and forest areas. The city of Clermont-Ferrand (150 000 in-habitants) is located 16 km east of the station at 396 m. A detailed description of the site is provided by Venzac et al. (2009). The pdD research site contains a number of dif-ferent instruments capable of resolving the physical, chemi-cal, optichemi-cal, and hygroscopic properties of aerosol particles. The site is in cloud approximately 50 % of the time between November and March. For this reason the site is equipped with two different types of stainless steel inlets; a whole air inlet capable of sampling cloud droplets together with inter-stitial (non-activated) particles (whole air inlet (WAI)), and a second inlet capable of sampling only interstitial particles. The WAI inlet has a 50 % cut-off at 30 µm and the interstitial inlet has a 50 % cut-off at 1.6 µm. These inlets do not allow for isokinetic sampling. Meteorological parameters (includ-ing wind direction, wind speed, relatively humidity (RH), pressure, and temperature), aerosol physical and chemical properties (particle size, black carbon mass), and gas-phase species (SO2, CO, CO2, O3, NO, and NO2) are measured
continuously throughout the year. Particle size distributions between 20 and 800 nm were measured using a scanning mo-bility particle sizer (SMPS), and the black carbon (BC) mass concentration was measured using a Multi Angle Absorp-tion Photometer (MAAP 5012). The SMPS and MAAP were sampling behind the WAI, whereas the AMS was situated be-hind the interstitial inlet.
2.2 Backward trajectories
In order to determine the transport pathways of the aerosol particles prior to arriving at the pdD site (1465 m), the Hybrid Single Particle Langrangian Trajectory (HYSPLIT) model was used. Seventy-two hour backward trajectories were computed for every hour for each day of the campaign. Trajectories were classified according to their predominant transport direction prior to measurement as either continental (C), marine (M), marine modified (Mod), and Mediterranean (Med) (Fig. S1). If air mass trajectories show a combination of transport direction during the 72-h period the air mass is classified as mixed.
2.3 LIDAR and temperature profile measurements
The calculated (θ e) is used to identify if the measurements at the pdD site were performed in the PBL, FT, or RL. Figure 1, shows the correlation ofθ eat the OPGC with those at the pdD site coloured by hour of day for the three different cam-paigns. The largest difference inθ ebetween the two sites occurs during the evening hours. This difference is most pro-nounced during the winter campaign when the pdD is most often in the free troposphere. During the summer campaign, LIDAR measurements were also available (Fig. 1d). The spatial raw resolution of the detected signals is 15 m. The LIDAR instrument is positioned on the roof of the OPGC. There was no cloud cover over the OPGC or pdD during the LIDAR measurements. The boundary layer height was deter-mined by a wavelength covariance technique (Brooks, 2003), and exhibit a weak diurnal variation in boundary layer height. However, these measurements show that during the summer, the pdD site was always sampling in the PBL or RL.
2.4 Time-of-flight aerosol mass spectrometer
The chemical composition and mass concentration of the non-refractory submicron particulate matter (NR-PM1) was measured with an Aerodyne cToF-AMS (Drewnick et al., 2005; Canagaratna et al., 2007). In order to extract chem-ically resolved mass concentrations of individual aerosol species, the AMS raw data are evaluated with standard as-sumptions as described by Allan et al. (2004). Filter mea-surements, in which the AMS sampled filtered air, were made approximately every 48 h. The resolved mass concen-trations include ammonium, sulphate, nitrate, organic, and chloride species. For the organic mass spectra additional analysis was carried out using positive matrix factorisation (PMF). The cToF-AMS was sampling behind an interstitial inlet. For this reason, when the site was advected by clouds, the cToF-AMS sampled only those particles not activated into clouds. For the purpose of this study only periods when the site was not in cloud are taken into account.
The calculation of the mass concentrations from the cToF-AMS mass spectra requires that a collection efficiency (CE) be applied to the data. The CE is defined as the fraction of the particle mass that is measured by the cToF-AMS, rela-tive to what would have been measured if all particles were spherical and particle bounce was negligible. Recently, it has been demonstrated that particles containing high ammo-nium nitrate concentrations are more efficiently sampled by the AMS than other inorganic and organic species (Middle-brook et al., 2012). Ammonium nitrate particles tend to be spherical and retain water even at very low RH values and are therefore efficiently focused by the particle beam and are not subjected to particle losses from particle bounce (Mid-dlebrook et al., 2012). Mid(Mid-dlebrook et al. (2012) illustrated, using a series of equations, how a composition dependent CE can be applied to particle mass concentrations. Middlebrook et al. (2012) uses a constant CE of 0.45 for an ammonium nitrate mass fraction (ANMF)<0.4 and a linear CE increase
up to 1 for ANMF>0.4. In this study, a similar composition dependent CE is applied to the data.
CEDRY=max(0.5,0.264+0.943×ANMF) (1)
in which a constant CE of 0.5 is used for ANMF<0.25 and a linear CE increase up to 1 for ANMF>0.25. Since the majority of aerosol particles arriving at the pdD site are thought to be internally mixed, this composition dependent CE was applied to all species sampled by the AMS. A time series of the composition dependent CE for each campaign is illustrated in Fig. S2. In order to assess how accurate our chosen CE was at quantifying the mass of aerosol par-ticles in the atmosphere, we compared the total volume of aerosol particles sampled by the AMS and BC with that sampled by a SMPS. The AMS volume was calculated by dividing the mass concentrations of organic and inorganic species by their respective densities (1.72 µg cm−3for SO
4,
NH4, NO3, 1.2 µg cm−3 for organics, and 1.8 µg cm−3 for
BC). During this study, the SMPS was sampling behind a WAI inlet, where as the AMS was sampling behind the interstitial inlet and hence the AMS did not sample par-ticles with the same efficiency as the SMPS. In addition the SMPS was not sampling in the same building at the time of the respective campaigns. The resulting slopes and
r2, respectively for each comparison were as follows; Au-tumn, slope = 0.76 and r2=0.44 (the calculated ratio be-tween SMPS:AMS for the whole period was measured at 0.95), Winter, slope = 0.51 andr20.71 (the average ratio of SMPS:AMS = 1.61), and summer slope = 0.68 and r2=44 (the average ratio of SMPS:AMS = 0.85) for the autumn, winter, and summer, respectively (Fig. S3). Periods with largest discrepancies were observed during episodes when increased particle numbers were sampled by the SMPS. The size distributions of all particles during all seasons arriving at pdD are characteristic of aged particles showing a major accumulation mode peaking at an aerodynamic diameter of 600 nm (Fig. S4). This monomodal peak is expected since the site is not exposed to fresh emissions but rather to parti-cles transported long distances and thus considerably aged.
2.5 Positive matrix factorisation
The unit mass resolution organic mass spectra from the cToF-AMS instrument are analysed using positive matrix factori-sation (PMF). PMF is a statistical technique in which the organic mass spectral time series (X) are represented as a linear combination of a set of characteristic factor profiles (F) and their time-dependant intensities (G) (Paatero and Tapper, 1994; Paatero, 1997). PMF is therefore described by the matrix equation X=GF+E, where E is the resid-ual matrix, defined as the difference between the data matrix
θ
e
at pdD (K)
θe at Cz (K) 300 310 320 330 340 350 360 θ e
at pdD (K)
290 300 310 320 330 340 θ e
at pdD (K)
285 290 295 305 310 315 320
285 290 295 305 310 315 320 300
300
θe at Cz (K)
290 300 310 320 330 340 300 310 320 330 340 350 360
θe at Cz (K)
24:00 16:00 12:00 08:00 04:00 00:00 20:00 24:00 16:00 12:00 08:00 04:00 00:00 20:00 24:00 16:00 12:00 08:00 04:00 00:00 20:00
Hour of Day
Hour of Day
Hour of Day
Altitude (m)
103 104
0 4 8 12 24
1 3 5 7 9 x 10⁵
Time (UTC) 16
Arbitary units
a)
b)
c)
d)
Fig. 1. Equivalent potential temperature (θ e) determined from meteorological parameters measured at pdD and at the OPGC for the(a) autumn,(b)winter, and(c)summer campaign coloured by hour of day (UTC).(d) Lidar image, coloured by range-corrected signal at 355 nm (arbitrary units) taken during the summer campaign showing that the pdD station was always in the boundary layer (values greater than 3×10⁵). The dark dotted line represents to the height of the pdD (1465 m a.s.l).
calculated in the Squirrel software (version 1.51) was modi-fied following the recommendations of Ulbrich et al. (2009) and references therein. A minimum error of 1 ion was ap-plied throughout theXmatrix, and the organic peaks calcu-lated as the fraction of the CO+2 ion (m/z44, 18, 17, and 16) were down weighted as described in Ulbrich et al. (2009). Matrix rotations were explored by varying thefpeak
parame-ter from−3 to +3. Thefpeakparameter allows the user to
ex-plore different PMF solutions that give the same fit to the data (Ulbrich et al., 2009). The number of PMF factors andfpeak
values were determined by minimising the scaled residuals and factor correlations with external tracers (including CO, O3, NOx, SO2, NO−3, and SO24−) and comparing the
compo-nent mass spectra with reference mass spectra available on the AMS mass spectral database (Lanz et al., 2007; Ulbrich et al., 2009). Afpeakvalue at which a local minimum in the
solution space (Q/Qexp) was achieved is used to represent
each database (Fig. S5). An optimumfpeak value of 0 was
applied for each dataset. Correlations of the resolved mass spectral profiles with reference mass spectra and correlations of the organic time series with the time series of other partic-ulate and gas phase species are supplied in the supplementary material (Table S1).
3 Results and discussion
3.1 Characterisation of the submicron particle composition
A time series of sulphate (SO4), nitrate (NO3), ammonium
(NH4), organics (Org), chloride (Cl), and black carbon
(BC)-bearing particles is shown in Fig. 2. Meteorological param-eters are listed in Table 1. Average values for each aerosol particle species measured by the AMS, during clear sky pe-riods are listed in Table 2. The weather conditions dur-ing this study were characterized by high RH (86±12 %) and temperatures ranging from 0.1◦C to 18◦C (average = 9±4◦C),−8◦C to 13◦C (average = 1±4◦C), and 2◦C to 25◦C (average = 14±5◦C), during the autumn, winter, and summer campaigns, respectively. Highest average aerosol mass concentrations were observed during the summer cam-paign (27 µg m−3) and lowest during the winter campaign (10 µg m−3), in agreement with seasonal variability observed at the site for particle number concentrations (Venzac et al., 2009) and particle mass concentrations measured at other high-altitude stations in Europe (Kasper and Puxbaum, 1998; Weingartner et al., 1999).
On the basis of campaign averages and in the order of the campaigns (autumn 2008, winter 2009, summer 2010), the organic mass contributed 32 % (2.52 µg m−3), 23 % (1.24 µg m−3), and 56 % (15.59 µg m−3) to the NR-PM1. Sulphate particles contributed between 30 % (2.4 µg m−3), 22 % (1.28 µg m−3), and 20 % (5.45 µg m−3), and nitrate
con-tributed 15 % (1.14 µg m−3), 31 % (1.71 µg m−3), and 9 %
(2.33 µg m−3). Ammonium contributed 18 % (1.36 µg m−3),
20 % (1.08 µg m−3), and 13 % (3.69 µg m−3). Chloride
Table 1. Average meteorological parameters and particle number concentration measured at the pdD site for each of the campaigns. The errors represent one standard deviation.
Particle concentration (SMPS) (cm−3)
Season Temp◦C RH Wind speed (ms−1) UV Day Night
Autumn 9±4 86 %±18 6±4 5±7 3018±1969 2003±1259
Winter 1±4 86 %±21 7±4 5±7 1557±1443 1301±1160
Summer 14±5 87 %±12 2.2±1.2 9±11 3405±1156 3364±1108
Table 2.The fractional contribution of each species to the total submicron particle mass (%) and their corresponding average mass concen-trations (µg m−3). The value shown for each of the separated organic species (LVOOA and SV-OOA) is the fractional contribution of these species to the total organics.
Season SO4 NO3 NH4 Chl Org BC LV-OOA SV-OOA
Autumn % 30 15 18 0.3 32 5 73 27
µg m−3 2.4 1.14 1.36 0.02 2.52 0.38 1.27 0.48
Winter % 23 31 20 1 23 2 52 48
µg m−3 1.28 1.71 1.08 0.07 1.24 0.2 0.412 0.418
Summer % 20 9 13 0.2 56 2 68 32
µg m−3 5.45 2.33 3.69 0.06 15.59 0.474 7.82 3.76
particle mass concentrations measured during the summer are similar to those observed at other sites during the summer (Lanz et al., 2010), but are much higher than those measured during the autumn and winter campaign at the pdD.
Particle composition measurements made during spring and summer months at elevated (Jungfraujoch) and remote (Hohenpeissenberg) sites in Europe (Hock et al., 2008; Hueglin et al., 2009; Lanz et al., 2010) report Org ranging from 43 % to 50 %, SO4ranging from 26 % to 19 %, NO3
ranging from 18 % to 19 % and NH4 contributing between
13 % and 11 %. Lanz et al. (2010) measured similar parti-cle compositions during the winter at a low altitude site as those measured at high altitude during the summer, suggest-ing that the type of site (Alpine valleys, elevated sites in the Alps, or Plateau sites) is more important than where the site is situated (rural vs urban) for describing particle composi-tion. Particle mass concentrations measured at the pdD are similar to those of Lanz et al. (2010) for the summer period showing a high contribution of organic material, however for the winter we see marked differences in particle composi-tion with a significant decrease in the contribucomposi-tion of organic particles (from 56 % (summer) to 23 % (winter)), as well as significant increases in the contributions of nitrate particles (from 8 % (summer) to 31 % (winter)). This shows that there are strong seasonal influences on aerosol particle composi-tion and should be considered when estimating the particle composition during different seasons of the year. The time series of the NR-PM1 chemical components sampled within a given campaign generally had similar trends and
varia-tions. During these measurements, ion balance is achieved for NH4, NO3, and SO4, if NO3 is assumed to be from
NH4NO3, and SO4is assumed to be from(NH4)2SO4. This
is illustrated in Fig. S6 where the plot of the measured NH4
vs predicted NH4 falls along the 1:1 line. This shows that
aerosol particles measured by the AMS are fully neutralised by ammonium and there are no acidic aerosol particles.
During the autumn, winter, and summer campaigns the NH4 correlate with NO3(r2=0.67, 0.97, and 0.32
respec-tively) and SO4 (r2=0.68, 0.85, and 0.78, respectively).
The organic aerosol species are correlated with the inorganic species during the autumn (averager2with SO4, NO3, and
NH4 = 0.55), and winter (average r2 with SO4, NO3, and
NH4is 0.62), however, during the summer theser2
correla-tions decreased to approximately 0.15 for NH4and SO4and
to<0.01 for NO3bearing particles because of the high
04/03/2009
a)
b)
c)
Date
Date Date
Fig. 2. Mass concentration of organic and inorganic particles measured by the AMS, and BC measured by MAAP during autumn, winter,
and summer. Pie charts illustrate the average particle composition measured during each campaign. Coloured bars at the top of each graph indicate the source of the airmass. When the bars are multicoloured it indicates that the airmasses were mixed during this period of sampling.
3.2 PMF analysis of organic fraction
In order to fully characterize the organic fraction collected at pdD, PMF analysis was performed separately on each of the datasets, however the resolved PMF factors were simi-lar during all seasons allowing for a direct comparison of the datasets. The number of factors chosen from the PMF anal-ysis was based on the temporal evolution of each of the or-ganic species as well as changes in their mass spectral prop-erties. Two different types of organic compounds were cho-sen to adequately reprecho-sent the organic particle fraction at the pdD site. A PMF solution for three factors is shown in Figs. S7 and S8. However, we believe that there is no sig-nificant change in the temporal evolution and in the mass spectral properties of each of the organic species when go-ing from a two to a three factor solution, and we therefore chose the two factor PMF solution. The resulting mass spec-tra and time series of each of the different components re-solved during each campaign are illustrated in Fig. 3 and Fig. S9, respectively. A full list of correlations of all PMF components with reference mass spectra and with gas and particle phase species is available in the supplementary ma-terial (Table S1). The average mass concentrations and frac-tional contributions of the different organic components are shown in Table 2. Only oxidised organic aerosol (OOA) par-ticles were resolved from cToF-AMS measurements made at
the pdD research site. This OOA could be separated into two different types of OOA;OOA1 and OOA2. OOA1 con-tributed approximately 65±5 % to the total organic aerosol during all campaigns and had a similar mass spectral signa-ture to OOA measured in Europe and in the United States (Ng et al., 2010, 2011) (Fig. 4). The mass spectral properties of this OOA are defined by having a dominant peak atm/z 44 and are generally associated with organic aerosol parti-cles that are aged and have a low volatility. They are there-fore termed a low-volatility oxidised organic aerosol particle (LV-OOA).
For the summer campaign the time series of the LV-OOA component showed strongest correlations with that of O3
(r2=0.52), CO (r2=0.33), and BC (r2=0.44) (Table S1). Ozone has been shown to be a good marker for the pro-duction of secondary organic aerosols in some campaigns (Cabada et al., 2004), but other studies show that this is not always the case (Zhang et al., 2005). During the autumn and winter the LV-OOA component showed good correla-tions (r2>0.50) with both NO3and NH4. Correlations
m/z
LV-OOA (This study) SV-OOA (This study) LV-OOA (Ng et al., 2011) SV-OOA (Ng et al., 2011)
a) Autumn 2008
c) Summer 2010 b) Winter 2009
Fig. 3.Average mass spectra of organic species extracted from the total organic mass spectra for the(a)autumn,(b)winter, and(c) summer campaign. Smaller sticks overlayed on each mass spectral pattern represent those of Ng et al. (2011).
to biomass burning emission sources (DeCarlo et al., 2008). This is confirmed by the similarities of the LV-OOA mass spectra with the reference mass spectra of biomass burning organic aerosol (BBOA), which is due to contributions from m/z60 andm/z73, characteristic marker peaks for levoglu-cason. The weaker correlation between LV-OOA and SO4
during the autumn experiment suggests that some of the SO4
particles may have different sources to that of the organic species. Weak correlations between the organic and inor-ganic species throughout the summer experiment are a result of the very high mass concentration of the organic species suggesting different sources of the organics to the inorganic species. However, in addition to high organic mass concen-tration the lack of correlation between the organic and nitrate species is also a result of nitrate chemistry, with nitrate mass concentration decreasing during the day time hours, and the photochemical formation of organic species. Correlations between LV-OOA and BC (r2=0.44) suggest that some of the LV-OOA may be related to anthropogenic sources. In our
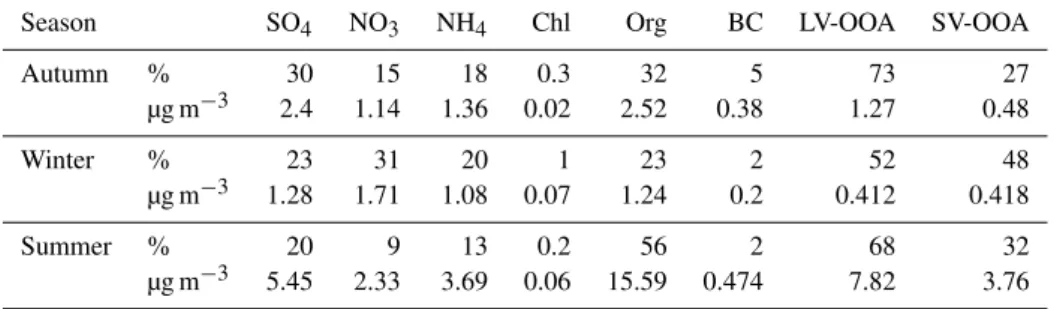
Fig. 4.Plot of the fraction of Org44 to total Organics (f44) against the fraction of Org43 to the total organics (f43) for each campaign. Each triangular point represents data averaged over a 60-min period. The star shaped points show f44 and f43 of each of the different organic species extracted from the total organic signal using PMF. The black dotted lines show the boundaries set by Ng et al. (2010).
three campaigns the strongest correlation of LV-OOA with ozone is observed for the summer when high organic mass concentrations were arriving at the pdD site, weaker corre-lations were observed during autumn and winter (r2<0.01 and 0.10, respectively) possibly suggesting a change in the precursor sources to the formation of LV-OOA depending on the season.
period showed little correlation with gas phase species or other inorganic compounds suggesting that this is an aged aerosol particle type. The residuals measured from the PMF analysis during this period of the winter campaign are higher than during the rest of the campaign. However, a pure pri-mary wood burning factor could not be extracted even when PMF analysis was performed only on this isolated period.
The second type of organic aerosol resolved during each of the campaigns closely resembled a less aged oxidized or-ganic aerosol. The less oxidized oror-ganic aerosol particle measured had dominant mass spectral peaks atm/z43, 44, 55, and 57, and was similar to the mass spectra of semi-volatile oxidized organic aerosol (SV-OOA) (Ng et al., 2011) (Fig. 3. During the winter campaign, the measured SV-OOA had low concentrations (0.3 µg m−3) throughout except for
one episode on March 6 when it showed a substantial in-crease in mass concentration (1.5 µg m−3) (Fig. S9).
Dur-ing this episode there was a correspondDur-ing increase in ni-trate and sulphate particle mass concentrations. The time se-ries of this SV-OOA correlates with the time sese-ries of NO3,
BC, and with gas phase species CO2 (r2=0.27) and NO2
(r2=0.48) suggesting that particles arrived from an anthro-pogenic source. During the autumn, SV-OOA particles con-tributed 25 % to the total organic aerosol mass spectra, and correlates well with that of with reference mass spectra for SV-OOA (r2=0.81) (Fig. 3), and with the time-series of BC (r2=0.12). Summer SV-OOA contributed 32 % to the over-all organic mass. Its mass spectra was well correlated to the literature mass spectra of SV-OOA (r2=0.73) (Fig. 3 and is also similar to mass spectra of secondary organic aerosols formed from alpha-pinene precursors (r2=0.73) (Bahreini et al., 2005) (Table S1). These correlations suggest that the SV-OOA may be formed from biogenic precursor gases. During the summer campaign there was a steadily increas-ing temperature under clear sky conditions and there was lit-tle contribution from BC (1.7 %). At the same time, the or-ganic aerosol mass builds steadily with maximum values in the early afternoon on 23, 24, 25, and 26 June. The con-centrations of all other species (sulphate, ammonium, and nitrate) remain low. These conditions are similar to those ob-served during a biogenic episode in Egbert, Ontario, Canada (Slowik et al., 2010), the organic mass spectra measured dur-ing this event in Canada are similar to our SV-OOA mass spectra (Fig. 2a in Slowik et al., 2010).
Recently, Ng et al. (2010) and Morgan et al. (2010), pro-posed a method to describe the aging of the OOA component in the atmosphere. Using the fractions of two major mass spectral peaks,m/z44 (CO+2) andm/z43 (mostly C2H3O+)
a triangular space was created in which organic aerosol parti-cles become progressively more aged and move towards the highest point of the triangle during the aging process. For our three campaigns the fraction ofm/zOrg44 to the total or-ganics (f44) is plotted against the fraction ofm/zOrg43 to the total organics (f43) (Fig. 4). All of our points and PMF com-ponents from each campaign cluster within the well-defined
triangular regions as outlined by Ng et al. (2010). The calcu-lated f44 and f43 from each of the PMF components for each campaign is also plotted on the graph. During the autumn, winter, and summer campaign the f44 for LV-OOA organics ranges from 0.19 to 0.24 which is similar to values reported by Ng et al. (2010) (0.10 to 0.25). SV-OOA during the au-tumn, winter, and summer ranged from 0.02 to 0.14.
From Fig. 4 it is apparent that aerosol particles measured during the summer are situated on the right side of the graph when it is likely to have more biogenic activity whereas those measured during the winter, when we expect to have the highest contribution from biomass burning, are located on the left side of the triangle. Organic mass spectra measured dur-ing the autumn are in the middle. Laboratory studies on sec-ondary organic aerosol formation from biogenic precursors show the resulting f44, f43 on the right side of the Ng triangle (Jimenez et al., 2009; Ng et al., 2010), whereas those from biomass burning emissions tend to be situated on the left side of the triangle (Heringa et al., 2011). This is in agreement with our previous discussions where the LV-OOA time series measured during the winter is strongly correlated with that of Chl (r2=0.78) and has similar mass spectra to reference BBOA mass spectra. For the summer campaign, the high correlations of the measured SV-OOA with the mass spectra of secondary organic aerosol formed from alpha-pinene is in agreement with the hypothesis that the organic mass spectra situated on the right hand side of the graph are likely related to the biogenic precursor sources. However, given its corre-lation with the time series of BC, the LV-OOA component measured during the summer is likely to also have an an-thropogenic source. These observations indicate that the for-mation of organic aerosol particle is strongly influenced by different processes and precursor sources occurring at dif-ferent times of the year. The seasonal segregation shown in our measurements of the organic mass spectra suggests that the triangle is not only descriptive for the aging of or-ganic aerosol particles but to some extent can also describe the source of the secondary organic aerosol particles.
3.3 Diurnal variations and air mass source
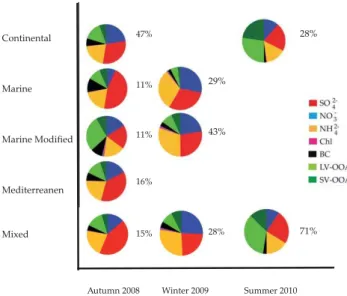
Mixed 15% 28% 16%
11% 11% 47%
Autumn 2008 Winter 2009 Summer 2010 Continental
Marine
Marine Modified
Mediterreanen
29%
43%
28%
71%
Fig. 5.Particle composition averaged over season and airmass type.
are measured in marine and marine modified air masses (1.2 µg m−3and 2.0 µg m−3respectively), in agreement with Bourcier et al. (2011). Figure 5 illustrates that within a given air mass type the aerosol composition changes significantly with season. Hence, seasonal variability is not solely driven by changes in air mass. Highest fractions of organic and ni-trate aerosol particles are observed for continental and ma-rine modified airmasses, organic and sulphate particles are dominant in marine airmasses, particularly during the winter campaign. Despite variability, the organic aerosol particles contribute a large fraction to the overall particle mass what-ever the air mass type (20 to 51 %) or season (23 to 50 %).
One of the conclusions of Lanz et al. (2010) was that the time of year and location of the sampling site could largely explain the variability in chemical composition for different campaigns and was found to be a better description of the aerosol composition than the type of site (rural vs. urban). Here we show that although the time of year has an important influence on the aerosol particle composition, the source of the airmasses still has significant effects on the submicron particle composition.
In earlier studies, the seasonal variability of aerosol prop-erties were shown to be linked to the frequency at which the pdD site was located in the PBL or FT/RL Venzac et al. (2009). The pdD site is mostly in the PBL during the day and FT/RL during the night time hours, particularly during the winter. Figure 6 shows the diurnal variability of the mass concentration of the inorganic and organic species during each campaign. Particle number concentration (Ntot)
mea-surements made at the site over several years show that in general the typical diurnal variability is characterized by an increase inNtotbetween 12:00 and 14:00 UTC (Venzac et al.,
2009). In this study we observe that the diurnal variability in
a) b)
c) d)
e) f)
Fig. 6.Diurnal variation of mass concentration of BC and inorganic and organic particles for autumn,(a)and(b), winter,(c)and(d), and summer,(e)and(f).
Ntotwas strongest during the autumn and winter, and
weak-est during the summer campaign (Table 1). AMS measure-ments show strongest diurnal variability in particle mass con-centrations during the winter (Fig. 6), when the pdD site is expected to spend the majority of the time in the free tropo-sphere and only be advected by boundary layer airmasses for several hours during the day. However, particle mass con-centrations show that the FT/RL (night time) aerosol com-position is only slightly different from that of the BL (day time).
During autumn and winter we observe increases in the mass concentration of all species during the day and de-creases at night. However, the relative contributions of all species do not change. For the summer campaign, mass con-centrations of Org and SO24−increase while those of NO3
decrease during the daytime hours (Fig. 6). These changes are presumably a result of photochemical secondary aerosol production of organics and sulphates during the day, rather than changes from BL to FT. Summer night time increases in NO3are likely related to the lower mass concentrations of
sulphate at night, allowing excess NH3to react with nitrate
a) b)
c) d)
Fig. 7.Difference inθ evs the CO/NOxratio during winter 2009. Plots are coloured by(a)SO4,(b)NO3,(c)LV-OOA, and(d)SV-OOA.
The chemical composition of aerosol particles were also examined relative to the age of the air masses. Since NOy
measurements were not available at the pdD site during these measurements, the ratio of CO/NOxwas used as a tracer for
major pollution sources and for photochemical processing. According to (Morgan et al., 2010), a value between 10 and 50 for the CO/NOxratio, is classified as near-source
condi-tions. During all measurement campaigns the CO/NOx
ra-tio range from 7 to greater than 400 with an average value of 93±43, confirming that most of the airmasses arriving at the pdD are representative of aged regional emissions. Plotting the fraction of SO4, NO3, LV-OOA, and SV-OOA
to the total aerosol mass concentration against the CO/NOx
ratio (Fig. S10), shows that LV-OOA is associated with aged air masses while highest nitrate concentrations favour low CO/NOxratios arising presumably from boundary layer
sources.
The age of the air masses are likely connected to the BL/FT segregation. Hence, on the basis of both thermody-namical and chemical indicators we used a combination of
θ emeasurements and gas-phase measurements to character-ize the properties of aerosol particles likely associated with BL/FT air masses. Plotting the difference inθ e(1θ e) against the CO/NOxratio, we observe that there is not a strong
lin-ear relationship betweenθ e and the CO/NOx ratio.
How-ever, lowest values ofθ eare related to low CO/NOx ratios
(Fig. 7) indicating that, overall, the thermodynamical indica-tor of BL/FT air masses,θ e, is coherent with the chemical aging indicator, CO/NOx. These plots suggest that
bound-ary layer air masses can be characterized by lowθ eand low
CO/NOxratios, whereas airmasses arriving from the free
tro-posphere or residual layer are characterized by highθ eand high CO/NOxratios (Fig. 7). If these plots are coloured by
particle composition, we observe that high concentrations of NO3and SV-OOA are most often related to airmasses mostly
associated to BL air, whereas highest concentrations of LV-OOA are related to air masses associated to residual layer or free tropospheric air.
4 Conclusions
previously found in Crete (Hildebrandt et al., 2010). Small changes in mass spectral properties between seasons as well as correlations with different gas and particle phase species suggest that there are different precursor sources contribut-ing to the formation of secondary organic aerosols durcontribut-ing different seasons of the year. From the analysis of the re-solved organic mass spectra we conclude that biomass burn-ing emissions contribute to the formation of secondary or-ganic aerosols during the winter and biogenic emissions con-tribute during the summer. Considering seasonal influences on the formation of SOA is important in modelling and quan-tifying organic mass concentrations in the atmosphere. These measurements show that through a combination of continu-ous aerosol particle measurements, we can understand the influence of different airmass sources (FT/BL) and transport directions on the aging and formation of the aerosol particle distribution, particularly the organic fraction.
Supplementary material related to this article is available online at:
http://www.atmos-chem-phys.net/11/13047/2011/ acp-11-13047-2011-supplement.pdf.
Acknowledgements. We thank Manjula Canagaratna for helpful
discussions. This work was performed in the framework of the Research Infrastructure Action under the FP6 Structuring the European Research Area Programme, EUSAAR Contract No. RII3-CT-2006-026140. The work has been partly funded by FP6 Integrated project EUCAARI, Contract no. 36833. E. J. Freney is funded by an AXA postdoctoral fellowship (ACI-AMS) and by a Marie-Curie international reintegration grant.
Edited by: V.-M. Kerminen
The publication of this article is financed by CNRS-INSU.
References
Alfarra, M. R., Prevot, A. S. H., Szidat, S., Sandradewi, J., Weimer, S., Lanz, V. A., Schreiber, D., Mohr, M., and Baltensperger, U.: Identification of the mass spectral signature of organic aerosols from wood burning emissions, Environ. Sci. Technol., 41, 5770– 5777, doi:10.1021/es062289b, 2007.
Allan, J. D., Delia, A., Coe, H., Bower, K., Alfarra, M., Jimenez, J., Middlebrook, A., Drewnick, F., Onasch, T., Canagaratna, M., Jayne, J., and Worsnop, D.: A generalised method for the extraction of chemically resolved mass spectra from aerodyne aerosol mass spectrometer data, J. Aerosol Sci., 35, 909–922, doi:10.1016/j.jaerosci.2004.02.007, 2004.
Bahreini, R., Keywood, M., Ng, N., Varutbangkul, V., Gao, S., Flagan, R., Seinfeld, J., Worsnop, D., and Jimenez, J.: Mea-surements of secondary organic aerosol from oxidation of cy-cloalkenes, terpenes, and m-xylene using an Aerodyne aerosol mass spectrometer, Environ. Sci. Technol., 39, 5674–5688, doi:10.1021/es048061a, 2005.
Bolton, D.: The computation of equivalent potential tempera-ture, Mon. Weather Rev., 108, 1046–1053, doi:10.1175/1520-0493(1980)108¡1046:TCOEPT¿2.0.CO;2, 1980.
Bourcier, L., Sellegri, K., Jaffrezo, J.-L., Aymoz, G., Michaud, V., and Laj, P.: Seasonal variation of aerosol chemistry at the puy de Dome station (1465 m.a.s.l), France, in preparation, 2012. Brooks, I.: Finding boundary layer top: Application of a
wavelet covariance transform to lidar backscatter profiles, J. Atmos. Ocean. Tech., 20, 1092–1105, doi:10.1175/1520-0426(2003)020¡1092:FBLTAO¿2.0.CO;2, 2003.
Cabada, J., Pandis, S., Subramanian, R., Robinson, A., Polidori, A., and Turpin, B.: Estimating the secondary organic aerosol contri-bution to PM2.5using the EC tracer method, Aerosol Sci. Tech-nol., 38, 140–155, doi:10.1080/02786820390229084, 2004. Canagaratna, M. R., Jayne, J. T., Jimenez, J. L., Allan, J. D.,
Al-farra, M. R., Zhang, Q., Onasch, T. B., Drewnick, F., Coe, H., Middlebrook, A., Delia, A., Williams, L. R., Trimborn, A. M., Northway, M. J., DeCarlo, P. F., Kolb, C. E., Davidovits, P., and Worsnop, D. R.: Chemical and microphysical characterization of ambient aerosols with the aerodyne aerosol mass spectrome-ter, Mass Spectrom. Rev., 26, 185–222, doi:10.1002/mas.20115, 2007.
DeCarlo, P. F., Dunlea, E. J., Kimmel, J. R., Aiken, A. C., Sueper, D., Crounse, J., Wennberg, P. O., Emmons, L., Shinozuka, Y., Clarke, A., Zhou, J., Tomlinson, J., Collins, D. R., Knapp, D., Weinheimer, A. J., Montzka, D. D., Campos, T., and Jimenez, J. L.: Fast airborne aerosol size and chemistry measurements above Mexico City and Central Mexico during the MILAGRO campaign, Atmos. Chem. Phys., 8, 4027–4048, doi:10.5194/acp-8-4027-2008, 2008.
Drewnick, F., Hings, S., DeCarlo, P., Jayne, J., Gonin, M., Fuhrer, K., Weimer, S., Jimenez, J., Demerjian, K., Bor-rmann, S., and Worsnop, D.: A new time-of-flight aerosol mass spectrometer (ToF-AMS) – Instrument description and first field deployment, Aerosol Sci. Technol., 39, 637–658, doi:10.1080/02786820500182040, 2005.
Gelencser, A., May, B., Simpson, D., Sanchez-Ochoa, A., Kasper-Giebl, A., Puxbaum, H., Caseiro, A., Pio, C., and Legrand, M.: Source apportionment of PM2.5 organic aerosol over Europe: Primary/secondary, natural/anthropogenic, and fos-sil/biogenic origin, J. Geophys. Res.-Atmos., 112, D23S04, doi:10.1029/2006JD008094, 2007.
Heringa, M. F., DeCarlo, P. F., Chirico, R., Tritscher, T., Dommen, J., Weingartner, E., Richter, R., Wehrle, G., Pr´evˆot, A. S. H., and Baltensperger, U.: Investigations of primary and secondary particulate matter of different wood combustion appliances with a high-resolution time-of-flight aerosol mass spectrometer, At-mos. Chem. Phys., 11, 5945–5957, doi:10.5194/acp-11-5945-2011, 2011.
the Finokalia Aerosol Measurement Experiment – 2008, Atmos. Chem. Phys., 10, 4167–4186, doi:10.5194/acp-10-4167-2010, 2010.
Hock, N., Schneider, J., Borrmann, S., R¨ompp, A., Moortgat, G., Franze, T., Schauer, C., P¨oschl, U., Plass-D¨ulmer, C., and Berresheim, H.: Rural continental aerosol properties and pro-cesses observed during the Hohenpeissenberg Aerosol Charac-terization Experiment (HAZE2002), Atmos. Chem. Phys., 8, 603–623, doi:10.5194/acp-8-603-2008, 2008.
Hueglin, C., Gehrig, R., Baltensperger, U., Gysel, M., Monn, C., and Vonmont, H.: Chemical characterisation of PM2.5, PM10 and coarse particles at urban, near-city and ru-ral sites in Switzerland, Atmos. Environ., 39, 637–651, doi:10.1016/j.atmosenv.2004.10.027, 2009.
Jimenez, J. L., Canagaratna, M. R., Donahue, N. M., Prevot, A. S. H., Zhang, Q., Kroll, J. H., DeCarlo, P. F., Allan, J. D., Coe, H., Ng, N. L., Aiken, A. C., Docherty, K. S., Ulbrich, I. M., Grieshop, A. P., Robinson, A. L., Duplissy, J., Smith, J. D., Wilson, K. R., Lanz, V. A., Hueglin, C., Sun, Y. L., Tian, J., Laaksonen, A., Raatikainen, T., Rautiainen, J., Vaattovaara, P., Ehn, M., Kulmala, M., Tomlinson, J. M., Collins, D. R., Cu-bison, M. J., Dunlea, E. J., Huffman, J. A., Onasch, T. B., Al-farra, M. R., Williams, P. I., Bower, K., Kondo, Y., Schnei-der, J., Drewnick, F., Borrmann, S., Weimer, S., Demerjian, K., Salcedo, D., Cottrell, L., Griffin, R., Takami, A., Miyoshi, T., Hatakeyama, S., Shimono, A., Sun, J. Y., Zhang, Y. M., Dzepina, K., Kimmel, J. R., Sueper, D., Jayne, J. T., Herndon, S. C., Trim-born, A. M., Williams, L. R., Wood, E. C., Middlebrook, A. M., Kolb, C. E., Baltensperger, U., and Worsnop, D. R.: Evolution of Organic Aerosols in the Atmosphere, Science, 326, 1525–1529, doi:10.1126/science.1180353, 2009.
Kasper, A. and Puxbaum, H.: Seasonal variation of SO2, HNO3, NH3 and selected aerosol components at Sonnblick (3106 m asl), Atmospheric environment, 32, 3925–3939, doi:10.1016/S1352-2310(97)00031-9, 1998.
Lanz, V. A., Alfarra, M. R., Baltensperger, U., Buchmann, B., Hueglin, C., and Pr´evˆot, A. S. H.: Source apportionment of submicron organic aerosols at an urban site by factor analyti-cal modelling of aerosol mass spectra, Atmos. Chem. Phys., 7, 1503–1522, doi:10.5194/acp-7-1503-2007, 2007.
Lanz, V. A., Alfarra, M. R., Baltensperger, U., Buchmann, B., Hueglin, C., Szidat, S., Wehrli, M. N., Wacker, L., Weimer, S., Caseiro, A., Puxbaum, H., and Prevot, A. S. H.: Source attribu-tion of submicron organic aerosols during wintertime inversions by advanced factor analysis of aerosol mass spectra, Environ. Sci. Technol., 42, 214–220, doi:10.1021/es0707207, 2008. Lanz, V. A., Pr´evˆot, A. S. H., Alfarra, M. R., Weimer, S., Mohr,
C., DeCarlo, P. F., Gianini, M. F. D., Hueglin, C., Schneider, J., Favez, O., D’Anna, B., George, C., and Baltensperger, U.: Char-acterization of aerosol chemical composition with aerosol mass spectrometry in Central Europe: an overview, Atmos. Chem. Phys., 10, 10453–10471, doi:10.5194/acp-10-10453-2010, 2010. Middlebrook, A., Bahreini, R., Jimenez, J., and Canagaratna, M. R.: Evaluation of Composition-Dependent Collection Efficiencies for the Aerodyne Aerosol Mass Spectrome-ter using Field Data, Aerosol Sci. Technol., 46, 258–271, doi:10.1080/02786826.2011.620041, 2012.
Morgan, W. T., Allan, J. D., Bower, K. N., Highwood, E. J., Liu, D., McMeeking, G. R., Northway, M. J., Williams, P. I., Krejci,
R., and Coe, H.: Airborne measurements of the spatial distribu-tion of aerosol chemical composidistribu-tion across Europe and evolu-tion of the organic fracevolu-tion, Atmos. Chem. Phys., 10, 4065–4083, doi:10.5194/acp-10-4065-2010, 2010.
Ng, N. L., Canagaratna, M. R., Jimenez, J. L., Zhang, Q., Ul-brich, I. M., and Worsnop, D. R.: Real-Time Methods for Esti-mating Organic Component Mass Concentrations from Aerosol Mass Spectrometer Data, Environ. Sci. Technol., 45, 910–916, doi:10.1021/es102951k, 2011.
Ng, N. L., Canagaratna, M. R., Zhang, Q., Jimenez, J. L., Tian, J., Ulbrich, I. M., Kroll, J. H., Docherty, K. S., Chhabra, P. S., Bahreini, R., Murphy, S. M., Seinfeld, J. H., Hildebrandt, L., Donahue, N. M., DeCarlo, P. F., Lanz, V. A., Pr´evˆot, A. S. H., Dinar, E., Rudich, Y., and Worsnop, D. R.: Organic aerosol components observed in Northern Hemispheric datasets from Aerosol Mass Spectrometry, Atmos. Chem. Phys., 10, 4625– 4641, doi:10.5194/acp-10-4625-2010, 2010.
Nyeki, S., Li, F., Weingartner, E., Streit, N., Colbeck, I., Gaggeler, H., and Baltensperger, U.: The background aerosol size distribu-tion in the free troposphere: An analysis of the annual cycle at a high-alpine site, J. Geophys. Res.-Atmos., 103, 31749–31761, doi:10.1029/1998JD200029, 1998.
Paatero, P.: Least squares formulation of robust non-negative factor analysis, Chemometrics and Intelligent Laboratory Systems, 37, 23–35, doi:10.1016/S0169-7439(96)00044-5, 1997.
Paatero, P. and Tapper, U.: Positive matrix factorization-A nonnegative factor model with optimal utilization of error-estimates of data values, Environmetrics, 5, 111–126, doi:10.1002/env.3170050203, 1994.
Puxbaum, H., Caseiro, A., Sanchez-Ochoa, A., Kasper-Giebl, A., Claeys, M., Gelencser, A., Legrand, M., Preunkert, S., and Pio, C.: Levoglucosan levels at background sites in Europe for assessing the impact of biomass combustion on the European aerosol background, J. Geophys. Res.-Atmos., 112, D23S05, doi:10.1029/2006JD008114, 2007.
Seinfeld, J. and Pandis, S.: Atmospheric Chemistry and Physics, from Air Pollution to Climate Change, J. Atmos. Chem., 37, 212–214, doi:10.1023/A:1006483708571, 1998.
Sellegri, K., Laj, P., Dupuy, R., Legrand, M., Preunkert, S., and Putaud, J.-P.: Size-dependent scavenging efficiencies of multi-component atmospheric aerosols in clouds, J. Geophys. Res.-Atmos., 108, 4334, doi:10.1029/2002JD002749, 2003.
Slowik, J. G., Stroud, C., Bottenheim, J. W., Brickell, P. C., Chang, R. Y.-W., Liggio, J., Makar, P. A., Martin, R. V., Moran, M. D., Shantz, N. C., Sjostedt, S. J., van Donkelaar, A., Vlasenko, A., Wiebe, H. A., Xia, A. G., Zhang, J., Leaitch, W. R., and Ab-batt, J. P. D.: Characterization of a large biogenic secondary or-ganic aerosol event from eastern Canadian forests, Atmos. Chem. Phys., 10, 2825–2845, doi:10.5194/acp-10-2825-2010, 2010. Ulbrich, I. M., Canagaratna, M. R., Zhang, Q., Worsnop, D. R., and
Jimenez, J. L.: Interpretation of organic components from Posi-tive Matrix Factorization of aerosol mass spectrometric data, At-mos. Chem. Phys., 9, 2891–2918, doi:10.5194/acp-9-2891-2009, 2009.
diurnal variation of aerosol size distributions (10< D <750 nm) at a high-alpine site (Jungfraujoch 3580 m asl), J. Geophys. Res.-Atmos., 104, 26809–26820, doi:10.1029/1999JD900170, 1999.