Working Paper Series
Assessing the Role of Social Networks on Migrant
Labor Market Outcomes:
Evidence from a Representative Immigrant Survey
__________________________________________
Cátia Batista
Nova School of Business and Economics - Universidade Nova de Lisboa CReAM, IZA and NOVAFRICA
Ana Isabel Costa
Nova School of Business and Economics - Universidade Nova de Lisboa NOVAFRICA
ISSN 2183-0843
NOVAFRICA Working Paper Series
NOVAFRICA | Nova School of Business and Economics|Faculdade de Economia | Universidade Nova de Lisboa Campus de Campolide | 1099-032 Lisboa – Portugal | T: (+351)213 801 673 | F: (+351) 213 801 105 | www.novafrica.org
Any opinions expressed here are those of the author(s) and not those of NOVAFRICA. Research published in this series may include views on policy, but the center itself takes no institutional policy positions.
NOVAFRICA is a knowledge center created by the Nova School of Business and Economics of the Nova University of Lisbon. Its mission is to produce distinctive expertise on business and economic development in Africa. A particular focus is on Portuguese-speaking Africa, i.e., Angola, Cape Verde, Guinea-Bissau, Mozambique, and Sao Tome and Principe. The Center aims to produce knowledge and disseminate it through research projects, publications, policy advice, seminars, conferences and other events.
Assessing the Role of Social Networks on Migrant Labor
Market Outcomes:
Evidence from a Representative Immigrant Survey
Cátia Batista
†and Ana Isabel Costa
‡April 2016
Abstract
What role do social networks play in determining migrant labor market outcomes? We examine this question using data from a random sample of 1500 immigrants living in Ireland. We propose a theoretical model formally predicting that immigrants with more contacts have additional access to job offers, and are therefore better able to become employed and choose higher paid jobs. Our empirical analysis confirms these findings, while focusing more generally on the relationship between migrants’ social networks and a variety of labor market outcomes (namely wages, employment, occupational choice and job security), contrary to the literature. We find evidence that having one more contact in the network is associated with an increase of 11pp in the probability of being employed and with an increase of about 100 euros in the average salary. However, our data is not suggestive of a network size effect on occupational choice and job security. Our findings are robust to sample selection and other endogeneity concerns.
JEL classification: D8, F22, J3
Keywords: Social Networks; International Migration; Wage Determination; Labor Market Integration
The authors are grateful for helpful suggestions from Ana Balcão Reis, Ana Garcia, Bien Balocating, Francesco
Cestari, Julia Seither, Matilde Grácio, Pedro Brinca, José Tavares, and Teresa Molina-Millán. This paper makes use of a representative immigrant survey generously funded by the EU NORFACE Programme on International Migration, under the lead of Principal Investigators Catia Batista and Gaia Narciso.
1 1. Introduction
The study of social networks emerged in the economics literature as a way to explain information mismatches and other market frictions. Early empirical studies show that about half of employed individuals rely on family and friends to find jobs or to have access to job information (Gregg and Wadsworth, 1996; Addison and Portugal, 2001). The main theoretical hypothesis linking social networks to labor market outcomes proposes the existence of an informal channel, usually formed by relatives, friends and acquaintances, that provides individuals information not available through formal sources. Such channel mitigates job search frictions in two distinct ways: by making available information to job seekers about employment opportunities, while also providing employers references about the workers.
In the recent decades, a growing literature has investigated the role of social networks on migrant outcomes. In one of its most prominent findings, migrants tend to cluster in groups and share information among them (see Edin et al, 2003 and Munshi, 2003), which illustrates the particular importance of social networks for migration. Being newcomers to the labor market, migrants are in need of information about job openings and the characteristics of the labor market, particularly upon arrival to the host country. On the other hand, networks may also be useful from the perspective of the employer who often lacks information about the newly arrived migrants.
2
therefore are more likely to be employed and to hold higher paid jobs. We also analyze other labor market outcomes such as occupational choice and job security (meaning the job stability offered by the type of job contract).
Our paper contributes to the previous literature by studying the role of migrant networks at various dimensions of labor market integration. We examine three main questions: (i) is the probability of being employed higher for individuals with more contacts; (ii) what is the causal effect of the network size on subsequent wages: do immigrants with larger networks have higher wages; (iii) is there a selection process with the choice of working among immigrants.
Identification of the causal effects of network size on migrant outcomes is complicated by the possibility of several endogeneity problems. First, the suspected causal relationship between the migrant network size and the respective labor market outcome can be simultaneously determined by unobservable characteristics. Second, endogeneity can also occur through a selection process that leads some immigrants to choose to participate in the labor market while others do not – which results in a sample selection problem in that it is not possible to observe the wages of those who do not work. In order to tackle these possible estimation biases, and to ensure the robustness of our results we estimate several distinct models: Linear Probability Model (LPM), Two-Stage Least Squares (2SLS), Heckit model and IV-Heckit model.
3
and employment. The impact of the network size on the occupation and job security are new findings to the literature.
The structure of the remainder of the paper is organized as follows. Section 2 reviews the main results found in the literature. Section 3 shows a theoretical framework to model the impact of the network size on the employment and wages of immigrants. Section 4 describes the methodology used and the identification issues. Section 5 presents the data used and the descriptive statistics. Finally, Section 6 includes the empirical results and section 7 concludes.
2. Literature Review
This section presents a systematic analysis of the previous findings on the topic and relates the past literature with our empirical strategy. We summarize the impact of social networks both on migration and on labor market outcomes.
As initially proposed by Sjaastad (1962) and Harris and Todaro (1970), migration is often an uncertain and risky investment. However, migration networks can lower the costs and uncertainty of follower migrants, as verified by McKenzie and Rapoport (2010). Umblijs (2012) presents theoretical and empirical evidence that if potential migrants have access to a network at the destination, more risk-averse migrants will migrate than if they had no access to these networks1.
Calvo-Armengol and Zenou (2005) were one of the first authors to put forward a theoretical model of the role of networks on labor market outcomes particularly wages and employment. The model accounts for a job-matching process, in which workers find jobs through their social network, and shows that in the steady-state, labor market outcomes are positively correlated across time and across agents within a network. Nonetheless, it assumes that networks are exogenous, a strong assumption that has not been validated by empirical research (a few examples include Munshi, 2003 and An, 2015).
1 For further evidence of the importance of social networks for migration, see: Beine et al. (2011), Batista and
4
Later, Wahba and Zenou (2005) extended the model of Calvo-Armengol and Zenou (2005) by differentiating between low- and high-educated individuals and comparing the efficiency of using networks to find a job with other search methods. The underlying assumption made by the authors is that low-educated individuals only use informal job search methods to find a job, while high-educated individuals use both formal and informal methods. Considering population density as a proxy for the size of the network in Egypt, they provide empirical evidence that conditional on being employed, the probability of finding a job through friends and relatives, compared to other search methods, is higher in denser areas than in less denser areas.
Given the importance of networks as an informal institution with consequences in the labor market, one would expect its effect to be stronger among migrants (relative to natives) as they are newcomers to the market. Munshi (2003) argues that both migrants and employers at the destination lack full access to information about each other, reason why they are in need of job referrals. Social networks have the role of decreasing the asymmetry of information between both agents. Using a sample of Mexican migrants in the US, the study finds that migrants with larger networks are more likely to be employed and hold higher paying jobs upon arrival. Also, Chen (2009) uses the proportion of labor migrants in the home village as an indicator of the village social network to study the effects of internal migration in China and finds that larger networks are associated with higher wages. Recently, Kerr and Mandorff (2015) provide evidence that immigrants in the US tend to cluster in the same occupations as immigrants from the same nationality. A result verified by Patel and Vella (2007) that find additional evidence of a wage premium for those immigrants who choose to work in the most popular occupations of their networks due to possible market power among these groups.
5
Long et. al (2013) find evidence of a wage penalty among those individuals who use networks to find jobs over other search methods. Their view rests on the assumption that workers who do not obtain better job offers through formal channels use networks to find jobs as a last resort. For that reason, network users will hold lower paid jobs compared to non-users.
In our paper, we will further explore the effects of networks in the labor market using a sample of international migrants living in Ireland. By controlling for a variety of individual characteristics, and addressing potential endogeneity problems, we are able to provide novel insight on this issue. Contrary to the existing literature, our main definition of networks is not only based on geographical proximity or place of origin. Our measure of networks includes non-migrants and migrants from the same country, but also from different countries. In spite of the great importance of migrant communities, it is plausible that they also share and are provided with information about the labor market by other residents. This approach is even more pertinent in the context of Ireland as migrants come from a variety of countries (including highly developed and developing economies), mostly work in high-skilled jobs and are, on average, highly educated2.
3. Theoretical Model
In order to frame our research, we propose an immigrant’s search behavior model, adapted from Patel and Vella (2007), to study the theoretical mechanisms linking networks to wages and employment.
Job search is made using formal and informal methods, where the latter refers to the individual network of employed friends and relatives. The model assumes a continuous time framework in which job offers can arrive from either formal or informal channels following a Poisson process and that immigrants, after arriving to a new country, seek to maximize the expected value of discounted future income using discount rate 𝑟. Individuals
6
(2)
(3) receive job offers through the formal channel with arrival rate 𝑝, and from the informal channel with arrival rate 𝑝𝑁. As long as the immigrant does not participate in the labor market, he receives compensation 𝑏, which can be interpreted as leisure or a different type of compensation. Wages offered through the formal channel are represented by 𝑤 and have distribution 𝐹(𝑤), while wages offered through the network channel are represented by
𝑤𝑁and have distribution 𝐹𝑁(𝑤𝑁). The model assumes that, as long as the migrant finds a job
with wage 𝑤 or 𝑤𝑁, he will keep it forever. The value of working in a job found through the formal channel and the informal channel is, 𝑊(𝑤) = 𝑤
𝑟 and 𝑊(𝑤𝑁) = 𝑤𝑁
𝑟 , respectively.
Thus, the flow value of being unemployed, 𝑟𝑈, is:
𝑟𝑈 = 𝑏 + 𝑝 ∫ 𝑚𝑎𝑥 [𝑊(𝑤) − 𝑈, 0]𝑑𝐹(𝑤) + 𝑝𝑁∫ max [𝑊(𝑤𝑁) − 𝑈, 0]𝑑𝐹𝑁(𝑤𝑁) (1) The first term on the right-hand side of the equation, 𝑏, stands for the instantaneous payoff of being unemployed, while the second and the third terms represent the expected value from being employed in a job found via the formal and network channels respectively. The decision of entering the labor market is made when the individual finds a job offer with wage realization 𝑤 or 𝑤𝑁 in which the value of being employed, (𝑤) or (𝑤𝑁) is higher than the value of not entering the labor market, U.
The larger the network size, the more job offers a given individual will receive through the informal channel. Assuming that the number of people in the network is given by 𝑛 and that the arrival job rate 𝑝 is constant among all individuals in the network, 𝑝𝑁is expressed by:
𝑝𝑁 = ∑ 𝑝𝑖 𝑖∈𝑛
= 𝑛𝑝
The individual will accept the job offer if 𝑤 is at least as large as the reservation wage, 𝑤𝑅. The reservation wage is solved by W(𝑤𝑅) = 𝑈. Noting that 𝑟𝑈 = 𝑤𝑅 and 𝑊 −
𝑈 = 𝑤−𝑤𝑅
𝑟 . Adding this to equation (1), one obtains the following simplified equation for the
7
(4)
(7)
𝑤𝑅 = 𝑏 + 𝑝 ∫ 𝑤 − 𝑤𝑟 𝑅 𝑤𝑅
𝑑𝐹(𝑤) + 𝑝𝑁∫ 𝑤𝑁− 𝑤𝑟 𝑅 𝑤𝑅
𝑑𝐹𝑁(𝑤𝑁)
Integrating (3) by parts, yields:
𝑤𝑅 = 𝑏 +1𝑟 𝑝 ∫ [1 − 𝐹(𝑤)] 𝑤𝑅
𝑑𝑤 + 1𝑟 𝑝𝑁∫ [1 − 𝐹𝑁(𝑤𝑁)] 𝑤𝑅
𝑑𝑤𝑁
Our model proposes two main testable implications. First, equation (2) shows that the arrival rate of job offers is positively correlated with the number of people in the network. This result is derived from the overall arrival rate of a job offer which can be expressed by
𝑃 = 𝑝 + 𝑝𝑁 and consequently,
𝜕𝑃
𝜕𝑛 = 𝑝 > 0 (5)
Proposition (5) should be positively correlated with the probability that a migrant finds employment, caeteris paribus.
The second testable implication of interest from our model is obtained by applying the implicit function theorem to equation (4), which yields
𝜕𝑤𝑅
𝜕𝑛 > 0 (6)
Expression (6) predicts that an increase in the network size will be associated with a higher reservation wage. As an individual receives more job offers, he will become more selective, increasing his reservation wage and therefore the accepted wage – a proposition that we will take to the data.
The theoretical model presented above provides a formal insight on the mechanics behind a positive impact of social networks on immigrants’ employment status and wages. These are the two main predictions we test and find empirical support for.
4. Econometric Framework and Identification Strategy
4.1. Linear Probability Model (LPM) estimation
8
(8) size can be expressed as:
𝑌𝑖 = 𝛼𝑖 + 𝛽1𝑁𝑖+ 𝛽2𝑋𝑖 + 𝜀𝑖
where 𝑌𝑖 is a binary variable that takes the values 0 or 1; 𝑁𝑖 stands for the individual network size; 𝑋𝑖 is a set of observable individual characteristics such as age, years of schooling, gender, years in Ireland, marital status or country of origin; and 𝜀𝑖 is the unobservable error term.
To identify our parameters of interest, we initially estimated (7) using a Linear Probability Model (LPM).3The main coefficient of interest, 𝛽1, produces consistent estimates conditional on the assumption that the error term is not correlated with the network size. However, such assumption is rather strong even after controlling for many observable characteristics. It is likely that unobservable characteristics may simultaneously determine the network size and the labor market outcome of a given individual. For instance, people with more contacts may have a better performance on the labor market not exclusively due to the fact that they have more access to information, but also because their unobserved ability is simultaneously correlated with the number of contacts they have and their professional achievements. The use of an Instrumental Variable (IV) approach may enable us to overcome this endogeneity problem and reestablish the consistency of the results.
4.3Instrumental Variable (IV) Estimates
The causal effect of the migrant network size on his/her subsequent labor market outcome can be obtained by performing an instrumental variable estimation. The estimation model is in this case given by (8):
𝑌𝑖 = 𝛼𝑖 + 𝛽1𝑁𝑖+ 𝛽2𝑋𝑖 + 𝜀𝑖
𝑁𝑖 = 𝜃𝑖+ 𝛾𝑆𝑖 + 𝜗𝑖
3 Note that we use the LPM when the outcome variable is the probability of being employed, of having a
9
where 𝑆𝑖 represents the instrument for the network size. Such instrumental variable must be strongly correlated with the network size, but not correlated with the error term.
Instrumental variables are widely used in the empirical literature on social networks to ensure estimation consistency. Several authors have used historical networks, proxied by the stock of immigrants a decade prior to the year of the study, as an IV (see, for example, Patel and Vella 2007; Cortes, 2008). As our data was collected in 2010, we employ the stock of immigrants in Ireland in 2000 for every country in sample to construct our instrument4. In
order to introduce individual variation and to correct for possible economic disparities between countries that may affect migration flows, we compute the instrumented size of the network for each migrant in the sample using the following expression:
𝑠𝑡𝑜𝑐𝑘 𝑔,2000∗𝐺𝐷𝑃𝑝𝑐 𝑃𝑃𝑃𝐺𝐷𝑃𝑝𝑐 𝑃𝑃𝑃𝑔,𝑡 𝐼𝑟𝑒𝑙𝑎𝑛𝑑,𝑡
where 𝑠𝑡𝑜𝑐𝑘 is the stock of immigrants in Ireland in the year 2000; 𝑔 stands for the immigrant’s country of birth; GDPpc PPP represents the per capita Gross Domestic Product in Purchasing Power Parities; and 𝑡 corresponds to the year of arrival in Ireland of immigrant
𝑖.5
We confirm in our data that the size of the individual’s network is correlated with the stock of immigrants, regardless of the fact that our main definition of networks includes migrants and non-migrants from a variety of countries, as long as they participate in the labor market. It is important to note that the majority of the individuals in the network are in fact immigrants coming from the same country (69.43%). The remainder comprises Irish-born individuals (16.46%) and migrants born in a different country than the respondent (14.11%).
4.3Heckit and IV-Heckit Models
Although the IV approach is useful to correct for the endogeneity problems described
4
Data for the stock of migrants was made available by the United Nation, Department of Economic and Social Affairs for the years 1990, 2000, 2010 and 2013.
5 This approach has also been widely used in the literature. See, for example, McKenzie and Rapaport (2010)
10
(9)
(10) before, it cannot deal with other sources of bias - namely that caused by sample selection. Indeed, when the dependent variable is the monthly wage, and given the fact that our sample includes individuals that were not working at the time the survey was conducted, sample selection bias may arise. Once a migrant arrived in the destination country he can choose whether to work or not. For instance, some migrants choose to stay at home with their family, while others are still pursuing their studies. If such decisions were randomly made, selection bias would not be a problem and we could proceed with the OLS and IV estimations. However, unobserved factors may be operating a selection mechanism: the decision of entering the labor market may be correlated with a certain type of omitted characteristics that also influence the performance of the migrant on the labor market. Thus, sample selection bias will lead to inconsistent estimations.
To overcome this problem, we estimate the sample selection correction procedure suggested by Heckman (1979), usually known as Heckit, that allows to not only test for sample selection bias, but also to obtain consistent estimates. Then, we further combine the Heckit and IV approaches to simultaneously deal with the two types of endogeneity described above. In what follows, we present the models used to estimate Heckit and IV-Heckit models.
A sample selection model is specified by two equations: an observation or regression equation and a selection equation. The first equation considers the mechanisms determining wages:
𝑤1 = 𝛼1𝑁1 + 𝒛1𝜹1+ 𝑢1 𝑜𝑏𝑠𝑒𝑟𝑣𝑒𝑑 𝑜𝑛𝑙𝑦 𝑖𝑓 𝑦2 = 1
where 𝑤1is a latent endogenous variable representing the monthly net wage; 𝑁1 stands for the network size and 𝜹1 is the vector of other explanatory variables such as age, gender, years in Ireland, years of schooling and marital status.
11
(11)
𝑦2 = {1 𝑖𝑓 𝑦2 ∗ > 0
0 𝑖𝑓 𝑦2∗ ≤ 0
𝑦2∗ = 𝜹2𝒙 + 𝑣2
where 𝜹2 represents the set of explanatory variable determining the decision of working6. Note that the selection equation (10) specifies that wages are only observed for those migrants whose market wage is greater than zero. That is, they are only considered to be working if their wage is above a threshold value. A zero value in the equation means that the market wage of migrants is greater than their reservation wage (w>w*).7
For the case of the endogeneity of the main explanatory variable, the IV-Heckit model, we introduce the reduced-form equation for the network size, 𝑁1, where 𝜹3 represents the instrument8:
𝑁1 = 𝒛𝜹3+ 𝑣3
Heckman (1979) developed a two-stage procedure that allows one to consistently estimate
𝜷1. In the first step, using all observations, i.e., the migrants for whom we observe wages or
not, a probit model is estimated representing the decision to work: (𝑦2𝑖 = 1|𝒙𝑖) = Φ(𝒙𝑖𝜹2). Then, based on the parameter estimated 𝛿̂2, the inverse Mills ratio for each observation is computed. The second step is to use the selected sample, i.e. working migrants, and fit an OLS regression for wages, including the inverse Mills ratio as an explanatory variable: 𝑦1 =
𝒙1𝜷1+ 𝛾1𝜆(𝒙𝛽̂2) + 𝜍𝑖. By including the Mills ratio, 𝜆(𝒙𝛽̂2), as an additional explanatory
variable we correct the sample selection problem. For this reason, if the inverted Mills is statistically significant, we can conclude for selectivity bias.
6 We acknowledge the fact that some working migrants did not report their wage. In our methodological
approach, we estimated the regressions including and excluding them from the sample and the significance of the main explanatory variable remained unchanged. For that reason, we present our results including the whole sample of immigrants.
7 The Heckit model assumes that: (i) (𝒙, 𝑦
2) are always observed; (iii) (𝑢1, 𝑣2) is independent of 𝒙with zero mean; (iii) 𝑢1 ~ 𝑁(0, 𝜎); (iv) 𝑣2 ~ 𝑁(0,1); (v) 𝑐𝑜𝑟𝑟(𝑢1, 𝑣2) = 𝜌; and (vi) 𝑢1and 𝑣2 are error terms of the two regression equations, assumed to be bivariate and normally distributed.
8 The IV-Heckit model incorporates both the assumptions mentioned before and the assumptions of the
12
In the case of the IV-Heckit, we follow the procedure as explained in Wooldridge (2002). In the first step, we estimate a probit model for the likelihood of the migrant working, whereas we include the exogenous explanatory variables, the exclusion restrictions and the instrument. This will give us estimates for 𝛿̂3; we then compute the inverse Mills ratio for each observation. In the second step, we use the selected subsample and estimate 𝑦1 =
𝒛1𝜹1+ 𝛼1𝑦2+ 𝛾1𝜆̂𝑖3+ 𝑒1 by 2SLS using instruments (𝒛, 𝜆̂𝑖3).
It is important to introduce exclusion restrictions to distinguish a sample selection from a misspecified model (Wooldridge 2002; Cameron and Trivedi 2005). They should have a high impact on the probability of the migrant entering the labor market but not be included in the outcome equation. Note that if we only had one exclusion restriction, in the case of the IV-Heckit model, predicted 𝑦2 would be nearly collinear with 𝒛1 and 𝜆̂𝑖3. For that reason, we include at least two exclusion restrictions in our estimation models. We use the household income not earned by the respondent and a dummy variable for whether the respondent has a child as the two determinant variables influencing the probability of the migrant entering the labor market.
5. Data: context, description and descriptive statistics
This section describes the dataset used and its main descriptive statistics.
5.1. Data Collection
The database employed in this study was collected in the greater Dublin area, between February 2010 and December 2011, as part of a larger experimental project on migration and information flows led by a team of researchers at Trinity College Dublin9. The data we use consists of the baseline survey conducted among 1500 eligible individuals, including detailed information of the respondents and their networks. To be part of the project, the respondent
13
had to fulfill the following requirements: 1) be 18 years old or older; 2) not Irish or British born10; 3) have arrived in Ireland between 2000 and six months prior to the interview date; and 4) not an Irish or British citizen. The random sampling procedure followed three steps: first, 100 Enumeration Areas (EA) were randomly selected out of the 323 Electoral Districts. Second, 15 households were chosen within each EA. Finally, if the household had more than one member eligible to take part in the survey, the individual respondent was randomly selected based on a next-birthday rule. Due to missing relevant information about eligibility for nine respondents, the final number of immigrants included in the sample is 1,491.
5.2. Defining Network Size
In order to estimate the effect of the network size on wages in the context of migration one first needs to define the network size for each immigrant. We follow (Patel and Vella, 2007) and include in the network the individuals that were working at the time the survey was conducted, and therefore were more able to provide inside information about the labor market11.
We use three different questions in the survey to cover all the contacts of the immigrants in Ireland. The first one concerns the composition of the household members of the respondent12: “Please indicate all the persons who belong to this household”. The second
question concerns the contacts who the respondent knew living in Ireland before he had
moved to the country: “Before coming to Ireland, how many people did you know who were
already living in Ireland (at the time you moved)”?13; The third question includes the contacts
living in Ireland whom, at the time of the survey, the migrant had most contact with:
10 As reported in Batista and Narciso (2013), “British citizens were excluded due to the close historical ties
between Ireland and Great Britain.”
11 We also tested network definitions including individuals that were not working. However, we obtained
weaker results, which suggests that labor market information is shared by those who are insiders in the labor market.
12 Household members are defined as those who usually sleep and eat in the same unit.
13 People belonging to the same household are excluded from this question. We decided to include these
14
“Currently, who are the people (excluding people you live with or people you knew before
coming to Ireland) that you have most contact with in Ireland?”. Using this information we
are able to observe the size of the representative network for each migrant.
5.3. Descriptive Statistics
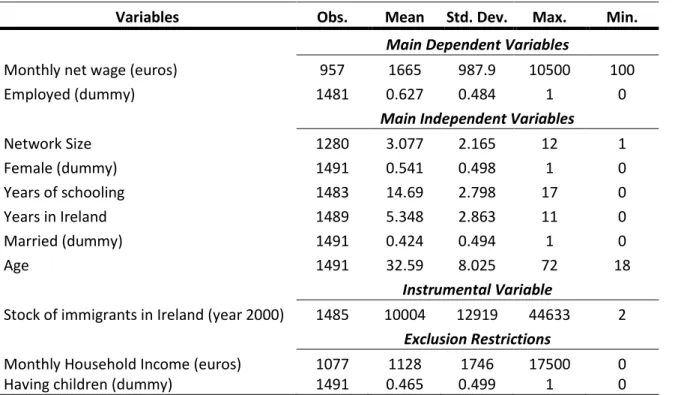
Table 1 includes the main descriptive statistics about the migrants’ characteristics. The first variable corresponds to the current monthly net wages expressed in euros. As we can observe, only 957 respondents reported a positive wage14. Our data indicates that around 63%
of the individuals reported to be working as their main occupation. The size of the migrant network is the explanatory variable of main interest. Network size is a discrete variable that assumes values between 1 and 12 in our data. The average number of people in the network is approximately three.
The sample is made up of a highly educated class of migrants who had, on average, 15 years of education, which roughly corresponds to a Bachelor’s degree. The average age is approximately 33 years old. The average number of immigrants per country is 10004. Finally, the average monthly household income, excluding the respondent’s, is 1128 euros and around 46.5% of the immigrants have a child.15
6. Results
6.1. Employment
The theoretical model proposed in section 3 predicts that the size of the network is positively correlated with the probability of the immigrant being employed. Table 2 presents the empirical analysis of this prediction. Employed is a binary variable that assumes value 1 if
14 Those individuals for whom we did not observe a positive wage have the following occupations: unpaid
housework, student, retired and unemployed or are not allowed to work due to visa issues.
15 The supplementary appendix includes Table A.1. which shows the distribution of foreign-born individuals in
15
the individual is employed and value 0 if otherwise16. We start by using the LPM to study the relationship between the employment status and our main variable of interest, network size17.
The results indicate that having one more person in the network is associated with an increase of 3 percentage points (pp) in the probability of being employed – an estimate significant at the 1% significance level. Moreover, females are less likely to be employed compared to males, as the gender coefficient is negative and highly significant. Being more educated is also positively correlated with employment, one more year of school increases the probability of being employed by 1.3 pp. Age and age squared are also strong determinants of the probability of being employed, although inversely related. As the immigrant gets older, he is less likely to be employed. Interestingly, the number of years since migration does not seem to influence the employment. The same holds true for marital status.
The results are robust once endogeneity concerns are accounted for. The network size effect becomes higher in magnitude suggesting that having one more contact in the network increases the probability of being employed by 11.3 pp and remains positive and significant at the 10% level. Our instrumental variable seems to be valid as it passes the weak identification test: the Cragg-Donald Wald F test presented in the end of the table is 12.249 implying a strong association between the stock of immigrants and the number of contacts in the network size.18
These empirical results therefore lend empirical support to the first testable implication of our theoretical model.
6.2. Wages
16 We consider as employed individuals who reported to be working as the main occupation.
17 Table A.4. of the supplementary appendix includes the Probit estimations whose sign, significance and
magnitude are similar to the LPM estimations.
18 Staiger and Stock (1997) indicate that, for the case of a single endogenous regressor, the instrument is strong
16
The second main prediction of our theoretical model is that individuals’ wages are a positive function of the size of the informal network. To empirically test this hypothesis, we employ three different models: OLS, Heckit and IV-Heckit.
The estimated coefficients and respective standard errors are presented in Table 4. Monthly wage appears in the logarithmic form given the skewness present in the variable (1.9318, a considerable right-hand skewness).
We begin our analysis by introducing the OLS estimation results (Column 1). Network size is statistically significant at the 5% level with a coefficient of 0.0260. That is, having one more person in the network size is associated with a 2.60 percent increase in wages. Individual’s gender does not seem to be correlated with the salary earned by the migrant. The coefficient is negative (suggesting that, on average, females tend to receive less than males), although it is not significant. Moreover, the number of years of schooling is positively correlated with the wages earned. One more year in school is associated with a 2.14 pp increase in wages, a result significant at the 10% level. The number of years in Ireland since migration, is also an important positive determinant of wages, indicative of the presence of a process of acquisition of human capital in the host country. Age and age squared are not correlated with wages in the OLS regression. Finally, married immigrants do not earn more on average compared with other marital status. In addition to the main individual characteristics explaining wages, namely gender, years of schooling, years in Ireland, marital status, age and continent fixed effects, we include further controls that may also potentially affecting wages, to increase the comparability of the different estimation models we use.
17
Table 4. The inverse Mills ratio representing the latent selection factor is negative and statistically significant, indicating that having a child and a higher household income is negatively correlated with the probability of entering the labor market. We can conclude that there is a selection bias on unobserved characteristics that turns the sample of those migrants for whom we observe wages different from the remaining ones. Considering that unobserved characteristics of the immigrants reflect their unobserved ability, the Heckit estimate of network effects reveals that column (1) overestimated the network effects of less able people who gain more from the informal channels. A brief reflection on why less able people take more advantage from their networks leads us to consider that lower earning-ability migrants may be relying more on their social network as they find it more difficult to acquire jobs through formal methods.
Comparing the OLS with the Heckit estimates, we can see that when we take into account selection in the decision of working on unobserved ability, the network effect is still significant at the 10% level and our main coefficient of interest is now 0.0196, lower than the OLS estimate. After correcting for sample selection, age and age squared become significant in opposite directions. While age is positively related with the migrants’ wages, age squared influences wages in a negative way. This implies a diminishing marginal effect of age, i.e., as the migrant gets older, the effect of age on wages lessens. This result is robust to the IV-Heckit model. All the other coefficient estimates remain similar to the OLS model.
18
network size. Our instrumental variable is significant and valid with a first-stage F value of 20.845.
IV-Heckit results are more robust when compared to the other two models, as it simultaneously deals with the two main sources of potential estimation biases in our empirical analysis. Nevertheless, the robustness of our main coefficient of interest in the three models provides clear evidence that the size of migrant social networks has a positive impact on labor market outcomes. Table A.3. of the supplementary appendix presents the first-stage regressions of the Heckit and IV-Heckit models.
6.3. Occupational Choice and Job Security
In addition to employment and wages, we also examine the impact of network size on other labor market outcomes, namely occupational choice and job security.
As mentioned in Patel and Vella (2007) and Kerr and Mandorff (2015), immigrants tend to choose the same occupations as immigrants from the same background, and therefore migrants belonging to the same network may enjoy a large market power in some given sectors of the economy. In our empirical analysis we test if having more contacts can influence individuals to choose a certain type of occupation. Tables 4 to 6 include the estimations of the immigrants’ main occupations. Our data rules out the hypothesis that having more contacts can influence migrants to choose a certain occupation over the other ones, as the significance of the results is not robust to endogeneity or to the inclusion of continent fixed effects in the regression. However, the results suggest some evidence of a possible effect related with low-skilled jobs (Table 4) for which the coefficients are significant if we not account for continent fixed effects and remains positive in four equations.
19
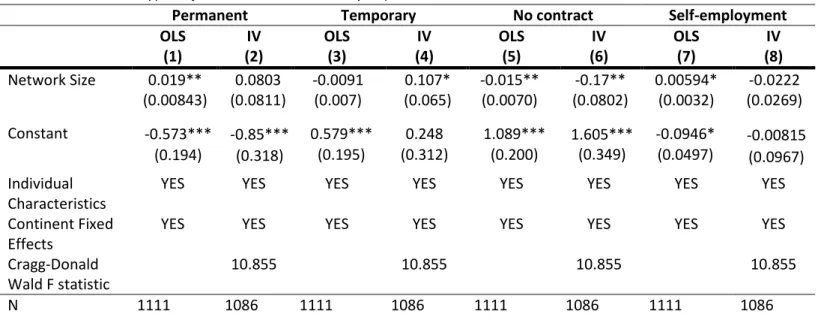
network size is larger. Table 7 presents the results for the different types of job contracts: permanent, temporary, no contract or even self-employment.
We find weak evidence that network size is correlated with permanent and temporary contracts or of being self-employed. Evidence is stronger for individuals who do not have any employment contract. Interestingly, networks seem to lead immigrants to other types of job situation rather than jobs with no contract as the coefficient is significant and negative. This is, having one more contact decreases the probability of having a job with no contract by 17 pp. For this reason, networks seem to play an important role in decreasing precarious work.
7. Concluding Remarks
This paper examined the impact of larger network sizes on immigrant’s wages, probability of being employed, occupational choice and job security. We find evidence that having one more contact in the host country’s labor market is associated with an increase of 11pp in the probability of being employed and with an increase of about 100 euros in the average salary. However, the evidence related to the impact of networks on job security and occupational choice is rather weak or non-existent. Expanding the previous findings in the literature that have been mainly focused on developing countries, this study concludes that networks are also important to migrants in developed countries. Information flows can play an important role for immigrants in a new labor market, a central conclusion for policy makers who wish to create better migration experiences.
20
individuals are in contact with more people who are employed, it is likely that they will have better information about opportunities in the job market. Although we are not able to disentangle such possible mechanisms in our paper, they provide an interesting topic for future research.
References
Addison John T., and Pedro Portugal. 2002. “Job Search Methods and Outcomes,” Oxford
Economic Papers 54, 505-533.
An, Weihua. 2015. “Instrumental Variables Estimates of Peer Effects in Social Networks”.
Social Science Research Volume 50. Pages 382–394.
Batista, Catia, and Gaia Narciso. 2013. “Migrant Remittances and Information Flows:
Evidence from a Field Experiment”, IZA Discussion Papers 7839.
Batista, Catia, and Janis Umblijs. 2014. “Migration, risk attitudes, and entrepreneurship:
Evidence from a representative immigrant survey”. IZA Journal of Migration, 3: 1-25.
Batista, Catia, and Janis Umblijs. 2016. “Do Migrants Send Remittances as a Way of
Insurance? Evidence from a Representative Immigrant Survey”, Oxford Economic Papers, 68 (1): 108-130.
Batista, Catia, and Pedro Vicente. 2011. “Do Migrants Improve Governance at Home?
Evidence from a Voting Experiment”. World Bank Economic Review, 25(1): 77-104.
Batista, Catia, Julia Seither, and Pedro C. Vicente, 2016. “Migration, Institutions and
Social Networks in Mozambique”, NOVAFRICA Working Paper.
Beine, Michel, Frédéric Docquier and Çağlar Özden (2011) “Dissecting Network Externalities in International Migration”, CESifo Working Paper: Labour Markets, No. 3333.
Calvo-Armengol, Antoni, and Yves Zenou. 2005. “Job Matching, Social Network and Word-of-Mouth Communication”, Journal of Urban Economics 57, 500 – 522.
Cameron, A. Colin, and Pravin K. Trivedi. 2005. Microeconometrics: Methods and Applications. Cambridge: Cambridge University Press.
Chen, Yunsong. 2014. “Do Networks Pay Off Among Internal Migrants in China?” Chinese
Social Review, Volume 45, Issue 1, pages 28-54.
Cortes, Patricia. 2008. "The Effects of Low Skilled Immigration on US prices: evidence from CPI data", Journal of Political Economy, vol. 116, n:3.
Datcher Loury. 2006. “Some Contacts Are More Equal than Others: Informal Networks, Job
21
Edin, P., P.Fredriksson, and P.Aslund. 2003. "Ethnic Enclaves and the Economic Success of Immigrants—Evidence From a Natural Experiment," Quarterly Journal of Economics, Vol. 118, No. 1, pp. 329—357.
Gregg, Paul, and Jonathan Wadsworth. 1996. “How Effective are State Employment
Agencies? Jobcentre Use and Job Matching in Britain”, Oxford Bulletin of Economics and
Statistics, 58, 443-457.
Harris, John, and Michael Todaro. 1970. “Migration, Unemployment and Development: A
two-sector analysis”, American Economic Review 60: 126–42.
Kerr, William, and Martin Mandorff. 2015. “Social Networks, Ethnicity, and
Entrepreneurship”, National Bureau of Economic Research, Working Paper n. 21597.
Long, Wenjin, Simon Appleton, and Lina Song. 2013. “Job Contact Networks and Wages
of Rural-Urban Migrants in China”, IZA Discussion Papers 7577, Institute for the Study of Labor.
McKenzie, David, and Hillel Rapoport. 2010. "Self-Selection Patterns in Mexico-U.S. Migration: The Role of Migration Networks," The Review of Economics and Statistics, MIT Press, vol. 92(4):811-821.
Munshi, Kaivan. 2003. “Networks in the Modern Economy: Mexican Migrants in the U.S.
Labor Market,” The Quarterly Journal of Economics, MIT Press, vol. 118(2), pages 549 -5999.
Patel, Krishna, and Francis Vella. 2007. “Immigrant Networks and Their Implications for
Occupational Choice and Wages” IZA Discussion Papers 3217, Institute for the Study of Labor (IZA).
Sjaastad, Larry. 1962. “The Costs and Returns of Human Migration”, Journal of Political
Economy 70:80.
Staiger, Douglas, and James H. Stock. 1997. “Instrumental Variables Regression with
Weak Instruments,” Econometrica, 65, 557–86.
Umblijs, Janis.2012. “The Effect of Networks and Risk Attitudes on the Dynamics of
Migration”, Oxford IMI Working Papers, 54/2012.
Wahba, Jackline and Yves Zenou. 2005. “Density, Social Networks and Job Search
Methods: Theory and Application to Egypt”, Journal of Development Economics, Volume 78,
Issue 2, Pages 443-473.
Heckman, James. 1979. “Sample Selection Bias as a Specification Error”, Econometrica,
22
Table 1. Selected Descriptive Statistics
Table 2: Employed as the binary dependent variable
Wooldridge, J. M. 2006. Introductory Econometrics. A Modern Approach. (Third Edition). Thomson South-Western. 24
Umblijs, Janis.2012. “The Effect of Networks and Risk Attitudes on the Dynamics of
Migration”, Oxford IMI Working Papers, 54/2012.
Appendix:
LPM (1)
IV (2)
Network Size 0.0288***
(0.00615)
0.113* (0.0665)
Female -0.0866***
(0.0257)
-0.0828*** (0.0277)
Years of Schooling 0.0133**
(0.00475)
0.0113* (0.00556)
Years in Ireland -0.000491
(0.00486)
-0.00630 (0.00669)
Age 0.0417***
(0.00942)
0.0433*** (0.0101)
Age^2 -0.000447***
(0.000126)
-0.000458*** (0.000135)
Married -0.0128
(0.0284)
-0.0526 (0.0425)
Constant -0.361**
(0.172)
-0.647** (0.262)
Continent Fixed Effects YES YES
Variables Obs. Mean Std. Dev. Max. Min.
Main Dependent Variables
Monthly net wage (euros) 957 1665 987.9 10500 100
Employed (dummy) 1481 0.627 0.484 1 0
Main Independent Variables
Network Size 1280 3.077 2.165 12 1
Female (dummy) 1491 0.541 0.498 1 0
Years of schooling 1483 14.69 2.798 17 0
Years in Ireland 1489 5.348 2.863 11 0
Married (dummy) 1491 0.424 0.494 1 0
Age 1491 32.59 8.025 72 18
Instrumental Variable
Stock of immigrants in Ireland (year 2000) 1485 10004 12919 44633 2
Exclusion Restrictions
Monthly Household Income (euros) 1077 1128 1746 17500 0
23
Cragg-Donald Wald F statistic 12.249
N 1272 1265
Standard errors clustered at the Enumeration Area level in parenthesis. *** p<0.01, ** p<0.05, * p<0.1. OLS
(1)
Heckit (2)
IV-Heckit (3)
Network Size 0.0260**
(0.0105)
0.0196* (0.0118)
0.0646** (0.0322)
Female -0.063
(0.0382)
-0.0413
(0.0483)
-0.0112
(0.0501)
Years of Schooling 0.0214**
(0.00991)
0.0184* (0.0104)
0.0176 (0.0114)
Years in Ireland 0.0269***
(0.00898)
0.0287*** (0.00956)
0.0281*** (0.0103)
Age 0.0222
(0.0172)
0.0536**
(0.0218)
0.0472**
(0.0220)
Age^2 -0.000268
(0.000228)
-0.000704** (0.000292)
-0.000636** (0.000294)
24
Table 3: Log monthly wage as the dependent variable
Table 5: Health sector occupation as the binary dependent variable
Table 4: Agriculture, Industry and Construction sectors as the binary dependent variable
Standard errors clustered at the Enumeration Area level in equation (1). *** p<0.01, ** p<0.05, * p<0.1. Other individual characteristics include religion and motive to migrate dummies. Labor market controls include the type of job contract and the first wage in Ireland.
Standard errors clustered at the Enumeration Area level in parenthesis. *** p<0.01, ** p<0.05, * p<0.1. Individual characteristics include gender dummy variable, years of schooling, years in Ireland, age, age squared and married dummy variable.
Standard errors clustered at the Enumeration Area level in parenthesis. *** p<0.01, ** p<0.05, * p<0.1. Individual characteristics include gender dummy variable, years of schooling, years in Ireland, age, age squared and married dummy variable.
(0.0489) (0.0528) (0.0534)
Constant 6.174***
(0.314)
5.699*** (0.430)
5.655*** (0.429)
Continent Fixed Effects YES YES YES
Other individuals characteristics YES YES YES
Labor Market Controls YES YES YES
Inverse Mills Ratio -0.350*
(0.212)
-0.587** (0.291)
Cragg-Donald Wald F statistic 20.845
N 791 715 569
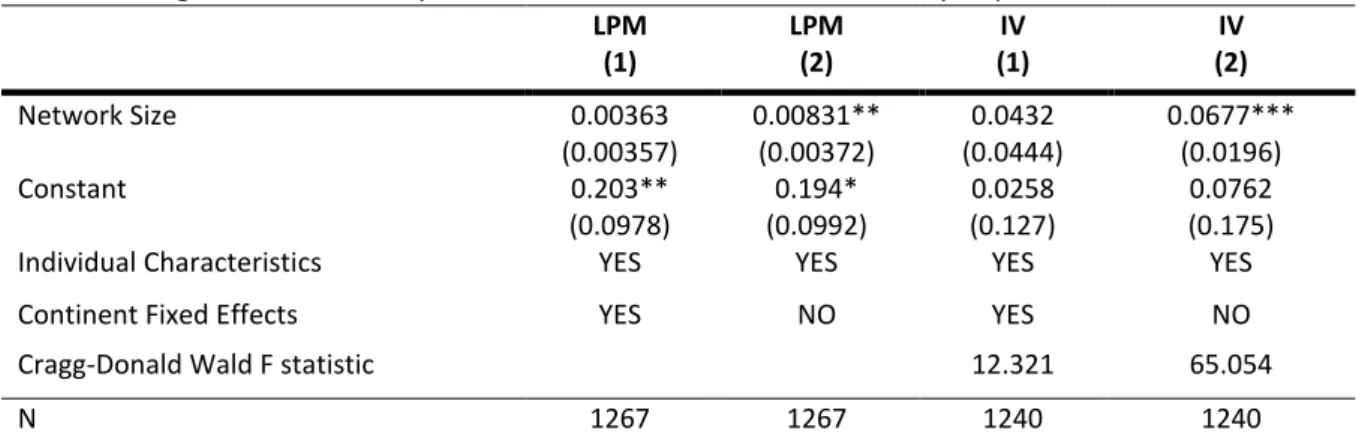
LPM (1) LPM (2) IV (1) IV (2)
Network Size 0.00363
(0.00357) 0.00831** (0.00372) 0.0432 (0.0444) 0.0677*** (0.0196)
Constant 0.203**
(0.0978) 0.194* (0.0992) 0.0258 (0.127) 0.0762 (0.175)
Individual Characteristics YES YES YES YES
Continent Fixed Effects YES NO YES NO
Cragg-Donald Wald F statistic 12.321 65.054
N 1267 1267 1240 1240
LPM (1) LPM (2) IV (1) IV (2)
Network Size 0.000109
(0.00508) -0.00658 (0.00514) 0.0353 (0.0308) -0.0725*** (0.0188)
Constant -0.560***
(0.114) -0.546*** (0.107) -0.406*** (0.127) -0.674*** (0.150)
Individual Characteristics YES YES YES YES
Continent Fixed Effects YES NO YES NO
Cragg-Donald Wald F statistic 12.321 65.054
25
Table 7: Type of job contract as the binary dependent variables
Table 6: IT sector as the binary dependent variable
Table A.1.: Distribution of foreign-born
individuals in the sample by continent
Table A.2.: Distribution of top-nationalities in
the sample OLS (1) OLS (2) IV (1) IV (2)
Network Size 0.00132
(0.00395) 0.00328 (0.00368) -0.0314 (0.0385) 0.0144 (0.0188)
Constant -0.0620
(0.0687) -0.0659 (0.0695) 0.0199 (0.115) -0.106 (0.0816)
Individual Characteristics YES YES YES YES
Continent Fixed Effects YES NO YES NO
Cragg-Donald Wald F statistic 12.321 65.054
N 1267 1267 1240 1240
Standard errors clustered at the Enumeration Area level in parenthesis. *** p<0.01, ** p<0.05, * p<0.1. Individual characteristics include gender dummy variable, years of schooling, years in Ireland, age, age squared and married dummy variable.
Permanent Temporary No contract Self-employment
OLS (1) IV (2) OLS (3) IV (4) OLS (5) IV (6) OLS (7) IV (8)
Network Size 0.019** (0.00843) 0.0803 (0.0811) -0.0091 (0.007) 0.107* (0.065) -0.015** (0.0070) -0.17** (0.0802) 0.00594* (0.0032) -0.0222 (0.0269)
Constant -0.573*** (0.194) -0.85*** (0.318) 0.579*** (0.195) 0.248 (0.312) 1.089*** (0.200) 1.605*** (0.349) -0.0946* (0.0497) -0.00815 (0.0967) Individual Characteristics
YES YES YES YES YES YES YES YES
Continent Fixed Effects
YES YES YES YES YES YES YES YES
Cragg-Donald Wald F statistic
10.855 10.855 10.855 10.855
N 1111 1086 1111 1086 1111 1086 1111 1086
Standard errors clustered at the Enumeration Area level in parenthesis. *** p<0.01, ** p<0.05, * p<0.1. Individual characteristics include gender dummy variable, years of schooling, years in Ireland, age, age squared and married dummy
Continent Frequency Percentage
Europe 655 43.93%
Africa 483 32.39%
Asia 247 16.57%
Oceania 72 4.83%
South America 26 1.74%
North America 8 0.54%
Total 1491 100%
Country of origin Frequency Percentage
Nigeria 291 19.52%
Poland 162 10.87%
India 91 6.10%
South Africa 72 4.83%
Romania 63 4.23%
Brazil 54 3.62%
Phillipines 46 3.09%
26
Table A.4.: Employment as the dependent variable
Table A.3.: Heckman and IV-Heckman’s first stage regressions
Standard errors clustered at the Enumeration Area in parenthesis. *** p<0.01, ** p<0.05, * p<0.1.
LPM (1)
Probit (2)
Network Size 0.0288***
(0.00615)
0.0319*** (0.00645)
Female -0.0866***
(0.0257)
-0.0892*** (0.0225)
Years of Schooling 0.0133**
(0.00475)
0.0125*** (0.004657)
Years in Ireland -0.000491
(0.00486)
-0.000143 (0.00484)
Age 0.0417*** 0.0380***
Heckman (1)
IV-Heckman (2)
Network Size 0.195***
(0.0473)
Female -0.181
(0.177)
-0.262 (0.166)
Years of Schooling 0.0928***
(0.0313)
0.0835*** (0.0295)
Years in Ireland -0.0251
(0.0321)
-0.0296 (0.0310)
Age 0.0409
(0.0699)
0.00756 (0.0670)
Age^2 -0.000326
(0.000896)
-0.000744 (0.000870)
Married 0.00214
(0.211) -0.0913 (0.195) Constant HH income Children Instrumental Variable -0.416 (1.277) -0.0000271 (0.0000545) -0.378 (0.246) -0.141 (1.222) 0.0000215 (0.0000203) -0.368 (0.235) -0.00000215 (0.0000203)
Continent Fixed Effects YES YES
Other individuals characteristics YES YES
Labor Market Controls YES YES
27
(0.00942) (0.00897)
Age^2 -0.000447***
(0.000126)
-0.000404*** (0.0001208)
Married -0.0128
(0.0284)
-0.0126 (0.0286)
Continent Fixed Effects YES YES
N 1272 1265