Working Paper Series
Migrant Remittances and Information Flows: Evidence
from a Field Experiment
Cátia Batista
Nova University of Lisbon, CReAM, IIIS, IZA and NOVAFRICA
Gaia Narciso
Trinity College Dublin, CReAM, fRDB and IIIS
ISSN 2183-0843
NOVAFRICA Working Paper Series
NOVAFRICA | Nova School of Business and Economics|Faculdade de Economia | Universidade Nova de Lisboa Campus de Campolide | 1099-032 Lisboa – Portugal | T: (+351)213 801 673 | F: (+351) 213 801 105 | www.novafrica.org
Any opinions expressed here are those of the author(s) and not those of NOVAFRICA.
Research published in this series may include views on policy, but the center itself
takes no institutional policy positions.
NOVAFRICA is a knowledge center created by the Nova School of Business and
Economics of the Nova University of Lisbon. Its mission is to produce distinctive
expertise on business and economic development in Africa. A particular focus is on
Portuguese-speaking Africa, i.e., Angola, Cape Verde, Guinea-Bissau, Mozambique,
and Sao Tome and Principe. The Center aims to produce knowledge and disseminate
it through research projects, publications, policy advice, seminars, conferences and
other events.
NOVAFRICA Working Papers often represent preliminary work and are circulated to
encourage discussion. Citation of such a paper should account for its provisional
Migrant Remittances and Information Flows:
Evidence from a Field Experiment
*Catia Batista† and Gaia Narciso‡
December 2013
Abstract
Do information flows matter for remittance behavior? We design and implement a randomized control trial to quantitatively assess the role of communication between migrants and their contacts abroad on the extent and value of remittance flows. In the experiment, a random sample of 1,500 migrants residing in Ireland was offered the possibility of contacting their networks outside the host country for free over a varying number of months. We find a sizable, positive impact of our intervention on the value of migrant remittances sent. Our results exclude that the remittance effect we identify is a simple substitution effect. Instead, our analysis points to this effect being a likely result of improved information via factors such as better migrant control over remittance use, enhanced trust in remittance channels due to experience sharing, or increased remittance recipients’ social pressure on migrants.
JEL Codes: F22; J61; O15.
Keywords: information flows; international migration; migrant networks; remittances; randomized control trial.
1. Introduction
Migrant remittances have grown substantially over the past decades, while
showing remarkable resilience in the face of recent economic crisis around the
world. The financial flows generated by international migrants are surpassing the
national public budget resources of some developing countries, as well as the
Foreign Direct Investment and Official Development Aid flows these countries
receive. It is therefore of great interest to learn more about the determinants and
consequences of such important international financial flows.1
One area of study crucial to understanding the determinants of migrant
remittances concerns the relationship between migrants and their transnational
networks, and how it affects migrant decisions to remit. Often, migrants are part of
a transnational household that was separated by considerable geographic distance
at the time of migration. Distance between migrants and their networks is likely to
bring several consequences that may affect this relationship. For instance, this
separation creates asymmetric information, in the sense that neither the migrant
nor the network can accurately observe each others’ actions. In particular, at most
times, the network outside the immigration country cannot accurately know the
migrant’s occupation, earnings, or standard of living, while migrants cannot
perfectly observe their networks’ true needs and uses of any financial transfers
received.
In this context, it becomes most relevant to examine the role of information
flows between migrants and their network outside the country of immigration in
determining migrant remittance behavior. One should note that the impact of
these information flows on migrant transfers is eminently an empirical question.
Indeed, one can conjecture about several possible mechanisms that could affect
remittances in different directions. First, communication flows should contribute
to an increase in the quantity and quality of information within transnational
3
households, thereby mitigating asymmetric information problems, which could
increase or decrease migrant remittances depending on the direction of earlier
informational deficiencies. Second, additional contact between migrants and their
networks may stimulate the demand for remittances on the recipients’ side, which
would cause upward pressure on remittances. Third, the increased communication
flows may lower the remittance costs and enhance trust in remittance channels due
to experience sharing, which would likely increase remittance flows. A fourth
mechanism could be that improved communication between migrants and their
networks could actually substitute for remittances, in the sense that contacts by
migrants may be interpreted as a form of attention and caring, a role that could
alternatively be performed by remittances – in this instance, improved
informational flows would have a negative impact on transfers sent by migrants.
In this paper, we examine the role of information flows between migrants and
their networks abroad in determining remittance behavior. To do so, we design a
randomized control trial under which we vary the magnitude of information flows
between migrants and their transnational networks, by distributing international
calling credit to a randomly selected treatment group. This field experiment is
conducted on a random sample of 1,500 immigrants residing in the greater Dublin
area in Ireland.
Our results show that the increased information flows that we generate
experimentally have a significant and substantial role in raising the value of
remittances sent to existing recipients. However, we find only modest support for
the hypothesis that increased contact with non-remittance recipients positively
affects the decision to remit to those individuals.
The role of information flows on remittance behavior has been previously
examined in the existing migration literature. McKenzie, Gibson and Stillman
(2013) describe survey evidence according to which migrants underreport their
earnings when they contact their family members in their country of origin, in
order to moderate their remittance requests and limit new immigrant arrivals. This
4
that increasing the quantity and quality of information exchanges between
migrants and their transnational networks increases the amount of remittance
flows.
There are several recent papers on remittance-related strategic behavior by
both migrants and their networks, when their relationship is characterized by
asymmetric information. Ashraf, Aycinena, Martinez, and Yang (2011) find, in a
randomized field experiment, that savings in migrant-origin households in El
Salvador rise when migrants (in the US) are given new financial products that
improve migrant control of savings in remittance-recipient households. Consistent
with this finding, Batista, Silverman, and Yang (2013) use a lab-in-the-field
experiment to show that urban individuals prefer to remit in kind (as opposed to in
cash) in ways that express their preference to control recipient use of their
transfers. Chen (2013) also finds evidence of non-cooperative behavior related to
the use of household resources in migrant households. Finally, Ambler (2013)
conducts a lab-in-the-field experiment confirming that remittance recipients use
resources differently when migrants can monitor this use. All of this work is
consistent with our finding that improving the quantity and quality of information
flows, and hence diminishing asymmetric information problems, should increase
remittance flows.
An additional strand of related literature emphasizes the importance of
transaction costs and trust in the remittance channel as determinants of remittance
flows. Aycinena, Martinez, and Yang (2012) conducted a Randomized Control Trial
(RCT) among Salvadorian migrants in the Washington D.C. area, showing that
lower remittance costs increased both the magnitude and frequency of remittance
flows, while Batista and Vicente (2013) also present experimental evidence, for
migrants in Mozambique, indicating that lower remittance costs, but also the
availability of a more trustworthy mobile banking remittance channel, increase the
magnitude and frequency of remittance flows. These results are also consistent
5
remittance costs and enhance trust in remittance channels, due to experience
sharing between migrants and their network.
Finally, the positive role of information flows on remittance behavior can also
be related to better integration of migrants in their networks at the origin country.
Chort, Gubert, and Senne (2012) and Batista and Umblijs (2013) emphasize how
remittances are used as a reciprocation or insurance mechanism, from which
migrants hope to benefit upon return to their home country. This idea is consistent
with our findings, in the sense that improved contact between migrants and their
networks at origin is likely to deepen migrants’ integration in these networks, a
mechanism that is complementary to remittances in this framework.2
In the remainder of the paper, Section 2 describes our experimental design and
the identification strategy. Section 3 presents the data collection procedure,
summary statistics, and a discussion of balance at baseline. Section 4 discusses the
econometric model and the empirical results. Section 5 concludes.
2. Experimental design and identification strategy
In order to quantitatively assess the role of communication flows in
determining the extent and value of remittance flows between migrants and their
contacts abroad, we implement a randomized field experiment, which consists of
distributing international calling credit to a randomly selected treatment group. The
international calling credit could be used to contact any number outside of Ireland,
either landline or mobile, with the objective of increasing the communication flows
between immigrants in Ireland and their family and friends outside of Ireland. The
cost of the international calling credit was about € 0.12 per minute and it was not
disclosed to the participants.3 However, the actual value of the calling credit to the
2 A related branch of literature examines the role of networks and information on migration behavior. Notable recent examples of this line of work are McKenzie and Rapoport (2007), Beine et al. (2011), Aker, Clemens, and Ksoll (2012), Umblijs (2012), Elsner, Narciso, and Thijssen (2013), Farre and Fasani (2013) and Beam, McKenzie and Yang (2013).
3
6
respondent could vary, depending on the destination country. For example, a phone
call from Ireland to South Africa could cost between €1.12 and €1.26 per minute
with the main Irish operator (Eircom), while the cost of a call to Poland was about
€0.39 per minute.4
Participants in the experiment were randomly assigned to one of three groups.
Respondents in Treatment group 1 received 90 minutes of free international calling credit every month, for five months. Migrants in Treatment group 2 received 90 minutes of free international calling credit for three months (every other month).
Finally, one-third of the participants were assigned to the Control group. Differences in the remittance behavior between the treated and control groups will allow for
identification of the intention-to-treat (ITT) effects of our intervention. Differences
between the two treatment groups would arise as a result of the treatment frequency.
Upon completion of the baseline survey, participants were contacted by
Computer-Assisted Telephone Interviewing (CATI) every month for a period of five
months. The aim of the short (about 15 minutes in duration) monthly surveys was to
gather information about remittance behavior, contacts with family and friends
outside of Ireland, and the main topics of conversation. The monthly top-up of the
international calling credit was also provided to the treatment group upon
completion of the short monthly survey.
About six to nine months after the fifth monthly survey, the final round of the
survey was conducted, with participants interviewed by CATI to elicit information
about remittance behavior. Figure 1 outlines the timeline adopted for the various
surveys and the intervention.
4
7
Figure 1: Timeline
t1 t2 t3 t4 t5 t6 t7
B aseline interview
D istribution of calling credit to treatment group
M onthly interviews
T op-‐up of international calling credit to treatment group
F inal interview
3.
Data collection and summary statistics3.1 Data collection
The data used in our analysis consist of a representative household sample of
1,500 immigrants5, aged 18 years or older, residing in the greater Dublin area, who arrived in Ireland between the year 2000 and six months prior to the interview date.
The baseline sample was collected between February 2010 and December 2011.
Survey activities were conducted by Amarach Research, a reputable survey
company with experience conducting research surveys in Ireland, under the close
supervision of the authors and their research team.
Eligibility requirements for survey respondents were set to maximize the
probability that migrants still kept contacts outside of Ireland (hence the 2000 initial
arrival threshold) but were already minimally established in Ireland (for at least six
months) so that contacts with their networks abroad could provide useful
8
information. Due to missing relevant information about eligibility for nine
respondents, the final sample size is 1,491.
Random sampling was performed in the following way. First, 100 Enumeration
Areas (EAs) were randomly selected out of the 323 Electoral Districts in the greater
Dublin area. This selection was performed according to
probability-proportional-to-size sampling, in which probability-proportional-to-size is defined as the total number of Irish and
non-British individuals residing in Ireland, according to the 2006 Census of Ireland.
Second, 15 households were selected within each EA using a random route
approach.6 Finally, in the presence of more than one eligible respondent in the household, the individual respondent was randomly selected based on a
next-birthday rule. In the absence of the designated respondent, an appointment was set
up for a later date. According to the enumeration records, on average, the
interviewers had to approach around 100 addresses to obtain one completed
interview.
All enumerators were initially trained by the research team and were
subsequently supervised by the survey company and, randomly, by members of the
research team. Each enumerator had to complete an enumeration report, listing
each address approached, the number of call-backs and the outcome of each visit.
The enumeration reports were closely inspected and verified by the research team. If
the randomization instructions were not followed, interviews had to be replaced.
9
3.2 Descriptive statistics
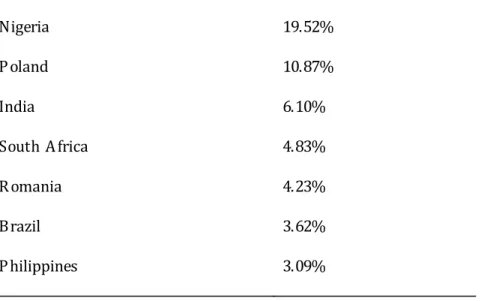
Table 1 presents the distribution of the top seven nationalities in our baseline
sample. Just over 19% of our sample is of Nigerian origin, while over 10% consists of
migrants of Polish nationality. In total, the sample covers 101 nationalities. Table A1
in the Appendix presents the full list of nationalities.
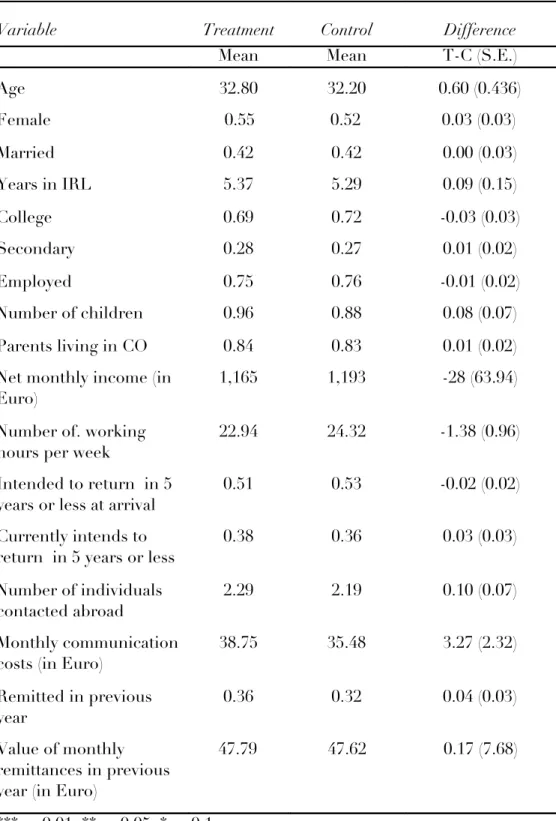
Table 2 presents the summary statistics for a set of basic demographic
characteristics of migrants for both treatment and control groups at baseline. The
average participant age is 32 and a slight majority of respondents is female. About
42% of the respondents are married and the average length of stay in Ireland is five
years. A large majority of respondents have parents living in the country of origin.
Survey participants report a high degree of education, with about 70% having a
post-secondary degree or higher, and 28% having a post-secondary school degree. About 75%
of the respondents in our sample are employed, compared to 51.4% of the overall
population in Ireland in 2011 (ILO). The net monthly income earned by surveyed
individuals is around €1,200 per month, with an average of 23 working hours per
week. About half of the respondents planned to return to their home country in five
years or less at the moment of arrival. However, when asked about their current
intentions to move away from Ireland, less than 40% of the respondents intended to
leave the host country in the following five years.
The baseline survey also provides extensive information regarding the
transnational network of migrants, namely the size of this network, the cost of
keeping in contact with it, whether remittances are sent and, if so, the amount
remitted. As shown at the bottom of Table 2, on average, respondents are in contact
with two people living outside of Ireland and the monthly cost of contacting the
network abroad is just below €40. About one-third of the participants in our sample
send remittances, with a monthly amount of remittances averaging around €47 (and
over €125 if we restrict to positive amounts only).
We do not find any evidence of statistically significant differences between
10
4. Estimation strategy
In order to estimate the effect on remittance behavior of increased information
flows between migrants and their network outside of the host country, we focus on
two main dependent variables - the probability of remitting (extensive margin) and
the value of monthly remittances (intensive margin). The design of the RCT and
multiple-round survey we conducted allows us to estimate the effect of the treatment
in two ways. First, we adopt a single difference approach by analyzing the
post-intervention data (rounds 2 to 7 of the survey) and we estimate the following
specification:
0 3
it =β +βTi + +ϑt +εit
Y X 'iδ (1)
where Yitis either an indicator variable taking the value 1 if the migrant remits and 0 otherwise, or the amount of monthly remittances sent by respondent i at time
t, where t is the time of the intervention period (round 2 to round 7 of the survey). Xi is a vector of individual baseline characteristics: age, employment status, marital
status, gender, number of individuals regularly contacted abroad, average monthly
cost of calling network abroad, post-secondary education, whether the parents of the
respondent are alive and live outside of Ireland, number of years in Ireland,
continent of origin, and enumeration area fixed effects. Finally, ϑt represents survey
round fixed effects.
Given the availability of pre-intervention data on outcome variables from the
baseline survey, we also use a difference-in-differences approach and estimate the
following specification:
0 1 2 3 *
it =β +βTi+β postt+βTi postt+ +ϑt +εit
Y X 'iδ (2)
where postt is an indicator variable that takes the value 1 for post-intervention
11
are defined as before. As a further robustness check, we estimate a
difference-in-differences specification with individual fixed effects (δi):
2 3 *
it =β postt+βTi postt+δi+ϑt +εit
Y (3)
where the impact of increased communication flows is captured by the β3
coefficient.
In both specifications, we are interested in identifying the intention-to-treat
effect, i.e. the impact of the treatment Ti on remittance behavior variable Yit, which is given by the coefficientβ3. Regular least squares estimates are used to estimateβ3.
Standard errors are always clustered at the enumeration area level.
5. Econometric results
5.1 Exogenous variation in communication flows
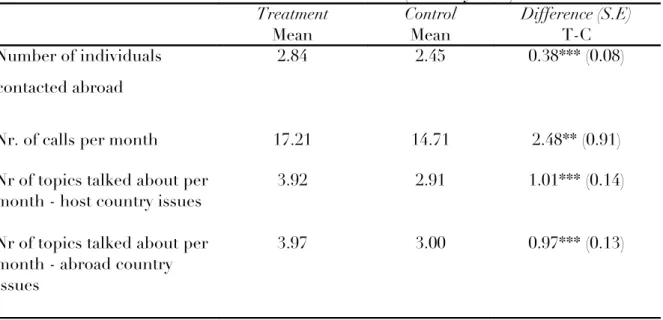
We begin the empirical analysis by showing that the experimental intervention
effectively increased communication flows between migrants and their network
abroad. Table 3 reports the impact of the treatment on the extent of the information
flows. The monthly CATI interviews reported information about the number of
individuals contacted abroad, number of calls made, and conversation topics the
migrant discussed with his/her transnational network in the month prior to the
interview.7 On average, respondents in the treatment group contact more people, make a greater number of calls and talk about a larger number of topics regarding
both Ireland and the country of residence of the contact person. Overall it seems
that the international calling credit was effective in increasing the communication
flows between migrants and their network abroad.
12
5.2 Effect on remittances
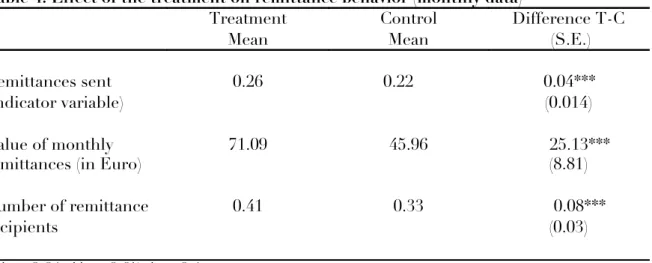
Table 4 shows differences in average remittance behavior between treatment
and control groups using the monthly follow-up survey data. The difference in
remittance behavior between groups is positive and statistically significant in
various dimensions: a 20% higher share of respondents in the treatment group
sends remittances, the value of remittances is more than 50% higher for treated
than for control migrants, and the number of remittance recipients is nearly 25%
larger.
We investigate further the relationship between increased communication
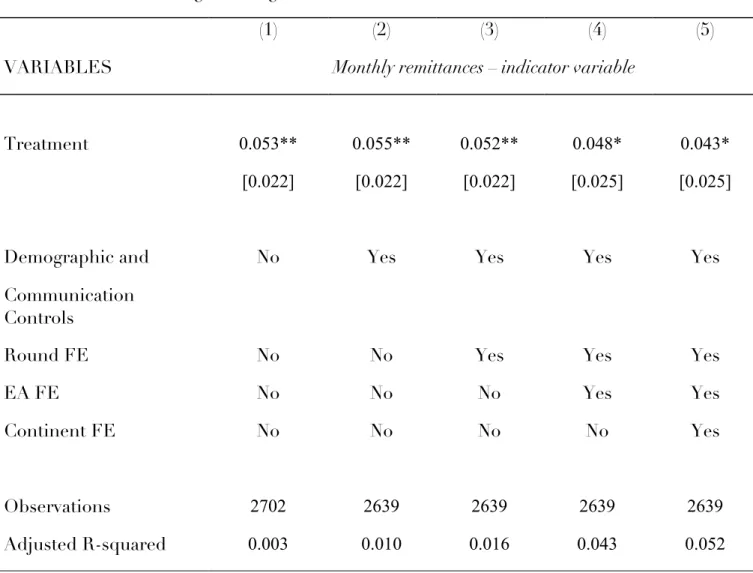
flows and remittances. Table 5 reports the results of the single difference
estimation of specification (1) for the extensive margin, i.e. the probability of
remitting, using a linear probability model. The dependent variable in this
specification is an indicator variable that takes the value 1 if the respondent sends
monthly remittances and 0 otherwise. We find that the treatment has a positive and
statistically significant impact on the probability of remitting; treated migrants are
5.3% more likely to remit than respondents in the control group – an effect that is
robust to the inclusion of demographic and communication controls, as well as
survey round fixed effects. The estimated coefficient is still statistically significant,
although only at a 10% level, when we introduce enumeration area fixed effects
(column 4) and continent of origin fixed effects (column 5).
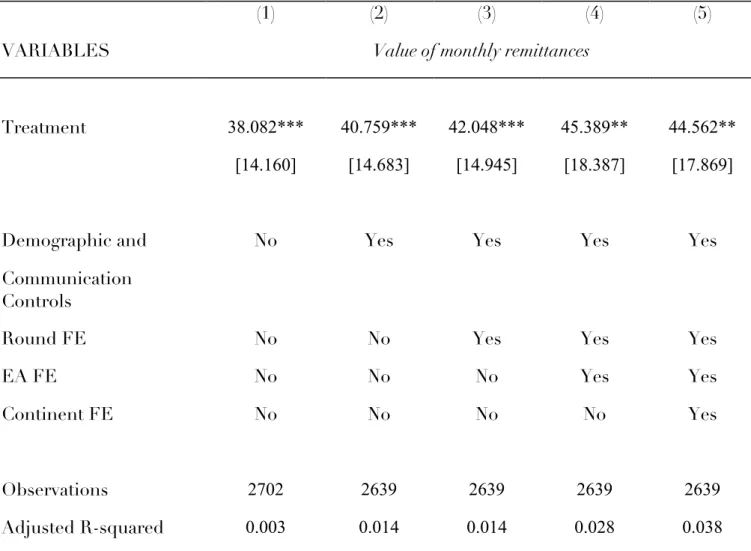
The strongest results in our analysis arise when we analyze the impact of the
increased communication flows on the value of monthly remittances. Column (1) of
Table 6 presents the effect that providing additional free calling credit to
individuals in the treatment group has on the value of monthly remittances. This
impact is positive and highly statistically significant; treated migrants increase the
amount of monthly remittances sent to their transnational network by about €40.
Adding demographic and communication controls in column (2) slightly increases
the magnitude of the treatment impact, without changing its statistical significance.
In columns (3)-(5) we progressively add survey round fixed effects (column 3),
13
(column 5). Treated migrants are still found to remit more than respondents in the
control group; the average treatment effect in the specification with all controls
and fixed effects included is about €45, as shown in column (5).
Overall, we conclude that the increased communication flows produce a
strong, significant increase in the amount of remittances sent (intensive margin)
and also a smaller increase in the probability of remitting (extensive margin).
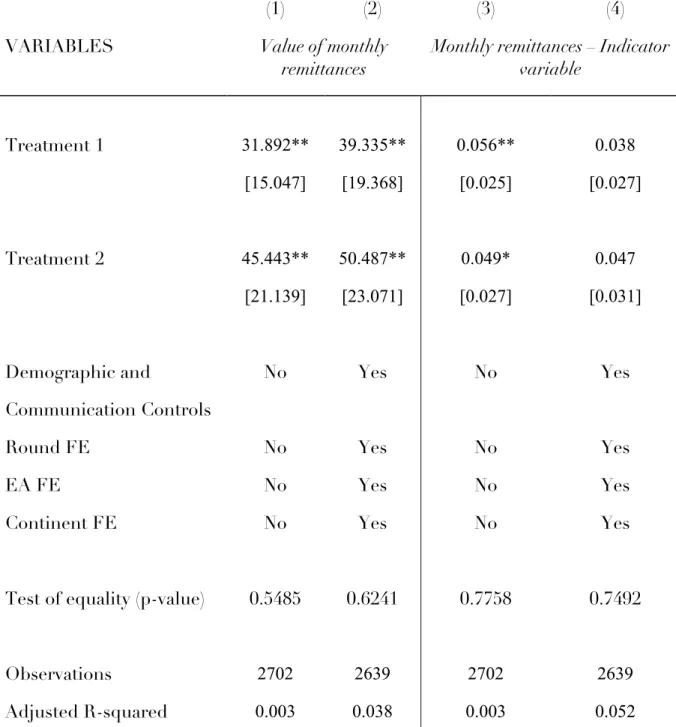
5.3 Two treatments
As described in Section 2, the two treatment groups in the experimental
intervention differ only in the frequency of the calling credit top-up. Migrants in
Treatment group 1 received a monthly calling credit top-up, for a total of five
months. Respondents in Treatment group 2 received a calling credit top-up every
other month, for a total of three times over five months.
Table 7 reports the results of the estimation of equation (1) differentiating
between the two treatments. Both treatments have a statistically significant impact
on the amount of remittances, with an estimated average treatment effect between
€32 and €39 for treatment 1 and between €45 and €50 for treatment 2, depending
on the specification.
Columns (3) and (4) report the impact of the two treatments on the probability
of remitting. The two treatments increase the probability of sending remittances,
although the effect is no longer significant once we add the control variables and
the set of fixed effects.
The lower panel of Table 7 reports the test of equality of the coefficients of
the two treatments; we cannot reject the null hypothesis that the two coefficients
are equal in any of the specifications, for either the intensive or the extensive
margin. We therefore conclude that there is no statistically significant difference
between the two treatments and proceed by evaluating the joint impact of the two
14
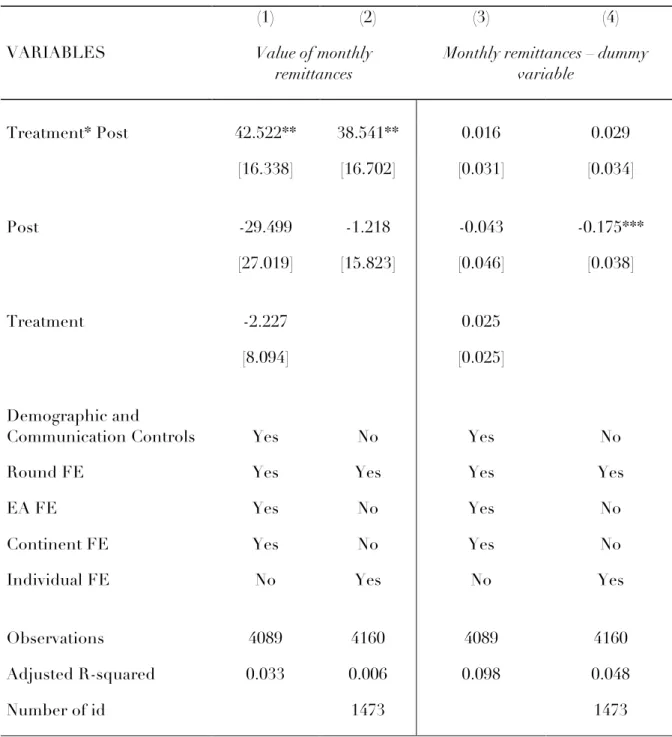
5.4 Difference-in-differences estimation
The analysis presented so far made use of the post-intervention data, i.e.
survey rounds 2 to 7. Using the baseline survey allows us to also adopt a
difference-in-differences estimation strategy. Column (1) of Table 8 reports the estimation
results for the specification detailed in equation (2). The estimated ITT effect (the
coefficient on the interaction between the treatment and the post-intervention
indicator) takes a positive and statistically significant value; treated migrants send
€43 more remittances than the control group. Column (2) presents the specification
outlined in equation (3), i.e. a difference-in-differences specification with
individual fixed effects, in addition to the survey round fixed effects already
included in column (1). The estimated coefficient of interest keeps a similar
positive magnitude with statistical significance at the 5% significance level.
Columns (3) and (4) replicate the analysis for the extensive margin. We do not find
any statistically significant impact of the treatment on the probability of remitting.
We summarize by stating that the treatment had a strong effect on the
intensive margin, while its impact on the extensive margin appears less robust. In
the next section, we analyze some of the possible mechanisms at play.
6. Robustness checks
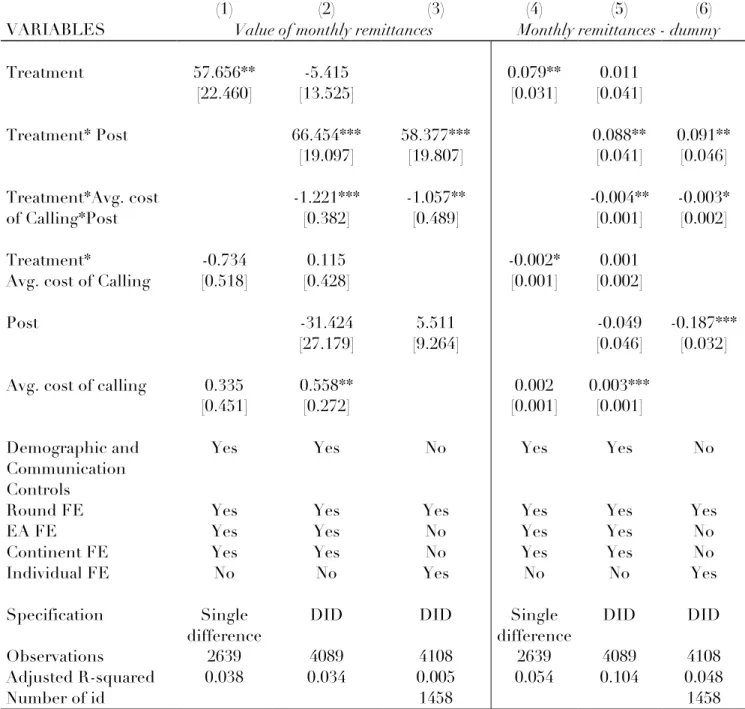
6.1. Is it just a substitution effect?
Are migrants simply substituting the decreased costs of calling with
remittances? In order to tackle this potential alternative explanation of our findings,
we make use of the baseline information on the average monthly cost of calling.
Column (1) in Table 9 reports a single-difference specification similar to equation (1),
which now also includes the interaction between the treatment indicator and the
monthly average cost of calling.8 The results hold when we control for this interaction term: treated migrants are found to remit more than migrants in the
15
control group and the estimated coefficient is still statistically significant at the 5%
level, while the interaction term between the treatment and the communication costs
is not statistically significant. Columns (2) and (3) present the results of the
difference-in-differences estimation with the interaction terms with the
communication costs, with and without individual fixed effects (columns 2 and 3
respectively). Besides the positive impact of the treatment on the value of monthly
remittances, it is worth noting that the triple interaction term between the treatment,
the average communication costs and the after intervention indicator is negative and
statistically significant at the 1% level. The greater the communication costs between
migrants and their network abroad, the lower the impact of the treatment on the
value of monthly remittances. This result holds again when we control for individual
fixed effects in column (3). We can therefore refute a substitution effect between the
decreased costs of communication elicited by the experiment and remittance
behavior.
A similar pattern emerges in the analysis of the impact of the treatment on the
extensive margin. Treated migrants are about 8% more likely to remit, once we
control for the interaction between the treatment and the average cost of calling, as
can be seen in column (4). The estimated coefficient is positive and statistically
significant at the 5% level. This result also holds when we consider the
difference-in-differences analysis and we control for individual fixed effects.
6.2 Interpretation of the findings
The increased communication flows might improve migrant’s control over
remittance use and enhance trust in remittance channels due to experience sharing.
If this were the case, we would expect treated migrants who are regularly employed
and who have higher income to send more remittances – the assumption being that
these individuals are more likely to have the financial liquidity to send more
remittances should they wish to do so. The next two tables test this hypothesis and
16
indicator (Table 10) and, as a further robustness check, the interaction between
income and the treatment indicator (Table 11).
The estimation results confirm the hypothesis: treated migrants who are
employed tend to remit more, while no effect is found on the probability of
remitting. A similar result emerges when we consider the interaction with the
income variable. The larger the earned income, the larger the increase in the amount
of money remitted by treated migrants. Again, no effect is found on the probability
of remitting.
6.3 Follow up surveys and attrition
Migrants are mobile by definition and given the length of the project,9 selective attrition could be a cause of concern. Respondents in the treatment group
received international calling credit at the end of the baseline survey and upon
completion of short phone surveys. We therefore anticipated a higher dropout rate
in the control group relative to the treatment group.10 A higher dropout rate in the control group is indeed confirmed by the attrition analysis presented in Table 12.
About 50% of the respondents in Treatment group 1 dropped out, compared to
51% of Treatment group 2 and 56% of the control group. The difference in the
dropout rates between Treatment group 1 and the control group is statistically
significant for each round of the survey. However, the difference in dropout rates
between Treatment group 2 and the control group is only (marginally) statistically
different in the last round.
To exclude the possibility of selective attrition, we evaluate the difference
between treatment and control dropouts relative to the set of observable variables
presented in the descriptive statistics. We focus on the participants who dropped
out after the first round of the survey. The results of this analysis are presented in
9 More than one year went by between the first baseline and last follow-up interviews.
17
Table 13. We find no evidence of selective attrition, as the difference between the
control group and each of the treatment groups is never statistically significant,
apart from one (marginal) instance. These results are reassuring in terms of the
validity of the analysis.
7. Concluding Remarks
Our results show that improving communication flows between migrants and
their networks abroad may promote more migrant remittances. In particular, we
identify a significant positive increase in the value of remittances sent (which nearly
doubles relative to baseline) as a result of experimentally subsidizing communication
between migrants and their networks outside of the immigration country. However,
we however find only a relatively small (about 25% relative to baseline) increase in
the probability of migrants in our sample sending remittances to a larger number of
individuals in their network.
Even though our research design did not explicitly test for the mechanisms
underlying this finding, our analysis shows that we can confidently exclude that the
remittance effect we identify is a simple substitution effect, whereby those with
higher subsidized communication costs increase their remittance flows by more.
Indeed, we find that larger remittance responses are associated with individuals
who are employed and earn higher incomes. This evidence is consistent with the
idea that the observed increase in remittances is not a consequence of relaxed
budget constraints due to subsidized communication costs, but rather a likely
result of improved information - perhaps due to better migrant control over
remittance use, enhanced trust in remittance channels due to experience sharing,
or increased remittance recipients’ social pressure on migrants. While additional
research is necessary to distinguish the different mechanisms potentially at play,
we believe this paper achieves an important first step in showing in a rigorous
experimental way, that information flows do play a role in determining migrant
18
The findings of our work highlight the importance of investment in technology
that increases the reach and efficiency of communication flows. In addition to other
beneficial effects already documented in the literature, such an investment may be
valuable to developing countries with substantial emigration stocks, as there may be
19
References
Aker, Jenny C., Michael A. Clemens, and Christopher Ksoll, 2012. “Mobiles and Mobility: The Effect of Mobile Phones on Migration,” mimeo, Tufts University.
Ambler, Catherine, 2012. “Don’t Tell on Me: Experimental Evidence of
Asymmetric Information in Transnational Households,” mimeo, University of Michigan.
Ashraf, Nava, Diego Aycinena, Claudia Martinez, and Dean Yang, 2011.
“Remittances and the Problem of Control: A Field Experiment Among Migrants from El Salvador”, mimeo, University of Michigan.
Aycinena, Diego, Claudia Martinez, and Dean Yang, 2012. “The Impact of
Remittance Fees on Remittance Flows: Evidence from a Field Experiment Among Salvadoran Migrants”, mimeo, University of Michigan.
Batista, Catia, and Janis Umblijs, 2013. “Do Migrants Send Remittances as a Way of Insurance? Evidence from a Representative Immigrant Survey”, NORFACE Working Paper.
Batista, Catia, and Pedro C. Vicente, 2013. “Introducing Mobile Money in Rural Mozambique: Evidence from a Field Experiment”, NOVAFRICA Working Paper 1/2013.
Batista, Catia, Daniel Silverman, and Dean Yang, 2013. “Directed Giving: Evidence from an Inter-Household Transfer Experiment in Mozambique”, CREAM Working Paper 21/2013.
Beam, Emily, David McKenzie, and Dean Yang, 2013. “Unilateral Facilitation Does Not Raise International Labor Migration from the Philippines”, CREAM Working Paper 19/2013.
20
Chen, Joyce, 2013. “Identifying Non-Cooperative Behavior Among Spouses: Child Outcomes in Migrant-Sending Households,” Journal of Development Economics, 100(1): 1-18.
Chort, Isabelle, Flore Gubert, and Jean Senne, 2012. “Migrant networks as a basis for social control: Remittance incentives among Senegalese in France and Italy”, Regional Science and Urban Economics, 42(5): 858-874.
Elsner, Benjamin, Gaia Narciso, and Jacco Thijssen, 2013. “Migrant Networks and the Spread of Misinformation”, mimeo, Trinity College Dublin.
Farre, Lidia, and Francesco Fasani, 2013. “Media Exposure and Internal Migration: Evidence from Indonesia”, Journal of Development Economics, 102: 48–61.
McKenzie, David, John Gibson, and Steven Stillman, 2013. “A Land of Milk and Honey with Streets Paved with Gold: Do Emigrants have Over-optimistic
Expectations about Incomes Abroad?”, Journal of Development Economics, 102: 116-127.
McKenzie, David, and Hillel Rapoport, 2007. “Network effects and the dynamics of migration and inequality: Theory and evidence from Mexico”, Journal of Development Economics, 84(1): 1-24.
Umblijs, Janis, 2012. “The Effect of Networks and Risk Attitudes on the Dynamics of Migration”, Oxford IMI Working Papers, 54/2012.
Table 1: C ountry of birth of foreign-‐born individuals in sample.
Nigeria 19.52%
P oland 10.87%
India 6.10%
South A frica 4.83%
R omania 4.23%
Brazil 3.62%
P hilippines 3.09%
Table 2: Characteristics of respondents
Variable Treatment Control Difference
Mean Mean T-C (S.E.)
Age 32.80 32.20 0.60 (0.436)
Female 0.55 0.52 0.03 (0.03)
Married 0.42 0.42 0.00 (0.03)
Years in IRL 5.37 5.29 0.09 (0.15)
College 0.69 0.72 -0.03 (0.03)
Secondary 0.28 0.27 0.01 (0.02)
Employed 0.75 0.76 -0.01 (0.02)
Number of children 0.96 0.88 0.08 (0.07)
Parents living in CO 0.84 0.83 0.01 (0.02)
Net monthly income (in Euro)
1,165 1,193 -28 (63.94)
Number of. working hours per week
22.94 24.32 -1.38 (0.96)
Intended to return in 5 years or less at arrival
0.51 0.53 -0.02 (0.02)
Currently intends to return in 5 years or less
0.38 0.36 0.03 (0.03)
Number of individuals contacted abroad
2.29 2.19 0.10 (0.07)
Monthly communication costs (in Euro)
38.75 35.48 3.27 (2.32)
Remitted in previous year
0.36 0.32 0.04 (0.03)
Value of monthly remittances in previous year (in Euro)
47.79 47.62 0.17 (7.68)
*** p<0.01, ** p<0.05, * p<0.1.
Table 3: Effect of treatment on communication flows (monthly data)
Treatment Control Difference (S.E)
Mean Mean T-C
Number of individuals
contacted abroad
2.84 2.45 0.38*** (0.08)
Nr. of calls per month 17.21 14.71 2.48** (0.91)
Nr of topics talked about per month - host country issues
3.92 2.91 1.01*** (0.14)
Nr of topics talked about per month - abroad country issues
3.97 3.00 0.97*** (0.13)
*** p<0.01, ** p<0.05, * p<0.1.
Table 4: Effect of the treatment on remittance behavior (monthly data)
Treatment Control Difference T-C
Mean Mean (S.E.)
Remittances sent 0.26 0.22 0.04***
(indicator variable) (0.014)
Value of monthly remittances (in Euro)
71.09 45.96 25.13***
(8.81)
Number of remittance 0.41 0.33 0.08***
recipients (0.03)
*** p<0.01, ** p<0.05, * p<0.1.
Table 5: Extensive margin – Single difference
(1) (2) (3) (4) (5)
VARIABLES Monthly remittances – indicator variable
Treatment 0.053** 0.055** 0.052** 0.048* 0.043*
[0.022] [0.022] [0.022] [0.025] [0.025]
Demographic and No Yes Yes Yes Yes
Communication Controls
Round FE No No Yes Yes Yes
EA FE No No No Yes Yes
Continent FE No No No No Yes
Observations 2702 2639 2639 2639 2639
Adjusted R-squared 0.003 0.010 0.016 0.043 0.052
*** p<0.01, ** p<0.05, * p<0.1. Demographic and communication controls include employment status, age, post-secondary degree or college dummy, whether parents are alive and live abroad, gender, number of contacts abroad, average monthly cost of calling, length of stay in Ireland. Standard errors are clustered at the enumeration area level.
Table 6: Intensive margin – Single difference
(1) (2) (3) (4) (5)
VARIABLES Value of monthly remittances
Treatment 38.082*** 40.759*** 42.048*** 45.389** 44.562**
[14.160] [14.683] [14.945] [18.387] [17.869]
Demographic and No Yes Yes Yes Yes
Communication Controls
Round FE No No Yes Yes Yes
EA FE No No No Yes Yes
Continent FE No No No No Yes
Observations 2702 2639 2639 2639 2639
Adjusted R-squared 0.003 0.014 0.014 0.028 0.038
*** p<0.01, ** p<0.05, * p<0.1. Demographic and communication controls include employment status, age, post-secondary degree or college dummy, whether parents are alive and live abroad, gender, number of contacts abroad, average monthly cost of calling, length of stay in Ireland. Standard errors are clustered at the enumeration area level.
Table 7: Treatment 1 vs. Treatment 2
(1) (2) (3) (4)
VARIABLES Value of monthly
remittances
Monthly remittances – Indicator variable
Treatment 1 31.892** 39.335** 0.056** 0.038
[15.047] [19.368] [0.025] [0.027]
Treatment 2 45.443** 50.487** 0.049* 0.047
[21.139] [23.071] [0.027] [0.031]
Demographic and No Yes No Yes
Communication Controls
Round FE No Yes No Yes
EA FE No Yes No Yes
Continent FE No Yes No Yes
Test of equality (p-value) 0.5485 0.6241 0.7758 0.7492
Observations 2702 2639 2702 2639
Adjusted R-squared 0.003 0.038 0.003 0.052
*** p<0.01, ** p<0.05, * p<0.1. Demographic and communication controls include employment status, age, post-secondary degree or college dummy, whether parents are alive and live abroad, gender, number of contacts abroad, average monthly cost of calling, length of stay in Ireland. Standard errors are clustered at the enumeration area level.
Table 8: Difference-in-differences
(1) (2) (3) (4)
VARIABLES Value of monthly
remittances
Monthly remittances – dummy variable
Treatment* Post 42.522** 38.541** 0.016 0.029
[16.338] [16.702] [0.031] [0.034]
Post -29.499 -1.218 -0.043 -0.175***
[27.019] [15.823] [0.046] [0.038]
Treatment -2.227 0.025
[8.094] [0.025]
Demographic and
Communication Controls Yes No Yes No
Round FE Yes Yes Yes Yes
EA FE Yes No Yes No
Continent FE Yes No Yes No
Individual FE No Yes No Yes
Observations 4089 4160 4089 4160
Adjusted R-squared 0.033 0.006 0.098 0.048
Number of id 1473 1473
*** p<0.01, ** p<0.05, * p<0.1. Demographic and communication controls include employment status, age, post-secondary degree or college dummy, whether parents are alive and live abroad, gender, number of contacts abroad, average monthly cost of calling, length of stay in Ireland. Standard errors are clustered at the enumeration area level.
Table 9: Cost of calling
(1) (2) (3) (4) (5) (6)
VARIABLES Value of monthly remittances Monthly remittances - dummy
Treatment 57.656** -5.415 0.079** 0.011
[22.460] [13.525] [0.031] [0.041]
Treatment* Post 66.454*** 58.377*** 0.088** 0.091**
[19.097] [19.807] [0.041] [0.046]
Treatment*Avg. cost -1.221*** -1.057** -0.004** -0.003*
of Calling*Post [0.382] [0.489] [0.001] [0.002]
Treatment* -0.734 0.115 -0.002* 0.001
Avg. cost of Calling [0.518] [0.428] [0.001] [0.002]
Post -31.424 5.511 -0.049 -0.187***
[27.179] [9.264] [0.046] [0.032]
Avg. cost of calling 0.335 0.558** 0.002 0.003***
[0.451] [0.272] [0.001] [0.001]
Demographic and Yes Yes No Yes Yes No
Communication Controls
Round FE Yes Yes Yes Yes Yes Yes
EA FE Yes Yes No Yes Yes No
Continent FE Yes Yes No Yes Yes No
Individual FE No No Yes No No Yes
Specification Single
difference
DID DID Single
difference
DID DID
Observations 2639 4089 4108 2639 4089 4108
Adjusted R-squared 0.038 0.034 0.005 0.054 0.104 0.048
Number of id 1458 1458
*** p<0.01, ** p<0.05, * p<0.1. Demographic and communication controls include employment status, age, post-secondary degree or college dummy, whether parents are alive and live abroad, gender, number of contacts abroad, length of stay in Ireland. Standard errors are clustered at the enumeration area level.
Table 10: Interaction with Employed dummy
(1) (2) (3) (4) (5) (6)
VARIABLES Value of monthly remittances Monthly remittances - Indicator
Treatment*Employed 54.413*** 57.024*** -0.034 -0.037
*Post [20.105] [21.670] [0.043] [0.056]
Treatment*Post 2.357 -5.430 0.042 0.059
[12.648] [13.438] [0.045] [0.054]
Treatment*Employed 36.761 -13.736 -0.015 0.004
[26.655] [16.272] [0.047] [0.043]
Treatment 16.827 7.872 0.054 0.023
[16.801] [13.700] [0.044] [0.042]
Employed 11.042 14.772 0.067 0.075**
[20.040] [13.976] [0.044] [0.031]
Post -29.538 5.511 -0.043 -0.187***
[27.105] [9.264] [0.046] [0.032]
Specification Single
difference
DID DID Single
difference
DID DID
Demographic and Communication
Controls Yes Yes No Yes Yes No
Round FE Yes Yes Yes Yes Yes Yes
EA FE Yes Yes No Yes Yes No
Continent FE Yes Yes No Yes Yes No
Individual FE No No Yes No No Yes
Observations 2639 4089 4160 2639 4089 4160
Adjusted R-squared 0.038 0.034 0.005 0.052 0.098 0.043
Number of individuals 1473 1473
*** p<0.01, ** p<0.05, * p<0.1. Demographic and communication controls include
Table 11: Interaction with Income
(1) (2) (3) (4) (5) (6)
VARIABLES Value of monthly remittances Monthly remittances - Indicator
Treatment*Income 0.035* 0.036* -0.000 -0.000
*Post [0.019] [0.019] [0.000] [0.000]
Treatment*Post -1.807 -9.567 0.015 0.026
[15.442] [16.857] [0.040] [0.047]
Treatment*Income 0.041** 0.001 0.000 0.000
[0.018] [0.007] [0.000] [0.000]
Treatment -8.274 -3.847 0.013 0.021
[18.593] [12.075] [0.038] [0.037]
Income -0.003 0.003 -0.000 0.000 -0.003
[0.008] [0.007] [0.000] [0.000] [0.008]
Post -14.237 5.477 -0.187***
-0.198***
[16.738] [9.817] [0.036] [0.033]
Specification Single
difference
DID DID Single
difference
DID DID
Demographic and Communication
Controls Yes Yes No Yes Yes No
Round FE Yes Yes Yes Yes Yes Yes
EA FE Yes Yes No Yes Yes No
Continent FE Yes Yes No Yes Yes No
Individual FE No No Yes No No Yes
Observations 2445 3771 3829 2445 3771 3829
Adj. R-squared 0.040 0.036 0.006 0.058 0.109 0.052
Number of individuals
1343 1343
Table 12: Attrition
Control Treatment 1 Difference to
Treatment 1 Treatment 2
Difference to Treatment 2 Mean
Dropout – 3 rounds 0.56 0.51 0.05*
(0.03)
0.51 0.05
(0.03)
Dropout – 4 rounds 0.67 0.60 0.07**
(0.030)
0.63 0.04
(0.03)
Dropout – 5 rounds 0.74 0.65 0.09***
(0.03)
0.71 0.03
(0.03)
Dropout – 6 rounds 0.78 0.70 0.08***
(0.03)
0.75 0.02
(0.03)
Dropout – 7 rounds 0.89 0.82 0.07
(0.02)***
0.85 0.04
(0.02)*
*** p<0.01, ** p<0.05, * p<0.1.
Table 13: Analysis of the dropouts
Variable Control Treatment 1 Difference to Treatment 1 Treatment 2 Difference to Treatment 2
Mean
Age 32.35 32.40 -0.04
(0.70)
33.27 -0.92
(0.71)
Female 0.54 0.58 -0.04
(0.04)
0.52 0.02
(0.04)
Married 0.37 0.40 -0.02
(0.04)
0.43 -0.05
(0.04)
Years in IRL 5.27 5.39 -0.12
(0.24)
5.47 -0.20
(0.25)
College 0.70 0.68 0.02
(0.04)
0.67 0.03
(0.04)
Secondary 0.28 0.29 -0.01
(0.04)
0.29 -0.01
(0.04)
Employed 0.77 0.75 0.02
(0.04)
0.76 0.00
(0.04)
Nr. Children 0.83 0.95 -0.12
(0.11)
0.85 -0.03
(0.10)
Parents living in CO
0.80 0.83 -0.03
(0.03)
0.86 -0.06*
(0.03)
Monthly Net Income
1,237.21 1,172.48 64.73
(100.96)
1,227.738 9.48
(104.56)
Nr working hours
25.18 23.63 1.55
(1.52)
23.98 1.20
(1.59)
Intentions to stay for less than 5 years – at arrival
0.53 0.51 0.02
(0.04)
0.49 0.04
(0.04)
Current intention to return – in 5 years or less
0.39 0.39 -0.00
(0.04)
0.38 0.01
(0.04)