Modelling innovation performance of
European regions using multi-output neural
networks
Petr Hajek1*, Roberto Henriques2
1Institute of System Engineering and Informatics, Faculty of Economics and Administration, University of Pardubice, Studentska´ 84, Pardubice, Czech Republic,2ISEGI, Universidade Nova de Lisboa, Lisboa, Portugal
*petr.hajek@upce.cz
Abstract
Regional innovation performance is an important indicator for decision-making regarding the implementation of policies intended to support innovation. However, patterns in regional innovation structures are becoming increasingly diverse, complex and nonlinear. To address these issues, this study aims to develop a model based on a multi-output neural network. Both intra- and inter-regional determinants of innovation performance are empiri-cally investigated using data from the 4thand 5thCommunity Innovation Surveys of NUTS 2 (Nomenclature of Territorial Units for Statistics) regions. The results suggest that specific innovation strategies must be developed based on the current state of input attributes in the region. Thus, it is possible to develop appropriate strategies and targeted interventions to improve regional innovation performance. We demonstrate that support of entrepreneurship is an effective instrument of innovation policy. We also provide empirical support that both business and government R&D activity have a sigmoidal effect, implying that the most effec-tive R&D support should be directed to regions with below-average and average R&D activ-ity. We further show that the multi-output neural network outperforms traditional statistical and machine learning regression models. In general, therefore, it seems that the proposed model can effectively reflect both the multiple-output nature of innovation performance and the interdependency of the output attributes.
Introduction
Innovation has been recognized as a central issue in EU development and one of the crucial drivers of economic welfare, especially since the introduction of the Lisbon strategy. Regions in the EU are important since they profit from spatial proximity and knowledge spillovers. Thus, effective formal and informal cooperation among regional actors (both within compa-nies as well as between firms and other organizations such as universities, innovation centers, educational institutions, etc.) can be established. According to [1], cooperation is considered as an innovation stimulus providing benefits such as achieving economies of scale and of
a1111111111 a1111111111 a1111111111 a1111111111 a1111111111
OPEN ACCESS
Citation:Hajek P, Henriques R (2017) Modelling innovation performance of European regions using multi-output neural networks. PLoS ONE 12(10): e0185755.https://doi.org/10.1371/journal. pone.0185755
Editor:Marı´a Carmen Dı´az Rolda´n, Universidad de Castilla-La Mancha, SPAIN
Received:April 18, 2017
Accepted:September 19, 2017
Published:October 2, 2017
Copyright:©2017 Hajek, Henriques. This is an open access article distributed under the terms of theCreative Commons Attribution License, which permits unrestricted use, distribution, and reproduction in any medium, provided the original author and source are credited.
scope, reducing uncertainty, gaining access to new markets or accessing complementary knowledge. These interactions may lead to the emergence of a regional innovation system (RIS) [2].
Recently, this concept of the RIS has received increased attention from both policy-makers and academic researchers, expanding our understanding of the innovation process in the regional dimension [3,4]. The RIS literature defines a region as “a territory less than its sover-eign state, possessing distinctive supra-local administrative, cultural, political, or economic power, differentiating it from its state and other regions” [2]. Doloreux [5] defines an RIS as a set of interacting private and public interests, formal institutions and other organizations that function according to organizational and institutional arrangements and relationships condu-cive to the generation, use and dissemination of knowledge. In RISs, intensive communication and cooperation between different actors, such as firms and other organizations (e.g., educa-tional and research institutions), takes place [6].
The research to date has tended to focus on firm-level innovation performance [7–12]. Region-specific characteristics have been used only as the determinants of firm innovation performance in this previous research, without considering the effect of research and innova-tion policies on the innovainnova-tion performance of the whole region. Moreover, the regional level is also considered critical for the design and implementation of innovation policies, as regions create appropriate contexts for knowledge creation and transfer [4]. In fact, European research and innovation policies are carried out at the level of regions, rather than at the level of the Member states. An effective research and innovation policy therefore requires modelling inno-vation performance at the regional level.
Regional (and national) innovation performance is annually measured in the EU using the innovation scoreboard, which captures almost thirty innovation indicators classified into vari-ous innovation dimensions [13]. Previous studies have suggested that regional innovation per-formance cannot be reliably measured using a single indicator. On the contrary, its
measurement rather requires a combination of strongly related indicators [3,4], including, among others, the numbers of innovators and the economic effects of innovation activity. However, no previous research known to us has used the multiple-output character of regional innovation performance to examine its determinants. Here, we fill this gap, developing a multi-input multi-output model that also accounts for nonlinear input-output effects. More-over, the linear models of innovation process (‘‘market pull” or ‘‘technology push” models) were insufficient to induce the transfer of knowledge and technology [14]. Therefore, nonlin-ear models of innovation have been introduced to take interactive and recursive terms into account. Nonlinear models, such as artificial neural networks (ANNs) [15] or adaptive neuro-fuzzy inference systems [16], have shown promising results in modeling the innovation pat-terns of firms embedded in regional innovation structures. For the case of Taiwanese firms’ innovation performance, Wang and Chien [15] demonstrated the dominance of ANN models over traditional statistical regression models regarding accuracy. ANNs have also been reported to accurately predict the technology implementation performance of firms [17] and R&D performance of European countries [18]. Additionally, ANNs preserve the experimental knowledge, enable their further use, and are robust to noise (irrelevant data, outliers, etc.). In this study, we argue that multi-output ANN model is more appropriate to model intrinsic multi-output and nonlinear character of innovation performance than traditional statistical and machine learning regression models. Specifically, the previously applied regression models were based on the assumption that the innovation data is best presented linearly. However, recent empirical evidence suggests that the relationships between innovation performance and its determinants are more complex than considered previously, including sigmoidal and inverted U-turned effects of R&D expenditures and cooperation, respectively [9]. Moreover,
interactions in the FDI attractiveness of regions. Pap Reg Sci. 2014;93:S51–S78. doi:10.1111/pirs. 12100. They are accessible at:https://circabc. europa.eu, file: 09010.xls. Data from European Private Equity and Venture Capital Association (EVCA) are accessible at:www.investeurope.eu, file: Country-tables-Public-version-FINAL.xlsx.
Funding:This work was supported by the Czech Sciences Foundation (https://gacr.cz), Grant No: 14-02836S to PH. The funder had no role in study design, data collection and analysis, decision to publish, or preparation of the manuscript.
model specification is required in conventional regression models and it is extremely difficult to combine two models in the same regression model [19]. The specification of these models is also considered not adaptive and require knowledge of the underlying data distribution. As a consequence, conventional regression models can be distorted in evolving, noisy and high var-iance environments. In contrast, ANNs can automatically represent highly complex input-out-put non-linear relationships. At the same time, linear patterns are not ignored, and fixed and random effects are incorporated. The ANN model also does not require explicit specification of a priori relationships between input and output attributes. The connectionist architecture and distributed computations in ANNs ensure robustness even when model assumptions are violated.
Previous literature regarding innovation performance modeling has tended to focus on firm-related determinants, paying little attention to the regional framework. Our model gives particular attention to external (to the firm) determinants of innovation performance. The complex region-related determinants of innovation performance lead to an even more com-plex modeling problem [20]. The aim of this paper is to adopt a regional perspective on the sources of innovation performance. Specifically, here we show that both business and govern-ment R&D activity has a positive effect on regional innovation performance. These effects are represented by sigmoidal curves. The nonlinear character of these effects has important impli-cations for regional innovation policy.
The remainder of this paper is structured as follows. In the next section, we operationalize the determinants of regional innovation performance and devise the forecasting model. Sec-tion 3 provides the experimental results. Finally, we discuss the obtained results, draw some political implications and conclude the paper with suggestions for future research.
Materials and methods
Model and variable description
Determinants of regional innovation performance. Two inter-related categories of determinants have been introduced into the models of regional innovation performance, namely internal (firm-specific) and external determinants of innovation. Firm-specific deter-minants usually include firm R&D expenditure, linkages, and throughputs [21,22]. External determinants can be further subdivided into three categories [23]: (1) the National Innovation System (NIS) and national R&D infrastructure; (2) regional determinants (e.g., local endow-ment, social capital, regional linkages); and (3) sectoral determinants (e.g., technology, finance, market). Samara et al. [24] provided an alternative categorization of interacting subsystems, including knowledge and human resources, economic and institutional conditions and the financial subsystem (public R&D expenditure and venture capital availability).
The functional approach used here is based on previous experimental work [6,24]. It includes two interconnected components: intra-regional and inter-regional. The RIS, concep-tualized inFig 1, can be characterized by a high intensity of economic and knowledge interac-tion, both within companies as well as between firms and other organizations, such as
universities and research centers. These interactions are facilitated by economic and socio-cul-tural factors, such as routines, shared values, norms, and trust [25]. Thus, the borders of the system can be determined by the frequency or intensity of these interactions.
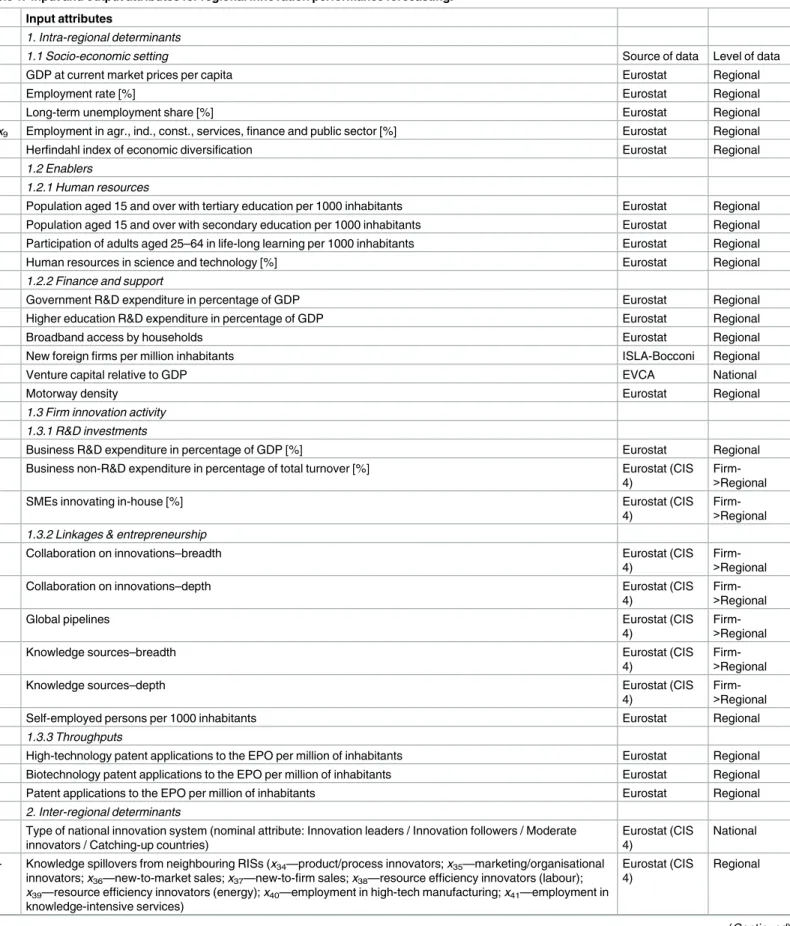
In this study, we used the determinants and indicators of regional innovation performance presented inTable 1along with the sources for each type of data. Note that attributesx33and
Regional socio-economic setting. Regional innovation activity is embedded in a common regional socio-economic setting. According to Cooke [2], differences in socio-economic con-ditions may lead to divergent innovation performance across regions.
We used regional per capita GDP as a proxy of regional economic performance and techno-logical development [26]. Income per capita has also been employed in several studies as an alternative to GDP [27]. In our study, the economic and market structures were measured by the shares of employment by industry and by the employment Herfindahl index (the degree of market concentration/specialization), respectively. Fritsch and Slavtchev [28] found an inversely U-shaped relationship between regional specialization and R&D efficiency. Also, the economic and market structures, like R&D expenditure, must be incorporated as a potential source of endogeneity. Fritsch and Meschede [22] identified employment structure (especially in knowledge-intensive industries) as another important region-related determinant. De Bruijn and Lagendijk [29] also demonstrated that regional per capita GDP and employment structure are important determinants of RIS performance.
The “social filter” concerns the specific combination of social conditions in a region that determines the ability of the region to transform R&D into innovation [26]. Thus, the social fil-ter becomes an important defil-terminant of long-fil-term regional economic growth [30]. Both employment rate and the share of long-term unemployment have been used as proxies for the social filter. The latter also indicates the rigidity of the regional labor market [26]. Note that the population’s level of education has also been considered an important determinant of the regional social filter [26]. In our study, we adopt the concept of the regional innovation process from the European Innovation Scoreboard [31], in which the population’s level of education is considered to enable innovative activity.
Fig 1. Model of regional innovation system with intra-regional and inter-regional components.
Regional innovation performance is affected by internal (firm-specific) and external determinants of innovation (inter-regional component, socioeconomic setting, and enablers of innovation activity).
Table 1. Input and output attributes for regional innovation performance forecasting. Input attributes
1. Intra-regional determinants
1.1 Socio-economic setting Source of data Level of data
x1 GDP at current market prices per capita Eurostat Regional
x2 Employment rate [%] Eurostat Regional
x3 Long-term unemployment share [%] Eurostat Regional
x4-x9 Employment in agr., ind., const., services, finance and public sector [%] Eurostat Regional
x10 Herfindahl index of economic diversification Eurostat Regional
1.2 Enablers
1.2.1 Human resources
x11 Population aged 15 and over with tertiary education per 1000 inhabitants Eurostat Regional
x12 Population aged 15 and over with secondary education per 1000 inhabitants Eurostat Regional
x13 Participation of adults aged 25–64 in life-long learning per 1000 inhabitants Eurostat Regional
x14 Human resources in science and technology [%] Eurostat Regional
1.2.2 Finance and support
x15 Government R&D expenditure in percentage of GDP Eurostat Regional
x16 Higher education R&D expenditure in percentage of GDP Eurostat Regional
x17 Broadband access by households Eurostat Regional
x18 New foreign firms per million inhabitants ISLA-Bocconi Regional
x19 Venture capital relative to GDP EVCA National
x20 Motorway density Eurostat Regional
1.3 Firm innovation activity
1.3.1 R&D investments
x21 Business R&D expenditure in percentage of GDP [%] Eurostat Regional
x22 Business non-R&D expenditure in percentage of total turnover [%] Eurostat (CIS
4)
Firm->Regional
x23 SMEs innovating in-house [%] Eurostat (CIS
4)
Firm->Regional
1.3.2 Linkages & entrepreneurship
x24 Collaboration on innovations–breadth Eurostat (CIS
4)
Firm->Regional
x25 Collaboration on innovations–depth Eurostat (CIS
4)
Firm->Regional
x26 Global pipelines Eurostat (CIS
4)
Firm->Regional
x27 Knowledge sources–breadth Eurostat (CIS
4)
Firm->Regional
x28 Knowledge sources–depth Eurostat (CIS
4)
Firm->Regional
x29 Self-employed persons per 1000 inhabitants Eurostat Regional
1.3.3 Throughputs
x30 High-technology patent applications to the EPO per million of inhabitants Eurostat Regional
x31 Biotechnology patent applications to the EPO per million of inhabitants Eurostat Regional
x32 Patent applications to the EPO per million of inhabitants Eurostat Regional
2. Inter-regional determinants
x33 Type of national innovation system (nominal attribute: Innovation leaders / Innovation followers / Moderate innovators / Catching-up countries)
Eurostat (CIS 4)
National
x34
-x41
Knowledge spillovers from neighbouring RISs (x34—product/process innovators;x35—marketing/organisational innovators;x36—new-to-market sales;x37—new-to-firm sales;x38—resource efficiency innovators (labour);
x39—resource efficiency innovators (energy);x40—employment in high-tech manufacturing;x41—employment in
knowledge-intensive services)
Eurostat (CIS 4)
Regional
Enablers of innovation activity. Enablers of innovation activity include: (1) the availabil-ity of human resources (skilled and educated people) and (2) financial sources and other support.
Indicators of human capital can be used to estimate regional capacity to absorb knowledge and technology. We used the share of the population with a secondary education to indicate general skills. Also, the share of the population with a tertiary education was used to assess advanced academic skills [26]. Several studies have also included an index of university quality based on rankings of universities. However, better-ranked universities do not generate signifi-cantly higher regional innovation output; therefore, university rankings cannot adequately measure differences in university quality [32].
Human resources in science and technology approximate the demand for and supply of sci-ence and technology workers. Sleuwaegen and Boiardi [32] reported that this indicator, together with the share of the population with a tertiary education, represent a major factor (the so-called regional intelligence) of regional innovation activity. The readiness to continue technological development and innovation can be promoted through the participation of peo-ple in lifelong learning [27].
In our study, the financial and other support category includes: (1) public R&D expendi-ture; (2) ICT and transport infrastrucexpendi-ture; and (3) foreign direct investment (FDI) and venture capital funds. The level of public R&D expenditure indicates the relative effort of a region to create, disseminate and exploit knowledge. In agreement with previous studies [27], we distin-guish between government and higher education R&D expenditures to take into account the different types of research carried out by various public organizations.
ICT and transport infrastructure (communication and transportation networks) make the innovation process more efficient. They also provide accessibility to globally dispersed knowl-edge sources [32]. By other studies, we used the level of broadband access as a proxy for ICT infrastructure [3] and motorway density as a proxy for transport infrastructure [33].
To estimate the level of FDI, we adopted the approach of Casi and Resmini [34], using the number of new foreign firms per million inhabitants. FDI can contribute significantly to regional innovation capacity and produce positive productivity spillovers [35], but the strength of these effects depends on the availability of the region’s absorptive capacity. Similarly, the positive effect of venture capital varies with the intensity of regional innovation [36]. To
Table 1. (Continued)
x42 EU policy (dummy attribute: new/old Member State) Eurostat National
Output attributes
Innovators
y1 Product and/or process innovators [%] Eurostat (CIS
5)
Firm->Regional
y2 Marketing and/or organisational innovators [%] Eurostat (CIS
5)
Firm->Regional
y3 Resource efficiency innovators—labour [%] Eurostat (CIS
5)
Firm->Regional
y4 Resource efficiency innovators—energy [%] Eurostat (CIS
5)
Firm->Regional
Economic effects
y5 New-to-market sales (in percentage of total turnover) [%] Eurostat (CIS
5)
Firm->Regional
y6 New-to-firm sales (in percentage of total turnover) [%] Eurostat (CIS
5)
measure venture capital funds, we used the indicator of national venture capital relative to GDP obtained from the European Private Equity and Venture Capital Association (EVCA).
Firm innovation activities. In this study, firm innovation activities are represented by (1) firm R&D investments; (2) linkages & entrepreneurship; and (3) throughputs.
In-house R&D investment has been recognized as a significant determinant of innovation performance in most studies [37]. This indicator estimates the level of knowledge creation within firms, and it is also associated with the firms’ capacity to absorb more knowledge from the outside. Non-R&D innovation expenditures, on the other hand, measure the diffusion of technology [38]. According to the Frascati Manual of the OECD [39], examining the expendi-tures of all aspects of the innovation process may facilitate more meaningful calculations of financial inputs. In addition to R&D and non-R&D innovation expenditures, we also used the percentage of SMEs innovating in-house. This indicator has also been used to estimate the transmission and application of knowledge [40].
Firm innovation activities involve the use of both codified (intellectual property rights) and tacit knowledge (through linkages and entrepreneurship). The past decade has seen a rapid rise in firms’ use of the “open innovation” model. A wide range of external actors and knowl-edge sources helps firms achieve and sustain innovation [41–43]. Frenz and Ietto-Gillies [37] reported that the benefits of cooperation in innovation efforts are realized only when a suffi-cient number of firms cooperates or when firms cooperate internationally. Moreover, innova-tion performance degrades with more repeat collaborainnova-tions [44]. In recent literature, social network analysis of collaborative R&D projects has also been used to model knowledge flows between regions [45]. The number of these linkages was reported to be a significant determi-nant of innovation throughputs. To account for the presence of network connections, in accordance with Laursen and Salter [41], we captured the strengths of the linkages using four dimensions (two-by-two), namely the breadth and depth of both collaboration and knowledge sources. The extent of cooperation on innovation was measured as the number of connections —collaborating partners (other firms, suppliers, clients, competitors, consultants, universities and government institutes), whereas only simultaneous collaborations between domestic and international partners were considered in estimating the depth of collaboration (on a 0–7 scale). Similarly, the breadth of knowledge sources was calculated as the number of connec-tions—knowledge sources used (market: suppliers, clients, competitors, and consultants; insti-tutional: universities and government research institutes; other: conferences, scientific journals, and professional associations). To determine the depth of knowledge sources, only those sources were included that were used to a high degree. To further distinguish between local and global knowledge exchange and to recognize the increasing importance of global pipelines [25,46], we also included the number of connections—collaborating international partners.
The level of entrepreneurial activity relates to the regional capacity to apply new knowledge. It is therefore considered an important determinant of innovation-based regional growth [47]. We used the share of self-employed persons as a proxy for entrepreneurial activity.
Inter-regional determinants. The inter-regional determinants of EU regions’ regional innovation performance include the specifics of the corresponding NIS [48], inter-regional knowledge spillovers, and support from the EU.
NISs are important in determining inter-regional disparities [23]. The importance of NISs also stems from the public-private nature of the regional innovation process. To obtain a typol-ogy of NISs, we used the summary innovation index from the EIS 2004. This index provides both an aggregate indicator of national innovation performance and outlines the strengths and weaknesses of NISs [49]. To consider the effect of national innovation policy, we categorized NISs based on the four innovation patterns found in the EIS: (1) innovation leaders, (2) inno-vation followers, (3) moderate innovators, and (4) catching-up countries. Thus, a variety of national-level determinants was considered as the EIS is calculated based on the national indi-cators of human resources, research systems, innovation-friendly environment, finance & sup-port, firm investments, innovators, linkages, intellectual assets and employment and sales impacts. Previous studies have also included the availability of investment capital as an indica-tor associated with the national environment [21]. Note that we also used the availability of national venture capital within the enablers of innovation activity. Alternative measures of NISs’ performance have also been considered in previous literature [32,49]. However, most of these evaluate the overall competitive capacity of economic systems, whereas the EIS was con-ceived specifically as a tool to monitor the objectives of the Lisbon Strategy.
Reportedly, the innovation performance of a region is dependent on the performance of spatially close regions. The strength of this relationship may vary depending on the range of knowledge diffusion [50]. Rodriguez-Pose and Crescenzi [26] found a strong distance decay effect for this relationship, emphasizing the effect of innovative activities pursued in neighbor-ing regions. Similarly, Vilaet al. [51] indicated that the level of innovation outputs strongly depends on the corresponding outputs in neighboring regions. Specifically, it was empirically confirmed that knowledge spillovers reinforce the effect of local innovative activities as the amount of knowledge available in the neighboring region increases. Moreover, a strong inno-vative performance in neighboring regions may even compensate for a weak innovation activ-ity pursued locally [26]. Thus, a region within an innovative neighborhood is more advantaged compared with one in less innovative neighborhood. Therefore, we estimated these spillovers using those neighboring regions with the best innovation performance. The size of the knowl-edge spillover from neighboring RISs was estimated using the following formula:
xj¼maxðy k;2004
Þ y2004
; ð1Þ
of geographically neighboring observations. This was not only due to the strong distance decay effect reported in the literature but also to control for the complexity of the ANN model.
International trade has also been considered an important source of regional knowledge spillovers [52]. However, related data are available only for a handful of EU countries. This study also considered the effect of EU institutional and financial support of RISs, distinguish-ing between old and the new Member States. EU regional support has shown a significantly positive effect on GDP growth in EU regions [53], strongly contributing to the economic con-vergence of new Member States [3].
Regional innovation output. In the EIS, the output of regional innovation activity was measured by the number of innovators, considering the diversity of innovations. R&D may be the most important innovation determinant for some firms, while other firms may rely on adopting technologies. Thus, it is not possible to use a single indicator of innovation perfor-mance. Therefore, several dimensions of innovation performance have been designed by the European Commission, based on the Frascati Manual of the OECD [39], to accommodate the diversity of different innovation processes and models that occur in different regional contexts. The use of different types and modes of innovations in a model leads to better understanding of the drivers of regional innovation performance. In our set of innovation performance indi-cators, we adopted the approach of the EIS and calculated the proportion of innovative firms in the region, which corresponds to the outputs of innovation generators [54]. Regional inno-vation output can be measured separately for product or process innoinno-vations and for market-ing or organizational innovations. The former includes technological innovation, whereas the latter represents non-technological innovation. Furthermore, the latter is an important deter-minant of productivity growth and the efficiency of product or process innovations. Addition-ally, technological innovations have an important effect on the efficiency of resource use. Therefore, we also investigated the share of innovating firms that reduced labor costs and materials and energy, respectively, as a result of innovation activity. In addition to the outputs of innovation generators, the EIS evaluates the economic success of innovation activity. There-fore, we also considered the economic benefits (measured as sales) of regional innovation activity. Specifically, we differentiated between new-to-market (the creation of state-of-the-art technologies) and new-to-firm (the diffusion of technologies) sales. Recently, innovation effi-ciency has been used as an alternative measure to the outputs of innovation generators. In this approach, innovation performance is defined as the relation between the generated innovative output and the invested efforts. However, several strong assumptions must be made to apply this approach (either parametric or non-parametric), for example, the multiplicative effect of innovation facilitators, correct innovation production function, the identity assumption and accurately considered fluctuation [54].
Data preprocessing
within themselves [50]. Data for the determinants of regional innovation performance were collected for the year 2004 and 265 European regions (for 6 regions, the data were not avail-able). Input attributes were derived from the fourth Community Innovation Survey (CIS 4). The CISs offer the most comprehensive data regarding the range of firms surveyed. The effects of the determinants of regional innovation performance are expected to be delayed [37]. Therefore, data measuring regional innovation performance (output attributes) were taken from 2006 (CIS 5). The reference periods for the CIS 4 (and 5) were 2004 and 2006, respec-tively, and the observation period of each ran from 2002 to 2004 and from 2004 to 2006, respectively. The CIS 5 was carried out using either the same harmonized survey questionnaire or a subset of the CIS 4 questions.
S1 Appendixpresents the input and output data. In conformity with regional innovation scoreboard, we noticed considerable diversity in regional innovation performance within countries. Most innovative regions were typically located in NISs’ leaders (Germany, United Kingdom, Sweden, etc.), whereas Eastern and Southern European regions performed worst (Bulgaria, Romania, Poland, Portugal, etc.). In fact, regions performing well in terms of GDP per capita and competitiveness index [55] were also performing well with respect to innovation activity. In particular, more competitive and innovative regions were observed in Northern Europe. This can be partly attributed to high institutional quality, macroeconomic stability, the quality of education and labor market efficiency. Generally, capital regions performed bet-ter than non-capital regions. However, imbalanced levels of innovation performance indica-tors were observed for a significant amount of regions. Also note that, on one hand, the European regions lagged behind those in United States, Japan and South Korea in overall R&D intensity in the reference period. On the other hand, growing R&D investment promoted competitiveness and economic growth in many NUTS 2 regions. As others NUTS 2 regions faced efficiency problems related to the inadequate impact of R&D expenditure, the European Union launched ambitious research and innovation policy reforms during the reference period. However, it is difficult to predict the effects of these reforms due to the complexity of the interrelated components of RISs. The multilayer architecture of ANNs enables to represent various combinations of these components. In other words, the connectivity of the ANN simu-lates the effects of various regional research and innovation policies. In addition, the number of neurons in ANN layers control for the complexity of these combinations. In fact, a highly complex system can be theoretically designed to model all specifications of the regions in the dataset. However, such a model would be overfitted to the regions in the training dataset, per-forming poorly on out-of-sample regions. Therefore, we believe that the NUTS 2 regional level represents a natural context to use the ANN approach for innovation performance modelling.
First, missing values in the data had to be treated. If data for surrounding years were avail-able, we replaced missing data using linear regression based on the data of the corresponding NUTS 1 regions. If these data were not available, we replaced the missing data with the NUTS 1 data. During data pre-processing, principal component analysis (PCA) was conducted to obtain a set of uncorrelated variables.
Pakath and Zaveri [56] stated that neural networks are highly dependent on the selection of input variables. In that sense, reducing the dimensions of the input variables will extract the important variables to increase the execution efficiency of the models. Also, learning algo-rithms operate faster, and accuracy of the models can be improved [57,58]. Feature extraction using the PCA was also used in previous studies on modeling innovation performance to avoid the collinearity among input attributes [15,16].
Methods
ANNs are an approach for quantitative data analysis inspired by the way we believe the brain processes information. It consists of a processing system composed by a large number of inter-connected elements (units or neurons) which are usually organized into a sequence of layers (the input layer, hidden layer(s) and output layer) linked by weights. The networks are then trained by processing the inputs and comparing the resulting outputs with the desired outputs. The difference is then propagated to the network by adjusting its weights to minimize the error. This is an iterative process, and the weights are continually adjusted until it converges to an optimum solution. This learning capability makes them very suitable for different specific applications, such as pattern recognition or data classification [59]. ANNs represent not a sin-gle method but a family of models. The ANN model chosen for this research is the Multilayer Perceptron (MLP), i.e., a multi-layer, fully connected feed-forward network with a back-prop-agation training rule as proposed by [60].
We employed the MLP to forecast the innovation performance of each NUTS 2 region. MLP comprises fully connected neurons organized into a sequence of layers. The general architecture of the MLP used in this study is depicted inFig 2. The input layer represents the components of regional innovation performance, the hidden layer represents the combina-tions of these components (regional innovation policies), and the output layer represents the outputs of regional innovation activity (innovators and their economic effects). The connec-tions between neurons in the MLP denote the importance of the components for regional innovation policies (connections between the input and hidden layer) and the importance of these policies for the outputs of regional innovation performance (connections between the hidden and output layer), respectively. Note that more complex combinations of the regional innovation components can be modelled using the second hidden layer, which can extract high-order regional policies (general and more specific, for example). The sigmoid activation functions of the neurons in the hidden layer enable to find non-linear patterns (combinations of regional innovation components) in the data.
The time-series component of the outputs was considered using six outputs at timet-2. However, Qi and Zhang [61] presented empirical evidence that stationarity is important for the out-of-sample performance of the ANNs regardless of the underlying data generating pro-cess. Therefore, we first performed the Hadri Lagrange multiplier panel unit root test for a null hypothesis that the individual observed are stationary around a deterministic level or around a
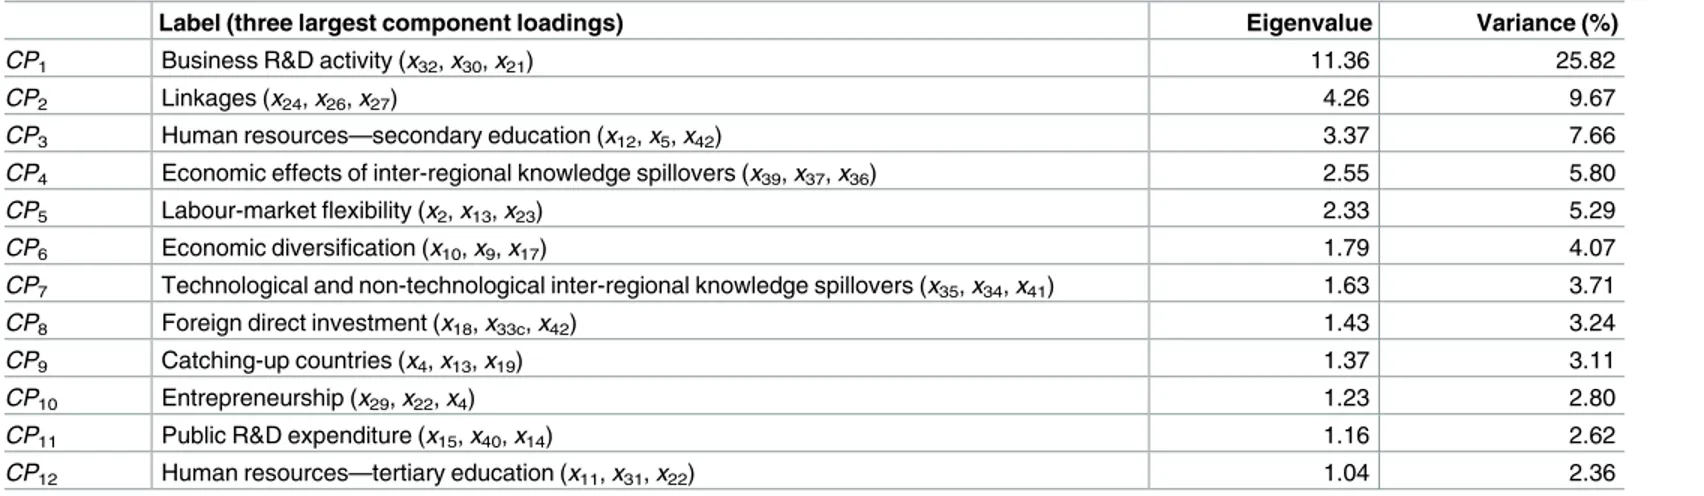
Table 2. Results of principal component analysis.
Label (three largest component loadings) Eigenvalue Variance (%)
CP1 Business R&D activity (x32,x30,x21) 11.36 25.82
CP2 Linkages (x24,x26,x27) 4.26 9.67
CP3 Human resources—secondary education (x12,x5,x42) 3.37 7.66
CP4 Economic effects of inter-regional knowledge spillovers (x39,x37,x36) 2.55 5.80
CP5 Labour-market flexibility (x2,x13,x23) 2.33 5.29
CP6 Economic diversification (x10,x9,x17) 1.79 4.07
CP7 Technological and non-technological inter-regional knowledge spillovers (x35,x34,x41) 1.63 3.71
CP8 Foreign direct investment (x18,x33c,x42) 1.43 3.24
CP9 Catching-up countries (x4,x13,x19) 1.37 3.11
CP10 Entrepreneurship (x29,x22,x4) 1.23 2.80
CP11 Public R&D expenditure (x15,x40,x14) 1.16 2.62
CP12 Human resources—tertiary education (x11,x31,x22) 1.04 2.36
deterministic trend [62]. We found clear evidence of non-stationarity for all six outputs. To reduce the effect of nonstationarity, we used the logarithms of outputs in our model. The out-put layer is formed by six outout-put neurons, corresponding to the six outout-puts in time t presented inTable 1. The transfer functions selected for the layers were sigmoid for the hidden layer and linear for the output layer. A normalization step (into the range [−1, 1]) was applied to both the input vectors and the target vectors using the mapminmax function. The MLP was trained with the Levenberg–Marquardt [63] back-propagation algorithm in the Matlab Neural Net-work Toolbox.
The early stopping procedure followed in this paper was defined based on MSE gradient. The training phase will stop if the magnitude of the gradient of MSE for validation data is less than 1e-5 for six successive iterations.
The use of multiple layers and neurons not only enables modeling of nonlinear input-out-put relationships, but it also facilitates measuring the effects of endogenous variables and their
Fig 2. General multi-output MLP architecture.The input layer presents 18 neurons, corresponding to the 12 principal components presented inTable 2plus six outputs regarding the outputs in timet-2. Several MLP architectures were tested by changing the number of layers and the number of neurons in each hidden layer. Neurons in the output layer represent the multi-output regional innovation performance in timet.
https://doi.org/10.1371/journal.pone.0185755.g002
Table 3. Correlation coefficients between output attributes, significant correlations atp<0.05 are marked in italics.
y1 y2 y3 y4 y5 y6
y1 1.000 0.868 0.355 0.406 0.780 0.666
y2 0.868 1.000 0.383 0.477 0.648 0.423
y3 0.355 0.383 1.000 0.650 0.342 0.088
y4 0.406 0.477 0.650 1.000 0.688 0.167
y5 0.780 0.648 0.342 0.688 1.000 0.721
y6 0.666 0.423 0.088 0.167 0.721 1.000
interrelations [64]. This feature is necessary to solve the estimation problems reported in previ-ous literature. For example, R&D expenditure and entrepreneurial activity have been reported as a source of strong endogeneity problems [22]. Moreover, the multi-output ANN model addresses the issue of the possible interdependency of the output attributes. For example, Kraft [65] reported the interdependence of product and process innovators. Obviously, the output attributes are also strongly correlated in our data set (Table 3).
Results
To avoid model overfitting, a set of 50 runs was generated using a holdout method of 70%, 15% and 15% of data used for training, validation, and testing, respectively. Several MLP archi-tectures were tested, using the same set of 50 runs for each, thus avoiding problems associated with local minima. We followed a systematic approach, adding complexity to the network by increasing the number of neurons per layer and by increasing the number of hidden layers. This approach begins by selecting a small number of hidden neurons and then increased the number of hidden neurons until training and testing improved [66].
The architecture that presented the lowest MSEs was the one that used only one hidden layer with six neurons (Fig 3). Analyzing the error per output, all structures presented a similar pattern: the smallest MSE was obtained fory3andy4, whiley2andy6presented higher estima-tion errors.
Further, we compared the performance of the multi-output MLP model with other models used in previous studies on innovation performance modeling (Table 4). Namely, we used sin-gle-output MLP [15], a three-stage least squares model (3SLS) [67], M5 regression tree [68], and adaptive neuro-fuzzy inference system (ANFIS) [16]. The single-output MLP models were trained using the same algorithm and setting as the multi-output one. In the M5 regression tree, the minimum number of instances to allow at a leaf node was set to four. Finally, the ANFIS was trained for various numbers of membership functions and if-then rules N = {2, 3, 5, 7}. The membership functions and if-then rules were generated automatically using a sub-tractive clustering algorithm. The adaptation of the premise and consequent parameters of the ANFIS was carried out by a gradient descent algorithm with one pass of the least-squares estimate.
To test the statistical differences between the best multi-output model and other models, we performed paired Student’st-tests. The results indicated that the multi-output model with six neurons in the hidden layer performed significantly better atp<0.05than the single-output
MLP model for outputsy2,y4,y5andy6(Table 4). Notably, the ANFIS was significantly outper-formed for all six outputs. The multi-output model peroutper-formed best fory1toy5, whereas the M5 regression tree achieved the lowest MSE fory6.
An important issue in the design and implementation of a neural network is the sensitivity of its output to input and weight perturbations [69]. In this paper, we tested the MLP robust-ness by using three different set of input variables. The first set of variables used was the first six principal components, the second set included the first 12 principal components and in the third set the first 12 principal components and the six outputs for the year 2004 (t-2) was used.
Table 5presents the average MSE for test data, per output using a 50 runs experiment for each set of input variables.
The results indicated that the set of 12 principal components and six outputs fort-2 per-formed better for all outputs except fory3andy4where just using the first 12 principal compo-nents performed slightly better.
minimum to its maximum value), submitting the changed variable to the ANN while main-taining all other input variables at their mean values. Thus, we could assess the individual con-tributions of each variable.
We present a change indicator to summarize the results better. We calculated the change for each output while varying the input variable, using the following equation:
Changeyixjk ¼ ðyixjkþ1 yixjkÞ; i¼ f1;2;3;4;5;6g; j¼ f1;2;. . .;18g;k¼ f1;2;3;4g; ð2Þ
whereChangeyixjkis the value of the change of the outputyiusing thek
thvalue of variablexj.
Fig 4presents the tendency in the evolution of each output while varying one input variable at a time. The first two principal components are depicted inFig 4, whereas the remaining components are presented inS3 Appendix.
Fig 3. MSE for different multi-output MLP architectures.The average MSE and the standard deviation are presented for each output test datasets using 50 runs. MLP architectures with one single hidden layer are presented with a scalar value (representing the number of hidden neurons on that layer) while architectures with two hidden layers are presented by a vector of two values (the number of hidden neurons on the 1stand
2ndhidden layer).
https://doi.org/10.1371/journal.pone.0185755.g003
Table 4. MSE (Mean±SD) for each output–MIMO MLP vs. benchmark methods.
Output MIMO MLP MISO MLP 3SLS
y1 0.01712±0.00638 0.01852±0.00698 0.02289±0.00356*
y2 0.01858±0.00599 0.02182±0.01080* 0.02663±0.00331*
y3 0.01048±0.00783 0.01076±0.00607 0.01054±0.00308
y4 0.01137±0.00718 0.01383±0.00994* 0.01172±0.00288
y5 0.01496±0.00482 0.01863±0.00818* 0.01593±0.00215
y6 0.02865±0.00737 0.03793±0.01212* 0.03092±0.00309*
M5 regression tree ANFIS
y1 0.01740±0.00279 0.02264±0.00371*
y2 0.02196±0.00551* 0.02932±0.00359*
y3 0.01210±0.02578 0.12451±0.00162*
y4 0.01371±0.02459* 0.01426±0.00153*
y5 0.01551±0.00321 0.01910±0.00293*
y6 0.02862±0.00491 0.03651±0.00223*
*significantly worse than MIMO MLP atP= 0.05 using Student’s paired samplest-test
The sensitivity analysis inS3 Appendixdemonstrates that an increase in business R&D activity (CP1) has a positive effect on regional innovation performance. This effect is stronger when increasing from a low or medium-low value. A similar effect (sigmoidal curve) can also be observed for public R&D expenditures (CP11), which is, however, strongest when increased from a medium-low or medium value to a medium or medium-high value, respectively. The effect of linkages (CP2), on the other hand, was negative. Two different effects can be noted in the case of human resources, an inverted U-shape effect of secondary education (CP3), whereas the effect of tertiary education (CP12) was negative, particularly for low-performing regions. In other words, the effect of general skills was particularly large for regions with low levels of gen-eral skills. By contrast, when the region had a medium-high level of gengen-eral skills available, fur-ther increases showed even a negative impact on regional innovation performance. Similarly, several diverse effects can be observed for inter-regional knowledge spillovers (CP4andCP7). The effect was positive only for technological and non-technological inter-regional knowledge spillovers (CP7), and it worked only for the economic effects of innovation output (y5andy6). Labour-market flexibility (CP5) promoted the outputs of innovation generators (y1toy4) for low-performing regions in particular. The effect of economic diversification was positive only for the diffusion of new technologies (y6). FDI (CP8) promoted only resource-efficiency inno-vators (y3andy4). Catching-up countries (CP9) showed a negative effect, suggesting that the New Member States did not exhibit strong convergence in regional innovativeness. Interest-ingly, the effect of entrepreneurship (CP10) was stronger for the outputs of innovation genera-tors than for the economic effects of innovation activity. More specifically, the economic effects of regional innovation activity were promoted only in cases with a low level of entrepreneurship.
Altogether, significant effects were observed mainly for product and/or process innovators (y1) and marketing and/or organizational innovators (y2). The lowest effect of the extracted components was that of resource-efficiency innovators (y3andy4). The observed effects were non-linear, providing support for the use of ANN in modeling innovation activity.
Discussion and political implications
The research concerning forecasting innovation performance to date has tended to focus on firm-level rather than regional-level data. However, regional innovation performance is important for several reasons. The regional level is crucial for the implementation of innova-tion policies. Specifically, the European Regional Development Fund is the main instrument of European innovation and R&D policy, supporting regional innovation activity both directly, by co-financing R&D projects, and indirectly, by improving regional ICT and transport infra-structure. To make decisions about providing funding for innovation and R&D projects, it is increasingly important to consider their impact on regional innovation performance. Also, innovation activity is often carried out in regionally localized, collaborative networks. For
Table 5. MSE (Mean±SD) for each output–Different set of input variables.
Output CP1-CP6 CP1-CP12 CP1-CP12andy1t-2-y6t-2 y1 0.02033±0.00742 0.01984±0.00454 0.01712±0.00638
y2 0.02686±0.00978 0.02482±0.00624 0.01858±0.00599
y3 0.01082±0.00466 0.00988±0.00417 0.01048±0.00783
y4 0.01139±0.00522 0.01119±0.00436 0.01137±0.00718
y5 0.01875±0.008 0.01643±0.00396 0.01496±0.00482
y6 0.03598±0.00892 0.02987±0.0094 0.02865±0.00737
policymakers, it is therefore important to identify highly innovative networks and to encour-age regions to potentially transfer technology by improving the cooperation of networks.
The ready comprehensibility of the sensitivity analysis makes it possible to extract appropri-ate innovation strappropri-ategies from the multi-output model. Thus, we develop the following impor-tant political implications. Our results suggest that specific innovation strategies must be developed based on the current level of input attributes in the region, which agrees with the priority of European innovation policy, namely regional smart specialization strategies. This finding also corroborates the observations of To¨dtling and Trippl [6], suggesting that there is no single, ideal model for innovation policy in European regions.
This study provides empirical support that the business R&D activity has a sigmoidal effect (Fig 4). This effect was also observed by Yanget al. [70], suggesting that linear modeling meth-ods fail to capture the full dynamics of the relationship between business R&D intensity and innovation activity. Interestingly, we demonstrate that this nonlinear relationship also holds for government R&D activity. In other words, the most effective R&D state support should be directed to regions with below-average and average R&D activity. One possible explanation for this phenomenon might be that highly innovative regions use innovation policy with an increased emphasis on sustainability (built on their experience with previous R&D support). On the other hand, supporting less innovative regions may lead to more radical efforts.
The cooperation in innovation efforts seems to be effective for highly cooperative regions only (Fig 4). Specifically, the results suggest that both the depth and breadth of the linkages is required to promote regional innovation performance. Therefore, it is important to facilitate strong networking activities among various innovation actors to achieve effective technology transfer. Our results also suggest that the support of inter-regional knowledge spillovers (tech-nological and non-tech(tech-nological) may provide positive economic outcomes (see the effect of
CP4inS3 Appendix). Specifically, both new-to-firm and new-to-market innovators seem to make use of knowledge spillovers. The strongest effect was observed for regions that gain high knowledge spillovers from neighboring regions. Therefore, we argue for supporting
cross-Fig 4. Sensitivity of multi-output ANN to the change of business R&D activity (PC1) and linkages (PC2).The tendency of the evolution was obtained by
calculating the change for each output. Each variablexjhas five possible step values, meaning there arek= 4 possible changes of output values (i.e., from low to medium-low, from medium-low to medium, from medium to medium-high and from medium-high to high).
border partnerships in innovation activities, in particular between strong and weak RISs. For lagging behind regions, this may compensate for their weak innovation activity.
Furthermore, the development of training and life-long learning systems should be aimed especially at regions with a low level of general skills and/or labor-market flexibility (the inverted U-turn effects ofCP3andCP5inS3 Appendix). An ineffective educational structure may also account for the lower effect of tertiary education in these regions (the negative effect ofCP12inS3 Appendix).
Another important finding was that an increase in entrepreneurship promotes generators of regional innovation, irrespective of regional innovativeness. The support of self-employ-ment and business start-ups seems therefore to be an effective instruself-employ-ment of innovation policy, irrespective of the current level of entrepreneurial activity in the region (the effect ofCP10in
S3 Appendix). The development of the entrepreneurial skills of students and researchers is therefore strongly recommended to promote the performance of regional innovators.
Overall, the present findings seem to be consistent with other research which found the firm’s technological competences (CP1) to be the main determinant of innovation activities [7,8]. Entrepreneurial activity (CP10) was another key determinant of regional innovation performance.
Conclusions
Prior studies have noted the importance of various firm-related determinants for modeling innovation performance. However, such studies have been limited using single-output models. This study aimed to model the multi-output and nonlinear character of innovation perfor-mance. For this purpose, we developed a multi-output MLP-based model. It was hypothesized that this model could better explain the complex, non-linear patterns in regional innovation structures. The results of this study indicate that the multi-output MLP model better copes with this problem compared to single-output models such as MLP, 3SLS, M5 regression tree and ANFIS. Also, the current study found that the performance of the multi-output MLP model improves with the increasing number of the innovation performance determinants and the time-series components, respectively. Thus, the proposed nonlinear model of the innova-tion process can efficiently capture both the generainnova-tion and the transfer of knowledge and technology at the firm and regional level.
The model also efficiently solves the problems of interdependencies among inputs and out-puts. We showed that sensitivity analysis could be effectively employed to extract the knowl-edge stored in the multi-output MLP model. We believe that this study has gone some way towards enhancing our understanding of the role played by determinants in innovation per-formance modeling. Also, we believe this study provides important political implications and adds substantially to our understanding of regional innovation policy due to the extracted innovation strategies. These could be further used to develop targeted interventions aimed at improving innovation performance at the regional level. This is especially relevant for regions with a weak innovation performance that can profit from the knowledge spillovers from neigh-boring regions. The support of effective tertiary education and the development of entrepre-neurial skills can also be recommended as appropriate policy measures. Most importantly, we observed a sigmoidal effect of government R&D activity, suggesting that the financial support of the European research and innovation policy should be focused on regions with below-aver-age / averbelow-aver-age R&D activity. In other words, the support of weak performers, on one hand, and highly innovative regions, on the other hand, seems to be less effective.
2006 data, because although CIS 2008 (and 2010) data were also available, the NUTS 2 mem-bership of firms was missing from the most recent datasets. Second, the proposed model does and could not consider the relationships between the inputs. Therefore, we are currently in the process of investigating the potential of using recurrent ANNs for modeling regional innova-tion performance. Further research might also explore models of regional innovainnova-tion perfor-mance in particular sectors, such as manufacturing or services. We also believe that the proposed multi-output ANN model can be generalized and provide guidelines to the develop-ment of intelligent systems in a wide range of related economic or sustainable developdevelop-ment applications.
Supporting information
S1 Appendix. Preprocessed dataset. (DOCX)
S2 Appendix. Component loadings. (DOCX)
S3 Appendix. Sensitivity analysis of multi-output ANN. (DOCX)
Author Contributions
Conceptualization:Petr Hajek.
Data curation:Petr Hajek.
Formal analysis:Petr Hajek, Roberto Henriques.
Funding acquisition:Petr Hajek.
Investigation:Petr Hajek, Roberto Henriques.
Methodology:Petr Hajek, Roberto Henriques.
Project administration:Petr Hajek.
Resources:Petr Hajek, Roberto Henriques.
Software:Petr Hajek, Roberto Henriques.
Supervision:Petr Hajek.
Validation:Petr Hajek, Roberto Henriques.
Visualization:Roberto Henriques.
Writing – original draft:Petr Hajek, Roberto Henriques.
Writing – review & editing:Petr Hajek, Roberto Henriques.
References
1. Mention AL. Co-operation and co-opetition as open innovation practices in the service sector: Which influence on innovation novelty? Technovation. 2011; 31: 44–53.https://doi.org/10.1016/j.technovation. 2010.08.002
3. Hajek P, Henriques R, Hajkova V. Visualising components of regional innovation systems using self-organizing maps—Evidence from European regions. Technol Forecast Soc Change. 2014; 84: 197– 214.https://doi.org/10.1016/j.techfore.2013.07.013
4. Lau AKW, Lo W. Regional innovation system, absorptive capacity and innovation performance: An empirical study. Technol Forecast Soc Change. 2015; 92: 99–114.https://doi.org/10.1016/j.techfore. 2014.11.005
5. Doloreux D. Regional innovation systems in the periphery: The case of the Beauce in Que´bec (Can-ada). Int J Innov Manag. 2003; 7: 67–94.https://doi.org/10.1142/S1363919603000738
6. To¨dtling F, Trippl M. One size fits all? Res Policy. 2005; 34: 1203–1219.https://doi.org/10.1016/j. respol.2005.01.018
7. Vega-Jurado J, Gutie´rrez-Gracia A, Ferna´ndez-de-Lucio I, Manjarre´s-Henrı´quez L. The effect of exter-nal and interexter-nal factors on firms’ product innovation. Res Policy. 2008; 37: 616–632.https://doi.org/10. 1016/j.respol.2008.01.001
8. Caloghirou Y, Kastelli I, Tsakanikas A. Internal capabilities and external knowledge sources: Comple-ments or substitutes for innovative performance? Technovation. 2004; 24: 29–39.https://doi.org/10. 1016/S0166-4972(02)00051-2
9. Mitze T, Alecke B, Reinkowski J, Untiedt G. Linking collaborative R&D strategies with the research and innovation performance of SMEs in peripheral regions: Do spatial and organizational choices make a difference? Ann Reg Sci. 2015; 55: 555–596.https://doi.org/10.1007/s00168-015-0719-4
10. Grillitsch M, Nilsson M. Innovation in peripheral regions: Do collaborations compensate for a lack of local knowledge spillovers? Ann Reg Sci. 2015; 54: 299–321. https://doi.org/10.1007/s00168-014-0655-8
11. Roper S, Love JH, Bonner K. Firms’ knowledge search and local knowledge externalities in innovation performance. Res Policy. 2017; 46: 43–56.https://doi.org/10.1016/j.respol.2016.10.004
12. D’Ambrosio A, Gabriele R, Schiavone F, Villasalero M. The role of openness in explaining innovation performance in a regional context. J Technol Transf. 2017; 42: 389–408.https://doi.org/10.1007/ s10961-016-9501-8
13. Hollanders H. Measuring Regional Innovation: A European Perspective. Glob Innov Index 2013 Local Dyn Innov. 2013; 79–85.
14. Brem A, Voigt KI. Integration of market pull and technology push in the corporate front end and innova-tion management-Insights from the German software industry. Technovainnova-tion. 2009; 29: 351–367.
https://doi.org/10.1016/j.technovation.2008.06.003
15. Wang TY, Chien SC. Forecasting innovation performance via neural networks—A case of Taiwanese manufacturing industry. Technovation. 2006; 26: 635–643.https://doi.org/10.1016/j.technovation.2004. 11.001
16. Chien SC, Wang TY, Lin SL. Application of neuro-fuzzy networks to forecast innovation performance— The example of Taiwanese manufacturing industry. Expert Syst Appl. 2010; 37: 1086–1095.https://doi. org/10.1016/j.eswa.2009.06.107
17. Saberi S, Yusuff RM. Neural network application in predicting advanced manufacturing technology implementation performance. Neural Comput Appl. 2012; 21: 1191–1204.https://doi.org/10.1007/ s00521-010-0507-0
18. de la Paz-Marı´n M, Campoy-Muñoz P, Herva´s-Martı´nez C. Non-linear multiclassifier model based on Artificial Intelligence to predict research and development performance in European countries. Technol Forecast Soc Change. 2012; 79: 1731–1745.https://doi.org/10.1016/j.techfore.2012.06.001
19. Detienne KB, Detienne DH, Joshi S a. Neural networks as statistical tools for business researchers. Organ Res Methods. 2003; 6: 236–265.https://doi.org/10.1177/1094428103251907
20. Katz J. What is a complex innovation system? PLoS One. 2016; 11: e0156150.https://doi.org/10.1371/ journal.pone.0156150PMID:27258040
21. Buesa M, Heijs J, Baumert T. The determinants of regional innovation in Europe: A combined factorial and regression knowledge production function approach. Res Policy. 2010; 39: 722–735.https://doi. org/10.1016/j.respol.2010.02.016
22. Fritsch M, Meschede M. Product innovation, process innovation, and size. Rev Ind Organ. 2001; 19: 335–350.https://doi.org/10.1023/A:1011856020135
23. Radosevic S. Regional innovation systems in Central and Eastern Europe: Determinants, organizers and alignments. J Technol Transf. 2002; 27: 87–96.
25. Bathelt H, Malmberg A, Maskell P. Clusters and knowledge: local buzz, global pipelines and the process of knowledge creation. Prog Hum Geogr. 2004; 28: 31–56.https://doi.org/10.1191/
0309132504ph469oa
26. Rodriguez-Pose A, Crescenzi R. Research and development, spillovers, innovation systems, and the genesis of regional growth in Europe. Reg Stud. 2008; 42: 51–67.https://doi.org/10.1080/
00343400701654186
27. Navarro M, Gibaja JJ, Bilbao-Osorio B, Aguado R. Patterns of innovation in EU-25 regions: a typology and policy recommendations. Environ Plan C Gov Policy. SAGE Publications; 2009; 27: 815–840.
28. Fritsch M, Slavtchev V. How does industry specialization affect the efficiency of regional innovation sys-tems? Ann Reg Sci. 2010; 45: 87–108.https://doi.org/10.1007/s00168-009-0292-9
29. De Bruijn P, Lagendijk A. Regional innovation systems in the Lisbon strategy. Eur Plan Stud. 2005; 13: 1153–1172.https://doi.org/10.1080/09654310500336519
30. Huggins R, Izushi H, Prokop D, Thompson P. Regional evolution and waves of growth: A knowledge-based perspective. Expert Syst Appl. 2014; 41: 5573–5586.https://doi.org/10.1016/j.eswa.2014.02. 008
31. Hollanders H. 2006 European Regional Innovation Scoreboard (2006 RIS). Rep Novemb. 2006; 15.
32. Sleuwaegen L, Boiardi P. Creativity and regional innovation: Evidence from EU regions. Res Policy. 2014; 43: 1508–1522.https://doi.org/10.1016/j.respol.2014.03.014
33. Crescenzi R, Rodriguez-Pose A. Infrastructure and regional growth in the european union. Pap Reg Sci. 2012; 91: 487–513.https://doi.org/10.1111/j.1435-5957.2012.00439.x
34. Casi L, Resmini L. Spatial complexity and interactions in the FDI attractiveness of regions. Pap Reg Sci. 2014; 93: S51–S78.https://doi.org/10.1111/pirs.12100
35. Huang L, Liu X, Xu L. Regional innovation and spillover effects of foreign direct investment in China: A threshold approach. Reg Stud. 2012; 46: 583–596.https://doi.org/10.1080/00343404.2010.520694 36. Munari F, Toschi L. Assessing the impact of public venture capital programmes in the United Kingdom:
Do regional characteristics matter? J Bus Ventur. 2015; 30: 205–226.https://doi.org/10.1016/j. jbusvent.2014.07.009
37. Frenz M, Ietto-Gillies G. The impact on innovation performance of different sources of knowledge: Evi-dence from the UK Community Innovation Survey. Res Policy. 2009; 38: 1125–1135.https://doi.org/10. 1016/j.respol.2009.05.002
38. Sa´enz-Royo C, Gracia-La´zaro C, Moreno Y. The role of the organization structure in the diffusion of innovations. PLoS One. 2015; 10: e0126076.https://doi.org/10.1371/journal.pone.0126076PMID:
25978360
39. OECD. Frascati Manual: Proposed Standard Practice for Surveys on Research and Experimental Development [Internet]. The Measurement of Scientific and Technological Activities. 2002.https://doi. org/10.1787/9789264199040-en
40. Zabala-Iturriagagoitia JM, Voigt P, Gutie´rrez-Gracia A, Jime´nez-Sa´ez F. Regional innovation systems: How to assess performance. Reg Stud. 2007; 41: 661–672.https://doi.org/10.1080/
00343400601120270
41. Laursen K, Salter A. Open for innovation: The role of openness in explaining innovation performance among U.K. manufacturing firms. Strateg Manag J. 2006; 27: 131–150.https://doi.org/10.1002/smj.507 42. Ketata I, Sofka W, Grimpe C. The role of internal capabilities and firms’ environment for sustainable
innovation: evidence for Germany. R&D Manag. 2014; n/a-n/a.https://doi.org/10.1111/radm.12052 43. Go´mez J, Salazar I, Vargas P. Sources of information as determinants of product and process
innova-tion. PLoS One. 2016; 11: e0152743.https://doi.org/10.1371/journal.pone.0152743PMID:27035456 44. Inoue H, Liu Y. Revealing the intricate effect of collaboration on innovation. PLoS One. 2015; 10:
e0121973.https://doi.org/10.1371/journal.pone.0121973PMID:25799138
45. Di Cagno D, Fabrizi A, Meliciani V, Wanzenbo¨ck I. The impact of relational spillovers from joint research projects on knowledge creation across European regions. Technol Forecast Soc Change. 2016; 108: 83–94.https://doi.org/10.1016/j.techfore.2016.04.021
46. Morrison A, Rabellotti R, Zirulia L. When do global pipelines enhance the diffusion of knowledge in clus-ters? Econ Geogr. 2013; 89: 77–96.https://doi.org/10.1111/j.1944-8287.2012.01167.x
47. Huggins R, Thompson P. Entrepreneurship, innovation and regional growth: a network theory. Small Bus Econ. 2015; 45: 103–128.https://doi.org/10.1007/s11187-015-9643-3
49. Archibugi D, Denni M, Filippetti A. The technological capabilities of nations: The state of the art of syn-thetic indicators. Technol Forecast Soc Change. 2009; 76: 917–931.https://doi.org/10.1016/j.techfore. 2009.01.002
50. Bottazzi L, Peri G. Innovation and spillovers in regions: Evidence from European patent data. Eur Econ Rev. 2003; 47: 687–710.https://doi.org/10.1016/S0014-2921(02)00307-0
51. Vila LE, Cabrer B, Pavı´a JM. On the relationship between knowledge creation and economic perfor-mance. Technol Econ Dev Econ. Taylor & Francis; 2015; 21: 539–556.
52. Tavassoli S, Carbonara N. The role of knowledge variety and intensity for regional innovation. Small Bus Econ. 2014; 43: 493–509.https://doi.org/10.1007/s11187-014-9547-7
53. Cappelen A, Castellacci F, Fagerberg J, Verspagen B. The impact of regional support on growth and convergence in the European Union. J Commen Mark Stud. 2003; 41: 621–644.https://doi.org/10. 1111/1468-5965.00438
54. Brenner T, Broekel T. Methodological issues in measuring innovation performance of spatial units. Ind Innov. 2011; 18: 7–37.https://doi.org/10.1080/13662716.2010.528927
55. Dijkstra L, Annoni P, Kozovska K. A new regional competitiveness index: Theory, methods and findings. European Union Regional Policy Working Papers, n. 02/2011. Luxemburg; 2011.
56. Pakath R, Zaveri JS. Specifying critical inputs in a genetic algorithm-driven decision support system: An automated facility. Decis Sci. 1995; 26: 749–771.https://doi.org/10.1111/j.1540-5915.1995.tb01574.x 57. Tsai CF, Hsiao YC. Combining multiple feature selection methods for stock prediction: Union,
intersec-tion, and multi-intersection approaches. Decis Support Syst. 2010; 50: 258–269.https://doi.org/10. 1016/j.dss.2010.08.028
58. Hajek P, Michalak K. Feature selection in corporate credit rating prediction. Knowledge-Based Syst. 2013; 51: 72–84.https://doi.org/10.1016/j.knosys.2013.07.008
59. Gurney K. An Introduction to Neural Networks. Bristol, PA, USA: Taylor & Francis, Inc.; 1997.
60. Rumelhart DE, McClelland JL, Williams RJ. Parallel Distributed Processing: Explorations in the Micro-structure of Cognition [Internet]. Computational Models of Cognition and Perception. 1986.https://doi. org/10.1017/CBO9781107415324.004
61. Qi M, Zhang GP. Trend time-series modeling and forecasting with neural networks. IEEE Trans Neural Networks. 2008; 19: 808–816.https://doi.org/10.1109/TNN.2007.912308PMID:18467210
62. Rao Y, Hadri K, Bu R. Testing for stationarity in heterogeneous panel data in the case of model misspe-cification. Bull Econ Res. 2010; 62: 209–225.https://doi.org/10.1111/j.1467-8586.2009.00327.x 63. More JJ. The Levenberg-Marquardt algorithm: Implementation and theory. Lect Notes Math. 1978; 630:
105–116.https://doi.org/10.1007/BFb0067700
64. Kumar LR. Estimation of simultaneous econometric equations using neural networks. System Sci-ences, 1991 Proceedings of the Twenty-Fourth Annual Hawaii International Conference on. 1991. pp. 124–128.
65. Kraft K. Are product- and process-innovations independent of each other? Appl Econ. 1990; 22: 1029.
https://doi.org/10.1080/00036849000000132
66. Sheela KG, Deepa SN. Review on methods to fix number of hidden neurons in neural networks. Math Probl Eng. 2013; 2013.https://doi.org/10.1155/2013/425740
67. Artz KW, Norman PM, Hatfield DE, Cardinal LB. A longitudinal study of the impact of R&D, patents, and product innovation on firm performance. J Prod Innov Manag. 2010; 27: 725–740.https://doi.org/10. 1111/j.1540-5885.2010.00747.x
68. Hajek P, Stejskal J. Predicting the innovation activity of chemical firms using an ensemble of decision trees. Proceedings—2015 11th International Conference on Innovations in Information Technology, IIT 2015. 2015. pp. 35–39.https://doi.org/10.1109/INNOVATIONS.2015.7381511
69. Zeng X, Yeung DS. Sensitivity analysis of multilayer perceptron to input and weight perturbations. IEEE Trans Neural Networks. 2001; 12: 1358–1366.https://doi.org/10.1109/72.963772PMID:18249965 70. Yang K-P, Chiao Y-C, Kuo C-C. The relationship between R&D investment and firm profitability under a