Prevalence and factors
associated to overweight and
obesity in adolescents
ABSTRACT
OBJECTIVE: To assess the prevalence and factors associated to overweight and
obesity in urban area adolescents.
METHODS: A cross-sectional population-based study was carried out in the
municipality of Pelotas, Southern Brazil, between 2001 and 2002. Adolescents between 15 and 18 years old were weighed, measured and asked to complete a self-administered questionnaire. Of 90 areas drawn, 86 dwellings were visited in each area, comprising a total of 960 adolescents interviewed. Overweight and obesity prevalences were defined based on the body mass index, according to cutoff values and adjusted to age and sex. Multivariate analysis with Poisson regression was performed using a hierarchical model of variables associated to overweight and obesity.
RESULTS: Overweight and obesity prevalences were 20.9% and 5% respectively.
There was found an inverse relationship between obesity and age and schooling. An association of overweight and obesity with reporting parents’ obesity (p=0.03) and adolescents’ sexual maturation (p=0.01) was seen. Dieting and skipping meals were associated to obesity with a risk of 3.98 (95% CI: 1.83-8.67) and 2.54 (95% CI: 1.22-5.29) respectively.
CONCLUSIONS: Overweight and obesity prevalences in the area studied are of
concern despite adolescents’ behaviors to prevent to obesity. There is a need to implement more effective campaigns to provide better guidance to adolescents.
KEYW O RD S: Teen health. Prevalence. O besity, epidemiology. Risk factors. Cross-sectional studies.
N icole Gomes Terres Ricardo Tavares Pinheiro Bernardo Lessa H orta
Karen Amaral Tavares Pinheiro Lúcia Lessa H orta
Curso de Mestrado em Saúde e
Comportamento. Universidade Católica de Pelotas. Pelotas, RS, Brasil
Correspondence:
Nicole Gomes Terres
Av. José Maria da Fontoura, 1164 96090-370 Pelotas, RS, Brasil E-mail: [email protected]
INTRODUCTION
Obesity is no longer an isolated problem but has now become a significant public health concern. Its preva-lence has increased over the last decades, especially in developed countries9 but a similar trend has been
seen in developing countries, like Brazil. The high-est prevalences of obesity have been seen in South-ern Brazil, which are similar or even higher than those found in developed countries.5
The health impact of obesity has been described in several studies. Excess fat in adult life has been asso-ciated to higher rates of Diabetes Mellitus, high blood pressure,* high levels of triglycerides and high cho-lesterol.4 In children and adolescents, obesity has
been associated to early development of cardiovas-cular diseases,15 type 2 Diabetes Mellitus, and
psy-chological dysfunction,8 besides impairing posture
and causing musculoskeletal abnormalities and bringing about social and economic disadvantages during adult life.6
Recent studies have showed that children and adoles-cents with high body mass index (BMI) are also more likely to be overweight or obese by the age of 35 and this risk significantly increases as these children grow older. Adolescents who are obese at the age of 18 are 0.7 times more likely to be obese during their adult-hood than those adolescents with normal BMI.7
Obesity during adolescence has also increased in re-cent years reaching a prevalence of 10.6% among girls and 4.8% among boys. In the Southern region, prevalence rates have reached 13.9%.12
Several factors are likely to be associated to this con-dition. Although high body weight is the result of an imbalance between energy intake and energy ex-penditure, defining it has been a challenge as it var-ies according to demographic, social and economic, genetic, psychological, environmental, and indi-vidual factors.1,3,8,12
Given the increasing prevalence of obesity preva-lence in Brazilian population and because it is a risk factor for several major diseases, the present study aimed at assessing the prevalence and factors associ-ated to overweight and obesity among adolescents living in an urban area.
M ETH O D S
This study is part of the research project “Health
be-haviors among adolescents living in the urban area of Pelotas”. Other factors, such as physical inactivity, have been addressed in another published study.13 As
this is part of a larger research project, the estimates of sample size were based on multiple objectives. At 95% confidence and five-point significance level, estimates of sample size were obtained to assess mul-tiple outcomes such as obesity, physical inactivity, common mental conditions, and smoking, among others. Based on the estimate of 17% smokers in the age group 15 to 18 years, a sample size of 1,000 ado-lescents was obtained.
Ninety out of 448 census tracks were systematically drawn in the city of Pelotas, Southern Brazil. For each census track, a street corner was drawn as a starting point and, from there, 86 households were visited consecutively, totaling 7,740 households. In each household visited, all residents aged between 15 and 18 years old were interviewed after their parents or caretaker have given their written consent.
Data collection was carried out from December 2001 to April 2002. Study interviewers were university stu-dents trained in administering the questionnaire, an-swering questions and standardizing anthropometric measures.
Of 1,039 adolescents eligible, 79 were excluded due to their parents/caretaker’s refusal or their own refusal to participate in the study or either because they were not found at home after three visits, a loss of 7.6%. Thus, 960 adolescents participated in the study com-prising a representative sample of those living in the urban area of Pelotas.
Data was collected through weight and height meas-ures and a self-administered questionnaire. A 0.5kg precision scale was used for weight measures of sub-jects wearing light clothes and no shoes. Height was measured using a 0.1cm precision anthropometric ruler. Weight and height measures were collected by interviewers to avoid any possible measurement bias.
The following variables were assessed in the ques-tionnaire: gender (male and female); age (complete years); schooling (complete years); mother’s and fa-ther’s schooling (complete years); social and eco-nomic status (social class A, B, C, D, and E according to the Associação Brasileira de Institutos de Pesquisa de Mercado (ABIPEME - Brazilian Association of Institutes for Market Research); paid job in the month prior to the interview (yes or no); description of their parents’ physical look, assessed through adolescents’
perception of their mother’s and father’s obese physi-cal look; sexual maturation assessed through age at menarche or first ejaculation; physical activity as-sessed through physical activity at school or out of school (yes or no); alcohol and tobacco use in the month prior to the interview; dieting (yes or no) and skipping meals; average daily time watching TV; and minor psychological disorders assessed through Self-Report Questionnaire (SRQ 20).10
Obesity was defined by the BMI, dividing body mass in kilograms by squared height in meters. Table 1 shows the cutoff values used to determine overweight and obesity according to the International Obesity Task Force (IOTF), proposed by Cole et al2 (2000).
For quality control, supervisors confirmed informa-tion obtained in 30% of households visited and ques-tionnaires were coded right after the interviews.
Data were doubled entered in Epi Info software pro-gram. Univariate analysis with variable frequencies and distribution was performed. Proportion compari-son was carried out using the Chi-square test and Yates’ correlation test. Multivariate analysis was con-ducted using Poisson’s regression with robust vari-ance adjusting and controlling for design effect since the study was based on systematic sampling. The hi-erarchical model included demographic and socio-economic variables in the first level; description of parents’ physical look in the second level; adoles-cent’s sexual maturation in the third level; and
psychobehavioral variables in the fourth level. Vari-ables with significance level equal to or below 0.20 were included in the model.
RESU LTS
The prevalence of obesity in the studied population was 5.0% and the prevalence of overweight was 20.9%.
About six in every 10 adolescents had nine or more complete years of schooling. As for their socioeco-nomic status, most belonged to class C. Table 2 shows gender was not found to be associated to overweight and obesity. Adolescents by the age of 18 had lower prevalence of obesity (p<0.05). Adolescent’s school-ing was associated to obesity as higher obesity rates were seen in those with lower schooling (p<0.05). On the other hand, overweight was more commonly seen among those whose mothers had nine years or more of schooling (p<0.05) as well as in those with higher socioeconomic status (Table 2).
In regard to adolescents’ description of their parents’ Table 1 - Overweight and obesity cutoff values adjusted by age and gender. Southern Brazil, 2001-2002.*
Age BM I for overw eight BMI for obesity (years) Boys Gi rl s Boys Gi rl s 15 ≥23.29 ≥23.94 ≥28.3 ≥29.11 16 ≥23.9 ≥24.37 ≥28.88 ≥29.43 17 ≥24.46 ≥24.7 ≥29.41 ≥29.69
18 ≥25 ≥25 ≥30 ≥30
*Based on cutoff values proposed by Cole et al.2
Table 2 - D i stri buti on of overw ei ght and obesi ty preval ences accordi ng to soci al and demographi c factors. Southern Brazil, 2001-2002.
Vari abl e Category O verw ei ght O besity N
(%) (%)
Gender p=0.7 p=0.8
M al e 21.3 5.1 463
Femal e 20.5 4.8 497
Age p=0.3 p=0.04
15 23.7 8.3 227
16 22.8 4.8 271
17 18.1 2.7 221
18 18.6 4.1 241
Schooling (complete years) p=0.9 p=0.02
0 to 4 19.2 5.7 52
5 to 8 21.0 7.4 351
9 or more 21.0 3.4 557
M other’s schooling (complete years) p=0.04 p=0.9
0 to 4 17.6 5.0 198
5 to 8 18.9 5.2 416
9 or more 25.2 4.6 345
Father’s schooling (complete years) p=0.4 p=0.4
0 to 4 19.4 5.6 211
5 to 8 19.9 5.6 406
9 or more 23.0 3.7 343
Social class p=0.06 p=0.8
A or B 24.8 4.9 346
C 19.6 5.4 366
D or E 17.3 4.4 248
Paid job p=0.8 p=0.1
Yes 20.3 6.9 202
N o 21.1 4.4 758
physical look, children of obese fathers had higher prevalences of overweight and obesity (p<0.05) when compared to normal fathers but this association was not seen for mother’s physical look. Adolescents whose none of their parents were obese showed lower prevalence of overweight than those who described one or both par-ents as obese (p<0.05). An association of overweight with sexual maturation age was seen; those who had matured later showed lower overweight than those who had matured earlier (p=0.01). This difference was sig-nificant only among girls (p=0.02) (Table 3).
Dieting was strongly associated with overweight and obesity. Those reporting dieting had 40.5% and 16.2% prevalence of overweight and obesity respectively (p<0.01). Those who reported skipping meals also had higher prevalences of overweight and obesity (p<0.01). Tobacco and alcohol use was not found to be associated to overweight and obesity, as well as physical activity at school. However, higher preva-lence of physical activity out of school was seen among those with higher overweight (p<0.05). Time spent watching TV and minor psychiatric disorders Table 3 - Distribution of overweight and obesity prevalences according to parents’ profile and adolescents’ sexual maturation. Southern Brazil, 2001-2002.
Vari abl e Category O verw ei ght O besity N
(%) (%)
Perception of mother’s obesity p=0.09 p=0.3
Yes 25.5 6.5 184
N o 19.9 4.7 762
Perception of father’s obesity p=0.03 p=0.005
Yes 26.6 8.8 203
N o 19.5 3.9 711
O bese parents p=0.03 p=0.06
N one 18.7 3.8 592
O ne 24.1 6.7 253
Both 30.1 9.5 63
Total 21.0 5.0 960
Sexual maturation p=0.01 p=0.8
<11 years 26.7 5.3 206
12 to 13 years 20.7 5.0 516
14 to 18 years 14.8 4.0 175
Total 20.9 4.9 897
Boys’ sexual maturation (first ejaculation) p=0.2 p=0.7
<11 years 27.7 4.1 72
12 to 13 years 21.6 5.5 236
14 to 18 years 17.9 3.7 106
Total 21.7 4.8 414
Girls’ sexual maturation (menarche) p=0.02 p=0.8
<11 years 26.1 5.9 134
12 to 13 years 20.0 4.6 280
14 to 18 years 10.1 4.3 69
Total 20.3 5.0 483
Table 4 - Distribution of overweight and obesity prevalences according to psychobehavioral factors. Southern Brazil, 2001-2002.
Vari abl e Category O verw ei ght O besity N
(%) (%)
D i eti ng p<0.01 p<0.01
Yes 40.5 16.2 111
N o 18.4 3.5 844
Skipping meals p<0.01 p=0.01
Yes 27.6 7.8 434
N o 15.1 2.6 521
Alcohol use (in the month prior to the study) p=0.3 p=0.9
Yes 22.4 4.8 410
N o 19.7 5.0 538
Tobacco use (in the month prior to the study) p=0.5 p=0.2
Yes 19.1 3.1 157
N o 21.3 5.3 803
Physical activity at school p=0.7 p=0.07
Yes 20.8 4.6 319
N o 20.6 4.7 601
Physical activity outside school p=0.04 p=0.5
Yes 23.9 5.5 418
N o 18.6 4.6 542
Watching TV (daily hours) p=0.1 p=0.4
< 2 22.5 5.3 244
3 to 4 21.7 3.9 304
5 to 7 22.9 6.1 244
8 or more 14.2 4.7 168
M inor psychiatric disorders p=0.8 p=0.4
Yes 21.6 5.4 277
N o 20.9 4.3 663
were not found to be associated to overweight and obesity (Table 4).
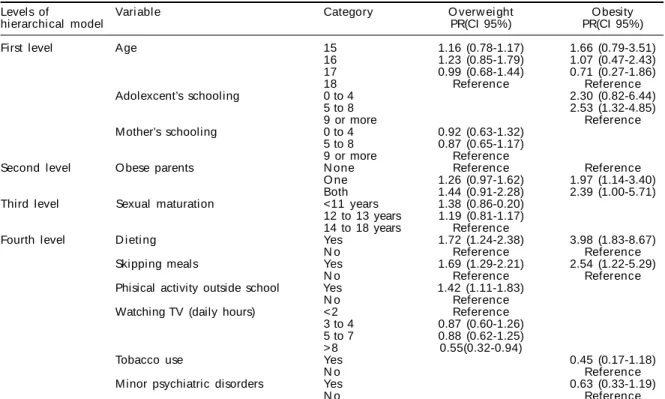
Multivariate analysis for overweight showed that, even after adjusting for adolescent’s age, mother’s schooling, obese parents, and sexual maturation, those who reported dieting had a higher overweight prevalence ratio (PR) of 1.72 (95% CI: 1.24-2.38). Other variables associated to overweight were: skip-ping meals (PR=1.69; 95% CI: 1.29-2.21), and physi-cal activity outside school were (PR=1.42; 95% CI: 1.11-1.83) (Table 5).
In regard to obesity, after adjusting for confounders in the multivariate analysis, those who had five to eight years of schooling were 2.53 (95% CI 1.32-4.85) more likely to be obese when compared to those who had completed high school or more. Having obese parents was also associated to obesity: PR of 1.97 (95% CI: 1.14-3.40) when one parent was obese and PR of 2.39 (95% CI: 1.00-5.71) when both parents were obese. Di-eting and skipping meals were also found to be associ-ated to obesity: PR of 3.98 (95% CI: 1.83-8.67) and PR of 2.54 (95% CI: 1.22-5.29), respectively (Table 5).
D ISCU SSIO N
Overweight and obesity prevalences of 20.9% and 5%, respectively, are similar to the findings of an-other study in Pelotas by Monteiro et al11 (2000) who
found 24.5% of overweight and 9% of obesity. These
slightly different results can be explained by the fact that, at that time, Monteiro et al11 were investigating
the best criterion to assess BMI cutoff values and for not using the same cutoffs adjusted by age and gen-der as proposed by Cole et al2 (2000). The findings of
the present study are higher than those found by Alves et al1 (2000) who described 14% prevalence of
over-weight and obesity. This difference could be explained by the fact that Alves et al results were underesti-mated as their study sample comprised military men only. Neutzling et al12 (2000), in their
population-based study similar to the present study, found 7.7% overweight and obesity. However, it should be stressed the age group range of this study was 10 to 19 years, which reduces the specificity of the study popula-tion and could explain the lower prevalence found.
As for adolescent’s schooling, it was seen a trend towards a significant negative association: those with lower schooling were more likely to be over-weight and obese, even after adjusting for age in the multivariate analysis, which corroborates Piccini’s14 findings.
Familiar transmission of obesity is a well-known event, probably due to either genetic or life style factors.15
One limitation of the present study was not to in-clude an assessment of nutritional diet of adolescents and their families, preventing further inferences on their life style. An alternative option was to assess adolescents’ description of their parents’ looks, which Table 5 - Final hierarchical model of overweight and obesity in the multivariate analysis. Southern Brazil, 2001-2002.
Levels of Vari abl e Category O verw ei ght O besity
hierarchical model PR(CI 95%) PR(CI 95%)
First level Age 15 1.16 (0.78-1.17) 1.66 (0.79-3.51)
16 1.23 (0.85-1.79) 1.07 (0.47-2.43) 17 0.99 (0.68-1.44) 0.71 (0.27-1.86)
18 Reference Reference
Adolexcent’s schooling 0 to 4 2.30 (0.82-6.44)
5 to 8 2.53 (1.32-4.85)
9 or more Reference
M other’s schooling 0 to 4 0.92 (0.63-1.32) 5 to 8 0.87 (0.65-1.17)
9 or more Reference
Second level O bese parents N one Reference Reference
O ne 1.26 (0.97-1.62) 1.97 (1.14-3.40) Both 1.44 (0.91-2.28) 2.39 (1.00-5.71) Third level Sexual maturation <11 years 1.38 (0.86-0.20)
12 to 13 years 1.19 (0.81-1.17) 14 to 18 years Reference
Fourth level D i eti ng Yes 1.72 (1.24-2.38) 3.98 (1.83-8.67)
N o Reference Reference
Skipping meals Yes 1.69 (1.29-2.21) 2.54 (1.22-5.29)
N o Reference Reference
Phisical activity outside school Yes 1.42 (1.11-1.83)
N o Reference
Watching TV (daily hours) < 2 Reference 3 to 4 0.87 (0.60-1.26) 5 to 7 0.88 (0.62-1.25) > 8 0.55(0.32-0.94)
Tobacco use Yes 0.45 (0.17-1.18)
N o Reference
M inor psychiatric disorders Yes 0.63 (0.33-1.19)
N o Reference
REFEREN CES
1. Alves SS, Silva SRC, Ribeiro RS, Vertematti AS, Fisberg M. Avaliação de atividade física, estado nutricional e condição social em adolescentes. Folha Méd. 2000;119:26-33.
2. Cole TJ, Bellizzi MC, Flegal KM, Dietz WH. Establishing a standart definition for child overweight and obesity worldwide: international survey. BMJ. 2000;320:1240-3.
3. Fisberg M. Obesidade na infância e adolescência. Pediatr Mod. 1993;29:103-8.
4. Fonseca VM, Sichieri R, Veiga GV. Fatores associados à obesidade em adolescentes. Rev Saúde Pública. 1998;32:541-9.
5. Gigante DP, Barros FC, Post CLA, Olinto MTA. Prevalência de obesidade em adultos e seus fatores de risco. Rev Saúde Pública. 1997;31:236-46. 6. Gortmaker SL, Must A, Perrin JM, Sobol AM, Dietz
W H. Social and economic consequences of overweight in adolescence and young adulthood. N Engl J Med. 1993;329:1008-12.
7. Guo SS, Chumlea WC. Tracking of body mass index in children in relation to overweight in adulthood. Am J Clin Nutr. 1999;70(Suppl):145S-8.
8. Javier Nieto F, Szklo M, Comstock GW. Childhood weight and growth rate as predictors of adult mortality. Am J Epidemiol. 1992;136:201-13.
9. Kuskowska-Wolk A, Bergstrom R. Trends in body mass index and prevalence of obesity in Swedish women 1980-89. J Epidemiol Community Health.
1993;47:195-9.
10. Mari JJ, Williams P. Misclassification by psychiatric sceening questionnaires. J Chronic Dis. 1986;39:371-8. 11. Monteiro POA, Victora CG, Barros FC, Tomasi E.
Diagnóstico de sobrepeso em adolescentes: estudo do desempenho de diferentes critérios para índice de massa corporal. Rev Saúde Pública. 2000;34:506-13. 12. Neutzling MB, Taddei JAAC, Rodrigues EM, Sigulem
DM. Overweight and obesity in Brazilian adolescents. Int J Obes Relat Metab Disord. 2000;24:869-74.
13. Oehlschlaeger MHK, Pinheiro RT, Horta B, Gelatti C, San’Tana P. Prevalência e fatores associados ao sedentarismo em adolescentes de área urbana. Rev Saúde Pública. 2004;38:157-63.
14. Piccini RX. Obesidade: construção, atividade ou educação? Rev Assoc Méd Bras. 1996;42:79-83. 15. Ravussin E, Swinburn BA. Pathophysiology of obesity.
Lancet. 1992;340:404-8.
Supported by Fundação de Apoio à Pesquisa do Estado do Rio Grande do Sul (Fapergs - Grant n. 01/1552). Based on a master’s dissertation submitted to the Universidade Católica de Pelotas in 2004.
proved to be associated to their own obesity. Those who perceived their parents as obese were 2.39 times more likely to be obese, even after controlling for age and schooling.
The younger the adolescent’s sexual maturation, the higher their prevalence of overweight and obesity, especially for girls. This association was seen in the bivariate analysis but was not there after controlling for potential confounders. The lack of consistency of these findings could suggest that the selected crite-rion of sexual maturation was not able to fully assess this variable, thus further investigation is needed.
Adolescents with minor psychiatric disorders were less likely to be obese in the multivariate analysis.
A strong association with overweight and obesity was seen among those reporting dieting, skipping meals, and physical activity outside school. This evidences
a limitation of this study design as it did not allow to determining a causal association but only to explore an association between a particular outcome and their variables without assessing risk and protection fac-tors. This association could be explained by assum-ing that overweight and obese adolescents are con-cerned about their looks and health and therefore engage in preventive behaviors. Though it is not pos-sible to verify that, these behaviors may not be ad-equate. Further studies are needed to assess these be-haviors’ significance and characteristics as, if not adequately controlled, they could aggravate these adolescents’ condition.