Dartagnan Pinto Guedes Cynthia Correa Lopes
Centro de Educação Física e Esporte. Universidade Estadual de Londrina. Londrina, PR, Brasil
Correspondence:
Dartagnan Pinto Guedes Campus Universitário – CEFE/UEL Rod. Celso Garcia Cid (PR 445) – Km 380 86051-990 Londrina, PR, Brasil E-mail: [email protected] Received: 5/21/2009 Approved: 4/12/2010
Article available from: www.scielo.br/rsp
Validation of the Brazilian
version of the 2007 Youth Risk
Behavior Survey
ABSTRACT
OBJECTIVE: To validate the psychometric properties of the Brazilian version of the 2007 Youth Risk Behavior Survey (YRBS) questionnaire.
METHODS: The original version of the 2007 YRBS was translated into Portuguese and back-translated into English. The questionnaire versions were analyzed by a committee of experts. The committee used semantic, idiomatic, cultural and conceptual equivalences as criteria of analysis. The
fi nal version of the translated 2007 YRBS questionnaire was administered in two occasions, with an interval of two weeks, in a sample of 873 high school students of both sexes, in the city of Londrina, Southern Brazil, to identify the psychometric properties. Test-retest reliability was analyzed by calculating the Kappa index of agreement and prevalence rate of each type of risk behavior when application was repeated. Chi-square test was used to identify statistical differences between the fi rst and second questionnaire applications.
RESULTS: After minor changes identifi ed in the translation process, the committee of experts concluded that the Portuguese version of the 2007 YRBS showed semantic, idiomatic, cultural and conceptual equivalences. Signifi cant differences between the prevalence rates of both applications were found in 23.4% of items. The identifi cation of 91% of items with moderate-to-substantial Kappa index of agreement and mean value of this index of 68.6% indicated the quality of psychometric properties of the Portuguese version of the 2007 YRBS.
CONCLUSIONS: The translation, cross-cultural adaptation and psychometric qualities of the 2007 YRBS questionnaire were satisfactory, thus enabling its application in epidemiological studies in Brazil.
DESCRIPTORS: Translations. Questionnaires. Adolescent Behavior. Psychometrics. Reproducibility of Results. Brazil.
INTRODUCTION
The fi rst version of the YRBS questionnaire resulted from extensive research and fi eld testing. It was used by the CDC to conduct the fi rst national survey, in 1991. Surveys are conducted biannually, the questionnaires are revised and possible changes are proposed before each data collection. In 1997, the CDC established the objectives of the Healthy People 2010 and, to guarantee the information required by this program, it suggested changes to the 1999 YRBS version, which led to the creation of 16 new questions, elimination of 11 and adaptation of other 14.3 The 2001, 2003, 2005 and 2007
versions included minor changes.
In Brazil, there is not a systematized health risk behavior surveillance program for the adolescent population. Studies concentrate results on isolated behaviors, such as alcohol and tobacco use,11,13,18,21 illicit drug use,8,15,19
dietary habits1,6,16,20 and physical activity practice.9,14,16,17
Instruments to gather information that have been standardized to the Portuguese language are not easily identifi ed. Specifi c questionnaires for each study are designed from adaptations of different instruments, which can compromise the quality of psychometric properties and hinder comparisons among studies. Carlini-Cotrin et al5 translated the 1995 YRBS
question-naire and applied it to primary education students of two 7th and 8th grade classrooms of a state school of the
city of São Paulo, Southeastern Brazil, aiming to test its clarity and adequacy. They made minor changes to adapt the questionnaire to the Brazilian context. Despite its relevance, this study did not give due attention to the methodological strictness of the process of translation and adaptation of questionnaires to other cultures. Such limitations suggest caution when using the translated and adapted questionnaire in these conditions. The present study aimed to validate the psychometric properties of the Brazilian version of the 2007 Youth Risk Behavior Survey.
METHODS
The translation and cross-cultural adaptation protocols followed the procedures suggested by Guillemin et al.10 The initial translation from the original language
(English) to Portuguese was made independently by two researchers, specialists in YRBS. These researchers spoke Portuguese as their native language and were
fl uent in English, including experiences with transla-tions of academic texts. In addition to the translation, they were requested to record expressions which could have ambiguous interpretation.
A bilingual group composed of three researchers in the area of health compared the translated texts, standard-izing the use of ambiguous expressions, and a single version of the questionnaire was designed, summarizing
the two previous versions. Next, the questionnaire was back-translated by two other translators in an indepen-dent way. The translators selected for this stage were native speakers of English and fl uent in Portuguese, working as professors in Brazilian universities. Translators were requested to record expressions that could be unclear in the back-translation process. The bilingual group compared both back-translated texts, designing one single version.
A committee analyzed the translation process and the results achieved in the previous stages. This committee was comprised of nine members, including the authors of this study, the translators who participated in the translation/back-translation process and three univer-sity professors in the area of health, all bilingual in English and Portuguese. The committee reviewed the seven available versions of the YRBS questionnaire: the original version in English, two versions translated to Portuguese, summary version of both translations to Portuguese, two back-translated versions, and summary version of both back-translations.
This committee evaluated the types of equivalences between the original questionnaire and the Portuguese version. Members received written guidance on the objective of the study and the defi nitions adopted for such equivalences. They each completed an analysis form individually, which compared each question with the respective choice of response of the original questionnaire, of the summary version translated to Portuguese and of the summary back-translated version, in terms of semantic, idiomatic, cultural and conceptual equivalences. The analysis form was struc-tured using a differential scale with discrete alterna-tives: “unaltered”, “slightly altered”, “greatly altered” and “completely altered”.
The Portuguese version of the questionnaire was tested, aiming to investigate the diffi culties and suggestions of adolescents in terms of their understanding of ques-tions. Authors of this study applied the questionnaire experimentally to 140 adolescents aged between 14 and 18 years (81 females and 59 males), who were secondary education students of schools of Londrina, Southern Brazil, in April 2007. The results were considered after a new evaluation by the bilingual analysis committee members.
was obtained through a cluster probabilistic process, using the number of students, in terms of sex, age, school grade and period in which they were enrolled, in each school, as reference. The sample size was established, including 50% prevalences, 95% confi dence intervals (95% CI), 3% sampling error and an additional 10% for possible refusals and losses during data collection. The design effect of the sample (DEFF) was defi ned at 1.5, predicting a minimum sample of 820 students. The
fi nal sample was comprised of 873 adolescents. Data were collected between August and November 2007. Demographic characteristics are shown in Table 1. The classroom selected was visited by researchers and the research objectives and principles of confi dentiality, anonymity and non-infl uence on school performance were clarifi ed to students.
The classroom was revisited and the students who handed in the signed informed consent form received an envelope containing two copies of the Portuguese version of the 2007 YRBS questionnaire with the same codifi cation. Students took one copy of the question-naire, wrote their respective names on the outer side of the envelope and returned it to the researchers who followed the application. Next, they received instruc-tions on how to self-complete the questionnaire and information about researchers’ availability to clarify any questions. After completing and returning the codifi ed questionnaires, they were put in a ballot box with the remaining ones.
After 14 days, the application of the questionnaire was repeated. The classroom was revisited and students who participated in the study received the envelope with their name and were instructed to take out the questionnaire, tear it and throw away the envelope. The following instructions were identical to those given in the fi rst application.
In the analysis of reproducibility, the following two procedures were used: the calculation of the traditional kappa agreement index and prevalence rates of the fi rst and second questionnaire applications. Calculation of the kappa agreement index, followed by the respective 95% CI, was determined for each of the questionnaire items, except for items 6 and 7, classifi ed as numerical variables, which resulted in the calculation of the intraclass correlation coeffi cient. Agreement among groups of items of the Portuguese version of the 2007 YRBS, according to demographic indicators, reference period of time and risk behavior category, was analyzed using median and mean values of kappa indices. Prevalence rates of the fi rst and second applications were determined from one of the choices of responses to each questionnaire item, following the YRBS meth-odological recommendations to divide responses into “with risk” and “without risk”.4 Statistical differences
between the prevalence rates of the fi rst and second
applications were estimated using the chi-square test (χ2). Data were analyzed with the SPSS statistical
package, version 15.0.
The present study was approved by the Human Research Ethics Committee of the Universidade Estadual de Londrina (Offi cial Opinion 073/07).
RESULTS
Minor divergences in the use of expressions were found in the stages of the translation process. These diver-gences were discussed by the analysis committee and the expressions that were more easily understood and more frequently used among adolescents were main-tained to facilitate understanding. When establishing questions whose literal translation raised doubts about the use of the expression “quão freqüentemente” [“how often”], which is grammatically correct in Portuguese, although rarely used by adolescents, the expression “com que frequência” was chosen. The diffi culties and
Table 1. Demographic characteristics of the sample used in the study. City of Londrina, Southern Brazil, 2007. (n = 873)
Variable n Proportion of distribution (%) Sex
Female 469 53.7
Male 404 46.3
Period of study
Day-time 560 64.1
Night-time 313 35.9 Secondary school grade
First 305 34.9
Second 274 31.4
Third 294 33.7
Age group (years)
14 to 17 678 77.7 > 17 195 22.3 Socioeconomic level
A (high) 70 8
B 453 51.9
C 306 35.1
D (low) 44 5
Ethnicity
White 637 72.9
Black 200 22.9
Others 36 4.2
Paid work
Table 2. Adjusted items in the Portuguese version of the 2007 YRBS. City of Londrina, Southern Brazil, 2007. Item Original version Translated version
3 What grade are you in (7th grade 3th grade) Grade according to the Brazilian school system (5th grade 3th grade)
4 Are you Hispanic or Latino? Are you a foreigner?
5
What is your ethnic group? (American Indian or Alaska Native; Asian; Black or African American; Native Hawaiian
or Other Pacifi c Islander; White.
Ethnicity: White, Black, Japanese, Indigenous; and Others: _ Which?
6 and 7
Tables with fi gures available to indicate the measures of body weight and height
Replaced by spaces in front of the words “weight” and “height” to record the measurements
17 Objects stolen or deliberately damaged on school property: car, clothing, or books
Objects common to Brazilian adolescents were included: motorcycle, bike, skate, skateboard, tennis shoes, watch, mobile phone, CD, disc-man.
24 Suicide The expression “kill yourself” in brackets was added to illustrate suicide.
36 Tobacco trademarks: Redman, Levi Garrett, Beechnut, Skoal, Skoal Bandits, or Copenhagen.
Tobacco brands marketed in the United States were excluded.
51 Slang expression “high” Replaced by the expression “ligado”.
52 Common expressions relating to heroin: smack, junk or
China White. Expressions were excluded.
53 Common expressions relating to methamphetamines:
speed, crystal, crank or ice. Expressions were excluded. 54 Expression for ecstasy – MDMA Replaced by the expression “love drug”.
55 Expression “steroid pills” Replaced by the expression “anabolic-androgenic steroid”.
63 and
64 Condom
The word “camisinha” in brackets was included to illustrate condom.
70 North American product Slim Fast. Expression was excluded.
72 Examples of juices: orange juice, apple juice, or grape
juice. Examples were excluded.
78 Soda or pop The words “Fanta” and “Tubaína” were included.
suggestions reported by the group of adolescents did not require changes.
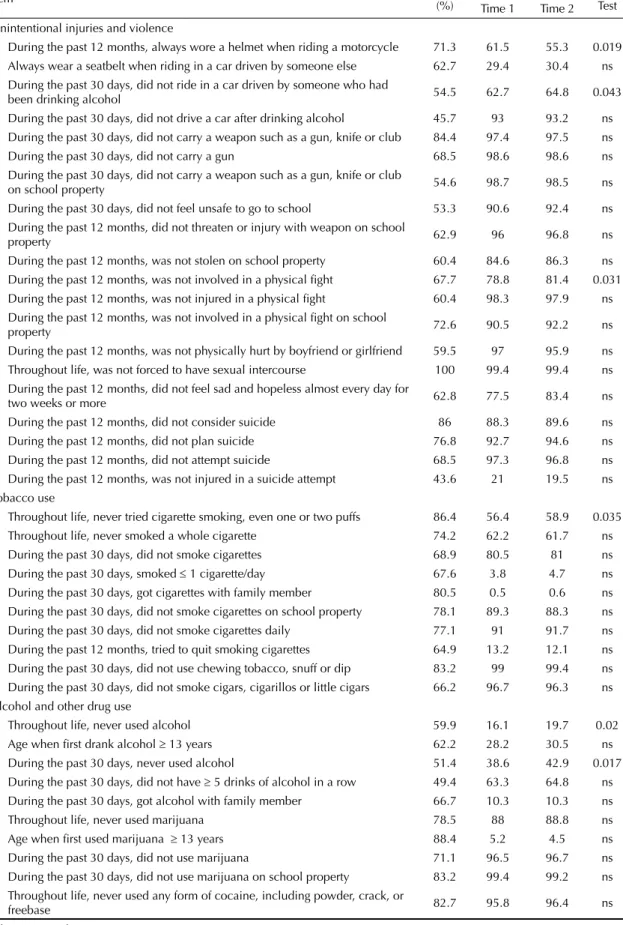
Of all the 87 items that comprise the YRBS, 79% of them were indicated as “unaltered” by the analysis committee, in terms of semantic, idiomatic, cultural and conceptual equivalences. The remaining 21% were indicated by this committee as having at least one of the equiva-lences “slightly altered”. Table 2 shows the summary of the adjustments made to these items. No items of the translated version of the 2007 YRBS questionnaire had the “greatly altered” or “completely altered” choices marked, when compared to the original version. The statistical indicators associated with the psycho-metric properties are shown in Table 3. Kappa agree-ment index varied from 31.6% to 100%, with a mean value of 68.6% and median of 68.5%. According to the qualitative considerations suggested by Landis & Koch,12 68.3% of the items achieved at least
“substan-tial” reproducibility (kappa≥61%), and 90.6% achieved at least “moderate” reproducibility (kappa≥41%). A total of eight items (9.4%) showed a kappa agreement index<41%. Based on the χ2 test, 23.4% of the items
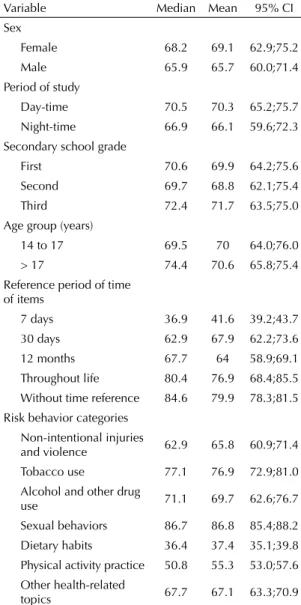
“30 days” and “12 months” had similar kappa scores, whereas those with periods of time equivalent to “throughout life” and “without time reference” showed the highest kappa index scores.
Dietary habits and physical activity practice showed kappa index scores signifi cantly lower than those of the remaining categories. The sexual behavior category achieved the highest kappa score, followed by tobacco use, alcohol and other drug use, other health-related topics and non-intentional injuries and violence. Of all items that mention a period of time equivalent to “seven days”, eight refer to dietary habits and two to physical activity practice. Except for the reference period of time of “seven days”, dietary habits and physical activity practice, groups showed scores equivalent to substantial kappa indices (≥ 61%).
DISCUSSION
The process of questionnaire translation did not present diffi culties due to the methodology adopted and the simple and objective structure of the 2007 YRBS items. The initial translation made by two transla-tors was slightly changed in the subsequent stages. The back-translation, when compared to the original questionnaire, showed minor discrepancies, resulting from the adjustments made to meet the specifi cations of certain items. The analysis of semantic, idiomatic, cultural and conceptual equivalences, comparable to the cross-cultural adaptation, such as the translation stage, indicated that the questionnaire was easily translated. The analysis of equivalences showed that the 2007 YRBS domains are appropriate and the attributes used in the original version of the questionnaire are equally valid for the target culture, which meets the cultural equivalence. The conceptual equivalence indicated that few items required adjustments. Items could be considered in a way similar to the original format, once again showing that the structure of development of 2007 YRBS items was well designed. With regard to the idiomatic equivalence, the translated version revealed that approximately 80% of the questions were evaluated as “unaltered” and the remaining ones as “slightly altered” between the original and back-translated versions of the questionnaire. None of the analysis committee members considered any items as “slightly altered”, when the original, translated and back-translated questionnaire versions were compared, thus suggesting semantic equivalence.
Brener et al2 administered the 1991 YRBS version to
American students in two occasions, with an interval of 14 days. The results indicated kappa agreement index scores between 14.5% and 91.1%, with 72% of items showing kappa≥61%. There were no signifi cant differences between the prevalences of repetitions
of questionnaire application. In this same study, the analysis of age group showed that better consistency of responses was found among adolescents aged≥12 years. A study with a similar design, involving the 1999 YRBS,3 was performed, with results showing
kappa index scores between 23.6% and 90.5%, a mean of 60.7%, and 47.2% of items with kappa ≥ 61%. Approximately 22% of items showed statistically signifi cant differences between the prevalences of the
fi rst and second questionnaire applications.3
The kappa agreement index in the second application of the Portuguese version of the questionnaire indicated from moderate to substantial reproducibility in the majority of items. The proportion of 68.3% of items with kappa agreement index ≥ 61% was lower than that found in the analysis of the 1991 YRBS (72%) and higher than that found in the analysis of the 1999 YRBS (47.2%). This suggests that this proportion is within the expected limit. Brenner et al2,4 considered
the kappa values of the studies as adequate for instru-ments such as questionnaires. The mean kappa index found in the translated 2007 YRBS (68.6%) was higher than the mean of kappa index of the original version of the 1999 YRBS (60.7%). Data from the original version of the translated 1999 YRBS and 2007 YRBS were similar: 23.4% of the items of the 2007 YRBS in Portuguese and 22% of the items of the 1999 YRBS in the original version showed signifi cant differences between the prevalences of the fi rst and second applica-tions. The items that had signifi cant differences between the prevalence rates of the repetitions of questionnaire application and kappa agreement index < 61% showed questionable reproducibility. Thus, caution is required when interpreting this information.
Table 3. Kappa agreement index and prevalence rates of applications of the Portuguese version of the 2007 YRBS questionnaire. City of Londrina, Southern Brazil, 2007.
Item Kappa
(%)
Prevalence Rates (%) χ2
Test Time 1 Time 2 Unintentional injuries and violence
During the past 12 months, always wore a helmet when riding a motorcycle 71.3 61.5 55.3 0.019 Always wear a seatbelt when riding in a car driven by someone else 62.7 29.4 30.4 ns During the past 30 days, did not ride in a car driven by someone who had
been drinking alcohol 54.5 62.7 64.8 0.043 During the past 30 days, did not drive a car after drinking alcohol 45.7 93 93.2 ns During the past 30 days, did not carry a weapon such as a gun, knife or club 84.4 97.4 97.5 ns During the past 30 days, did not carry a gun 68.5 98.6 98.6 ns During the past 30 days, did not carry a weapon such as a gun, knife or club
on school property 54.6 98.7 98.5 ns
During the past 30 days, did not feel unsafe to go to school 53.3 90.6 92.4 ns During the past 12 months, did not threaten or injury with weapon on school
property 62.9 96 96.8 ns
During the past 12 months, was not stolen on school property 60.4 84.6 86.3 ns During the past 12 months, was not involved in a physical fi ght 67.7 78.8 81.4 0.031 During the past 12 months, was not injured in a physical fi ght 60.4 98.3 97.9 ns During the past 12 months, was not involved in a physical fi ght on school
property 72.6 90.5 92.2 ns
During the past 12 months, was not physically hurt by boyfriend or girlfriend 59.5 97 95.9 ns Throughout life, was not forced to have sexual intercourse 100 99.4 99.4 ns During the past 12 months, did not feel sad and hopeless almost every day for
two weeks or more 62.8 77.5 83.4 ns
During the past 12 months, did not consider suicide 86 88.3 89.6 ns During the past 12 months, did not plan suicide 76.8 92.7 94.6 ns During the past 12 months, did not attempt suicide 68.5 97.3 96.8 ns During the past 12 months, was not injured in a suicide attempt 43.6 21 19.5 ns Tobacco use
Throughout life, never tried cigarette smoking, even one or two puffs 86.4 56.4 58.9 0.035 Throughout life, never smoked a whole cigarette 74.2 62.2 61.7 ns During the past 30 days, did not smoke cigarettes 68.9 80.5 81 ns During the past 30 days, smoked ≤ 1 cigarette/day 67.6 3.8 4.7 ns During the past 30 days, got cigarettes with family member 80.5 0.5 0.6 ns During the past 30 days, did not smoke cigarettes on school property 78.1 89.3 88.3 ns During the past 30 days, did not smoke cigarettes daily 77.1 91 91.7 ns During the past 12 months, tried to quit smoking cigarettes 64.9 13.2 12.1 ns During the past 30 days, did not use chewing tobacco, snuff or dip 83.2 99 99.4 ns During the past 30 days, did not smoke cigars, cigarillos or little cigars 66.2 96.7 96.3 ns Alcohol and other drug use
Throughout life, never used alcohol 59.9 16.1 19.7 0.02 Age when fi rst drank alcohol ≥ 13 years 62.2 28.2 30.5 ns During the past 30 days, never used alcohol 51.4 38.6 42.9 0.017 During the past 30 days, did not have ≥ 5 drinks of alcohol in a row 49.4 63.3 64.8 ns During the past 30 days, got alcohol with family member 66.7 10.3 10.3 ns Throughout life, never used marijuana 78.5 88 88.8 ns Age when fi rst used marijuana ≥ 13 years 88.4 5.2 4.5 ns During the past 30 days, did not use marijuana 71.1 96.5 96.7 ns During the past 30 days, did not use marijuana on school property 83.2 99.4 99.2 ns Throughout life, never used any form of cocaine, including powder, crack, or
freebase 82.7 95.8 96.4 ns
Table 3 continuation
Item Kappa
(%)
Prevalence Rates (%) χ2
Test Time 1 Time 2 During the past 30 days, did not use any form of cocaine, including powder,
crack, or freebase 76.8 98.7 99.1 ns
Throughout life, never used inhalants 75.1 95.7 96.6 ns Throughout life, never used heroin 85.7 99.5 99.6 ns Throughout life, never used methamphetamines 82.2 98.5 98.6 ns Throughout life, never used ecstasy 85.6 98.3 98.3 ns Throughout life, never used steroid pills or shots without doctor´s prescription 66.4 98.1 98.2 ns Throughout life, never injected illegal drugs 66.6 99.4 99.8 ns During the past 12 months, nobody offered, sold, or gave illegal drugs on
school property 42.8 92.8 92.3 ns
Sexual behaviors
Never had sexual intercourse 95.6 46.8 47.3 ns Age when fi rst had sexual intercourse ≥ 13 years 81 7.9 7.7 ns Throughout life, had ≤ 3 lifetime sex partners 86.7 10.4 10.4 ns During the past 3 months, had only one sex partner 82.7 22.2 20.3 ns Last time one had sexual intercourse, did not drink alcohol or use drugs 85.9 37 37.1 ns Last time one had sexual intercourse, used a condom 89.1 30.5 30.6 ns Last time one had sexual intercourse, used a method to prevent pregnancy 87.5 7.4 7.5 ns Body weight and dietary behaviors
Favorable perception of body weight 84 38.3 40.9 0.042 Trying to lose body weight 74.7 13.8 15.8 ns During the past 30 days, did not exercise to lose or keep from gaining body
weight 67.6 56.1 58.6 0.036
During the past 30 days, did not eat less food, calories, or fat to lose or keep
from gaining body weight 67.8 66.4 70.8 0.015 During the past 30 days, did not fast to lose or keep from gaining body weight 63.9 93.6 94.3 ns During the past 30 days, did not take diet pills, powders, or liquids to lose or
keep from gaining weight 56.8 96 96.6 ns During the past 30 days, did not vomit or took laxatives to lose or keep from
gaining body weight 77.7 96.6 96.7 ns
During the past 7 days, did not drink 100% fruit juice 36.2 39.8 33.2 0.002 During the past 7 days, did not eat fruits 32.2 19 17.3 ns During the past 7 days, did not eat green salads 39.8 18.1 19.8 ns During the past 7 days, did not eat potatoes 31.6 41.5 32.6 0.001 During the past 7 days, did not eat carrots 45.1 61 55.7 0.032 During the past 7 days, did not eat other vegetables 33.8 39.3 39.9 ns During the past 7 days, did not drink soda or pop 36.5 9.1 8.2 ns During the past 7 days, did not drink milk 44.3 18.2 19.5 ns Physical activity
During the past 7 days, were not physically active ≥ 60 minutes/day 37.2 32.7 33.5 ns On an average school day, did not watch television 50.8 15.3 15.9 ns On an average school day, did not play video or computer games 50.1 30.3 31.2 ns Did not attend physical education class in school 79 4.1 2.7 ns During the past 12 months, did not play in a sports team 59.5 40.3 44.2 0.039 Other health-related topics
of repetitions of questionnaire application and kappa index < 61%, more than half of the items were associ-ated with dietary habits, physical activity practice and other health-related topics.
The analysis of reproducibility of the original version of the 1999 YRBS and translated 2007 YRBS were
expected to indicate lower agreement between repeti-tions of questionnaire application for items associated with dietary habits, physical activity practice and other health-related topics. Behavior related to use of substances, such as tobacco, alcohol and drugs; sexual activity; and behavior that involves rebelliousness, such as reckless driving and violence, can be more prevalent and considered to have greater importance in adolescents than behaviors associated with routine (dietary habits and physical activity practice). The low kappa index scores (< 41%) and the inconsistency among prevalence rates of repetitions of questionnaire application can refl ect behavioral changes in the period of 14 days. Adolescents aged more than 17 years, who went to school during the day, showed higher kappa index scores than those of adolescents aged between 14 and 17 years, who went to school in the evening. Studies involving the YRBS indicated greater reproducibility in older adolescents.2,3 With regard to the period of
study, there appear to be differences between secondary education students who were in day-time schools and those in night-time schools, as a result of paid work performed by these students. In the sample selected for the present study, 22.1% of students who went to school during the day reported performing a certain type of paid job, compared to the 64.9% of students who went to school in the evening, of which 37% performed work full-time (40 hours/week). Night-time students are older and, due to their being in the job market, they remain closer to a non-familial adult environment, have some independence, and can behave in a less usual way, thus having an infl uence on the change of behaviors in relatively short periods of time, such as the 14-day interval between questionnaire applications.
The Portuguese version of the 2007 YRBS was found to be a questionnaire capable of gathering information about health risk behaviors in Brazilian adolescents. The methodology of translation adopted enabled it to have quality and safety. The simple and objective structure of design of items of the original 2007 YRBS version contributed to the success of this stage. The cross-cultural adaptation showed that the domains dealt with by the questionnaire are suitable for the Brazilian adolescents’ culture and that certain items needed minor adjustments. The identifi cation of the psychometric properties of the Portuguese version of the 2007 YRBS indicated high reproducibility of items.
Table 4. Median and mean values and 95% confi dence intervals of kappa agreement indices of groups of items of the Portuguese version of the 2007 YRBS, according to demographic indicators, reference period of time and risk behavior category. City of Londrina, Southern Brazil, 2007.
Variable Median Mean 95% CI Sex
Female 68.2 69.1 62.9;75.2 Male 65.9 65.7 60.0;71.4 Period of study
Day-time 70.5 70.3 65.2;75.7 Night-time 66.9 66.1 59.6;72.3 Secondary school grade
First 70.6 69.9 64.2;75.6 Second 69.7 68.8 62.1;75.4 Third 72.4 71.7 63.5;75.0 Age group (years)
14 to 17 69.5 70 64.0;76.0 > 17 74.4 70.6 65.8;75.4 Reference period of time
of items
7 days 36.9 41.6 39.2;43.7 30 days 62.9 67.9 62.2;73.6 12 months 67.7 64 58.9;69.1 Throughout life 80.4 76.9 68.4;85.5 Without time reference 84.6 79.9 78.3;81.5 Risk behavior categories
Non-intentional injuries
and violence 62.9 65.8 60.9;71.4 Tobacco use 77.1 76.9 72.9;81.0 Alcohol and other drug
use 71.1 69.7 62.6;76.7 Sexual behaviors 86.7 86.8 85.4;88.2 Dietary habits 36.4 37.4 35.1;39.8 Physical activity practice 50.8 55.3 53.0;57.6 Other health-related
1. Andrade RG, Pereira RA, Sichieri R. Consumo alimentar de adolescentes com e sem sobrepeso do município do Rio de Janeiro. Cad Saude Publica. 2003;19(5):1485-95. DOI:10.1590/S0102-311X2003000500027
2. Brener ND, Collins JL, Kann L, Warren CW, Williams BI. Reliability of the Youth Risk Behavior Survey Questionnaire. Am J Epidemiol. 1995;141(6):575-80.
3. Brener ND, Kann L, McManus T, Kinchen SA, Sundberg EC, Ross JG. Reliability of the 1999 Youth Risk Behavior Survey Questionnaire. J Adolesc Health. 2002;31(4):336-42. DOI:10.1016/S1054-139X(02)00339-7
4. Brener ND, Kann L, Kinchen SA, Grunbaum JA, Whalen L, Eaton D, et al. Methodology of the Youth Risk Behavior Surveillance System. MMWR Recomm Rep. 2004;53(RR-12):1-13.
5. Carlini-Cotrim B, Gazal-Carvalho C, Gouveia N. Comportamentos de saúde entre jovens estudantes das redes pública e privada da área metropolitana do Estado de São Paulo. Rev Saude Publica. 2000;34(6):636-45. DOI:10.1590/S0034-89102000000600012
6. Dalla Costa MC, Cordoni Jr L, Matsuo T. Hábito alimentar de escolares adolescentes de um município do oeste do Paraná. Rev Nutr. 2007;20(5):461-71. DOI:10.1590/S1415-52732007000500002
7. Eaton DK, Kann L, Kinchen S, Shanklin S, Ross J, Hawkins J, et al. Youth risk behavior surveillance--United States, 2007. MMWR Surveill Summ.
2008;57(4):1-131.
8. Galduróz JCF, Noto AR, Nappo SA, Carlini EA. Trends in drug use among students in Brazil: analysis of four surveys in 1987, 1989, 1993 and 1997. Braz J Med Biol Res. 2004;37(4):523-31. DOI:10.1590/S0100-879X2004000400009
9. Guedes DP, Guedes JERP, Barbosa DS, Oliveira JA. Níveis de prática de atividade física habitual em adolescentes. Rev Bras Med Esporte. 2001;7(6):187-99. DOI:10.1590/S1517-86922001000600002
10. Guillemin F, Bomabardier C, Beaton D. Cross-cultural adaptation of health-related quality of life measures: literature review and proposed guidelines. J Clin Epidemiol. 1993;46:1417-32. DOI:10.1016/0895-4356(93)90142-N
11. Horta RL, Horta BL, Pinheiro RT, Morales B, Strey MN. Tabaco, álcool e outras drogas entre adolescentes em Pelotas, Rio Grande do Sil, Brasil: uma perspectiva
de gênero. Cad Saude Publica. 2007;23(4):775-83. DOI:10.1590/S0102-311X2007000400005
12. Landis JR, Koch GG. The measurement of observer agreement for categorical data. Biometrics. 1997;33(1):159-74. DOI:10.2307/2529310
13. Machado Neto AS, Cruz AA. Tabagismo em amostra de adolescentes escolares de Salvador – Bahia. J Pneumol. 2003;29(5):264-72. DOI: 10.1590/S0102-35862003000500004
14. Matsudo SMM, Araújo TL, Matsudo VKR, Andrade DR, Vaquer W. Nível de atividade física em crianças e adolescentes de diferentes regiões de desenvolvimento.
Rev Bras Ativ Fis Saude. 1998;3(4):14-26.
15. Muza GM, Bettiol H, Muccillo G, Barbieri MA. Consumo de substâncias psicoativas por adolescentes escolares de Ribeirão Preto, SP (Brasil). I – Prevalência do consumo por sexo, idade e tipo de substância. Rev Saude Publica. 1997;31(1):21-9. DOI:10.1590/S0034-89101997000100005
16. Nunes MMA, Figueiroa JN, Alves JGB. Excesso de peso, atividade física e hábitos alimentares entre adolescentes de diferentes classes econômicas em Campina Grande (PB). Rev Assoc Med Bras. 2007; 53(2):130-4. DOI:10.1590/S0104-42302007000200017
17. Silva RCR, Malina RM. Nível de atividade física em adolescentes do município de Niterói, Rio de Janeiro, Brasil. Cad Saude Publica. 2000;16(4):1091-7. DOI:10.1590/S0102-311X2000000400027
18. Souza DPO, Silveira Filho DX. Uso recente de álcool, tabaco e outras drogas entre estudantes adolescentes trabalhadores e não trabalhadores. Rev Bras Epidemiol. 2007;10(2):276-87. DOI:10.1590/S1415-790X2007000200015
19. Tavares BF, Béria JU, Lima MS. Fatores associados ao uso de drogas entre adolescentes escolares. Rev Saude Publica. 2004;38(6):787-96. DOI:10.1590/S0034-89102004000600006
20. Toral N, Slater B, Cintra IP, Fisberg M. Comportamento alimentar de adolescentes em relação ao consumo de frutas e verduras. Rev Nutr. 2006;19(3):331-40. DOI:10.1590/S1415-52732006000300004
21. Vieira PC, Aerts DRGC, Freddo SL, Bittencourt A, Monteiro L. Uso de álcool, tabaco e outras drogas por adolescentes escolares em município do sul do Brasil. Cad Saude Publica. 2008;24(11):2487-98. DOI:10.1590/S0102-311X2008001100004 REFERENCES