Brazilian Journal of Political Economy, vol. 27, nº 2 (106), pp. 281-300, April-June/2007
Building-up influence: post-war industrialization
in the State of Minas Gerais, Brazil
EDUARDO A. HADDAD GEOFFREY HEWINGS FERNANDA LEON RAUL CRISTOVÃO DOS SANTOS*
This paper examines the post-War industrialization process in the Brazilian Sta-te of Minas Gerais, focusing on one of its desirable outcomes, namely the capacity to generate growth through the impact of strong input-output linkages. This pro-cess is placed into historical perspective considering the ideas that permeate the economic development debate throughout the period of analysis. Changes in the regional economic structure are assessed through the use of three input-output tables for the years of 1953, 1980 and 1995. By adopting the fields of influence methodology as the analytical core, it is shown that the efforts towards the cre-ation of a more integrated regional economy have generated stronger influence of the targeted sectors (metal products, transportation equipment, chemical, and services). However, structural changes also contributed to strengthen leakage in the system originated in traditional economic activities.
Key-words: input-output; development policies; structural analysis; Minas Ge-rais economy.
JEL classification: C67, R58, O18
INTRODUCTION
Post-War industrialization in Brazil has benefited to a great extent from import substitution policies. Although external economies tended to concentrate industrial activity in the State of São Paulo and the Federal District, spillover
effects have contributed to the spread of complementary activities to the peripheral areas. The State of Minas Gerais, located at the outskirts of the economic gravity center, was left with the role of an intermediate goods’ suppeier. Endowed with abundant mineral resources and an incipient metallurgic industry that prospered during the War years, the State economy was given a first push towards the restructuring of its manufacturing sector.1
Since then, throughout the last fifty years, a series of structural changes has occurred, which helped to shape the State economic structure. A stronger interference of public authorities in the development process up to the early 1980s, and a somehow greater commitment to market forces, since then imposed, among other things, by the national strategy of increasing international competitiveness and the generalized fiscal crisis, regional industrial policy has nonetheless consistently required government intervention in Minas Gerais. The role of State government has been prominent since the World War II, based on a large bureaucratic apparatus.
The prestige of the development literature in the post-War period has led policy makers to incorporate its main beliefs in their development plans. The concepts of growth poles and linkages have received special attention. The idea of an industry or group of related industries, with the capacity to generate growth through the impact of strong input-output linkages, seduced the technocracy everywhere. Being translated into an effective interventionist instrument of regional policy, the concept of pôle de croissanceneeded to be examined through the nature of industry’s input-output linkages and the potential size of the stimulus – multiplier effects – associated with the industry (Temple, 1994). Thus, industrialization experiences aiming at inducing the creation of linkages spread across the developing world (Higgins and Savoie, 1995).
In this paper, Minas Gerais’ experience is revisited through stylized facts from its industrialization process in the last fifty years. Many of the common features of post-War development policies in Third World countries are richly represented by the mineiro case. The remainder of the paper is organized as follows: in the next section, a brief historical overview is provided in order to introduce some stylized facts; then, a brief overview of structural changes in the economy is presented to reinforce the increasing role of the manufacturing sector, followed by a discussion of fields-of-influence-related methods, which will permeate the discussion of industrial policies in Minas Gerais. The following section examines structural changes in the State economy, considering changes in its production linkage structure over time. Final remarks follow.
HISTORICAL BACKGROUND
The State of Minas Gerais witnessed considerable growth in its manufacturing sector during the post-War years. In the 1950s, Minas Gerais economy was concentrated mainly in traditional sectors, such as agriculture, food products and textiles. The presence of abundant natural resources and an existing industrial structure, based on the metal (Belgo Mineira, Acesita, CVRD) and electricity sectors (CEMIG), helped to foster development in the region. Immediately after the War, massive flows of public investments were directed to the State in order to reinforce the productive structure and generate complementary inputs to the private sector. Public investments in social overhead capital and directly productive activities created the conditions to consolidate the increasingly prominent role played by the State of Minas Gerais in the Brazilian Federation.
Already in the 1970s, the idea of complementarity between public and private capitals achieved its zenith, translated into a new cycle of public investments under the II Development National Plan (II PND). The political atmosphere was favoring strong government intervention. Brazil was governed by a military dictatorship, whose ideology readopted the 1930s import substitution strategy. Investments were driven for intermediate and base industries, with the goal of providing domestic supply of otherwise imported products and achieve a more integrated industrial structure. The II PND consisted in a series of investments plans prioritizing basic industry projects as well as the expansion and improvement of the economic infrastructure of the country. Given the oil crisis in the early 1970s, special attention was directed to energy issues. Moreover, in the pace of the import substitution process verified in the previous decades, the Plan tried to promote, at such time, the national production of consumer durable goods, capital goods, and basic inputs to production. This reorientation made use of important institutional instruments such as fiscal incentives, government expenditures and public financing.2
The State of Minas Gerais was particularly benefited during the implementation of the II PND, in which a spurt of investment in the industrial sector was targeted to the region. More specifically, while investments in the metallurgy sector were primarily directed towards projects to expand the existing capacity, investments in the capital goods sector and the consumer durable goods sector contemplated new plants in Minas Gerais, such as the FIAT automobile plant.
Government intervention, through a planned industrial policy, was very active, making intensive use of fiscal incentives to attract new activities within the state borders. In addition to that, a strong bureaucratic apparatus was mobilized in order to provide guidance to investments in the region. Systematic analyses and evaluation of Minas Gerais’ economic structure were often carried out up to the early 1980s, recommending changes in its structure and means for achieving them. Planning
became a major part of the State strategy for economic development, culminating in the 1970s with the implementation of two Regional Development Plans (1972-1976 and (1972-1976-1979), in which special incentive programs were designed to promote key industrial activities. Favored industries were given special treatment under Law 5261/69, which consisted of tax incentives to manufacturing firms. Table 1 indicates the number of projects, by sector, benefited by Law 5261/69, in the 1970-1975 period. Noteworthy is the share of projects related to the production of intermediate goods (non-metallic minerals, metal products, and chemicals), which accounted for most of the investments. From the 278 projects contemplated by this law, the average share of third part resources was higher in those related to intermediate production activities (60.05%), followed by capital and durable goods (50.04%), and traditional and non-durable goods (31.05%).
Table 1: Distribution of Projects Contemplated by Law 5261/69, by Sector: 1970-1975
Sector # of Projects Investment (%)
Non-metallic Minerals 37 9.27
Metal Products 64 62.45
Machinery 18 3.65
Electrical Equipment 12 1.04
Transportation Equipment 7 9.53
Wood and Furniture 10 0.08
Paper and Publishing 13 1.66
Rubber 5 0.08
Chemicals and Pharmaceuticals 19 3.94
Textiles 22 2.48
Clothing and Footwear 17 1.01
Food Products 40 3.99
Other Manufacturing Products 14 0.82
Source: João Pinheiro Foundation.
Increasing State investments have positively impacted Minas Gerais, as can be seen from its share in national GDP. It rose from approximately 9% in the late 1950s, to around 10.5% in the early 1980s.
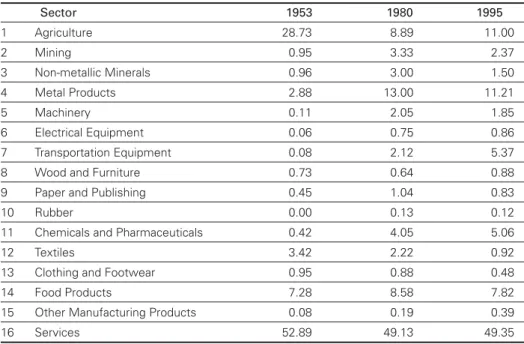
Table 2 presents the relative distribution of Minas Gerais’ output, by sector, for 1953, 1980, and 1995, respectively. In 1953, the dominant role of agriculture (28.73%) stands out vis-à-vis its declining prominence in 1980 and 1995; specialization in traditional manufacturing activities, such as textiles and food products, is also apparent.
of such industries in the State. It is interesting to point out that the increasing weights of metal products, and chemicals and pharmaceuticals, on one hand, and transportation equipment, on the other, are heavily influenced by the adoption of special incentive programs in the region, throughout the first period (1953-1980). In the second period (1980-1995), the continuing increase in the share of the transportation equipment sector reflects the process of technological change in the sector, whose production processes shifted towards managerial methods, relying more and more in regional suppliers.
Over time, the increasing role of the manufacturing sector is evident: while, in 1953, industrial production was responsible for only 18.38% of total output; in 1995, its share accounted for almost 40% of the State’s gross output.
Table 2: Sectoral Share in Gross Output (%)
Sector 1953 1980 1995
1 Agriculture 28.73 8.89 11.00
2 Mining 0.95 3.33 2.37
3 Non-metallic Minerals 0.96 3.00 1.50
4 Metal Products 2.88 13.00 11.21
5 Machinery 0.11 2.05 1.85
6 Electrical Equipment 0.06 0.75 0.86
7 Transportation Equipment 0.08 2.12 5.37
8 Wood and Furniture 0.73 0.64 0.88
9 Paper and Publishing 0.45 1.04 0.83
10 Rubber 0.00 0.13 0.12
11 Chemicals and Pharmaceuticals 0.42 4.05 5.06
12 Textiles 3.42 2.22 0.92
13 Clothing and Footwear 0.95 0.88 0.48
14 Food Products 7.28 8.58 7.82
15 Other Manufacturing Products 0.08 0.19 0.39
16 Services 52.89 49.13 49.35
Source: Authors’ calculations.
Restructuring of operations was also an important feature of the mineira
After 1988, with the new Constitution, the central government was hampered by a profound loss in its revenues to the state and municipal governments. Nevertheless, the fiscal crisis reached all levels of government, decreasing their financial capability for carrying out new investment ventures and resulted in the end of government’s investment cycle in Minas Gerais. In addition to that, in the 1990s, the Brazilian government adopted a more market-oriented policy with the introduction of a trade liberalization process, but it is worth noting that the target sectors in II PND have consolidated Minas Gerais’ share in national GDP.
The next section discusses the fields of influence methodology, which is employed to study structural changes in the Minas Gerais economy during the period.
FIELDS OF INFLUENCE: TOWARDS A COLLAPSED METHODOLOGY
The study of the propagation of structural changes in regional economic systems has received renewed attention in the last years. In the input-output literature, the two main streams of research consider either the combined elements of different input-output systems, incorporating a disequilibrium component in one of the systems, or the intertemporal comparison of isolated structures in equilibrium. The latter and more traditional approach develops and utilizes methods of key sector analysis in an attempt to uncover similarities and differences in the structure of the regional economies over time. By exploring different methods of comparative structure analysis, it is hoped that the complementarity among them might result in a better appreciation of the full dimensions of differences and similarities that might exist. The other approach provides a range of alternative combinations reflecting differential technological hypotheses within an economy based on existing input-output tables for a given region. This method, based on the principles of qualitative or structural sensitivity analysis,3incorporates specific
information to the model’s results, which contributes to increased robustness through the use of possible structural scenarios. It may also contemplate analytically important elements in the regional economic structure by considering small changes in specific cells or group of cells.
In this context, the field of influence theory has been gaining strength as a way of collapsing both approaches within a common analytical framework. It provides ways of interpreting structural changes both through equilibrium and disequilibrium starting points.
In what follows, selected methods representing both approaches are presented, and then applied to the Minas Gerais regional purchase coefficients tables, in order to highlight and evaluate structural changes in the State economy and the industrialization process described in the previous sections. The choice of the methods described below does not aim to be exhaustive, but only to illustrate different approaches sharing a common analytical hypothesis, namely, that of influential coefficients.
Equilibrium-based methods
Equilibrium-based methods, as suggested above, consider the existing structure of the economy and its underlying backward and forward linkages. These methods were extensively used in key sector analysis, and are still very popular. The most widely employed technique is the so-called Rasmussen-Hirschman indexes, whose properties are grasped in the Multiplier Product Matrix (MPM) approach, which adds nice visualization properties to understand structural changes.
Rasmussen-Hirschman indexesRasmussen (1956) and Hirschman (1958) proposed the use of two indexes to capture the effects of backward and forward linkages in an economy, through the use of input-output tables. Let bijbe a typical element in the Leontief inverse, B. Define b.j, bi., and b..as the column, row, and total sums of B, respectively. Further, define B* = b../n2as the average value of
all elements in the same matrix. Then, the backward linkage index, Uj, and the forward linkage index, Ui, can be calculated by:
(1)
where nis the number of sectors. In Uj, the numerator is the average value of the elements in column j, while in Ui, the numerator is the average value of the elements in row i. Thus, interpretation of both indexes is straightforward: Uj> 1 indicates that a unit change in final demand of sector jcreates an above-average increase in the economy, i.e., sector jgenerates above-average response in other sectors; Ui>1 indicates that a unit change in all sector’s final demand creates an above-average increase in sector i, i.e., sector idisplays above-average dependence on the output of other sectors. Sectors that have both Uj> 1 and Ui>1 are considered key sectors in the economy.
Multiplier Product Matrix (MPM) The concept of the multiplier product matrix (MPM) was developed by Sonis and Hewings (1994) as an alternative approach to the Rasmussen-Hirschman indexes. The definition of the MPM is as follows: given the Leontief inverse, B, let b.j and bi. be the column and row multipliers of the Leontief inverse, as above. Further, let V = b..be the global intensity of the Leontief inverse. Then, the input-output MPM is defined as:
U b n
B
U b n
B j
j
j j
=
= . /
. /
*
(2)
It can be shown that the MPM has a cross structure. This cross structure can be exploited to reveal a hierarchy of transactions such that there exists a cross (one row and column) in which the elements of this row (column) are larger than the corresponding elements of every other row (column). If this cross is now excluded, another cross with the same properties can be identified and the procedure repeated until all the rows and columns have been arranged. This new arrangement will be conducted in such a way that the centers of subsequent crosses will appear on the main diagonal, thereby providing a descending economic landscape. The properties of the MPM to be noted are that (i) the rank-size hierarchies of the backward and forward Rasmussen-Hirschman indices coincide with the hierarchies of column and row multipliers, which indicates that the structure of the MPM is essentially connected with the properties of sectoral backward and forward linkages;4and (ii) the MPM can be viewed as a matrix of
first order intensities of the fields of influence of individual changes in direct inputs, i.e., the components of the gradients of changes in all direct inputs. This gradient is used as a measure of the inverse importance of direct inputs5(Sonis
and Hewings, 1989; Soniset al., 1996; Soniset al., 1997).
Disequilibrium-based methods
Disequilibrium-based methods also help to describe the linkage structure of an economy and its change over time. However, they depart from disturbances in the existing system to generate a new equilibrium comparable to the original one. Commonly known as sensitivity analysis, under the field of influence theory, it usually shows two main facets. First, one might consider small coefficient changes in order to assess how “influential” a coefficient or a set of coefficients is to the system as a whole; second, for known structural changes, one might be interested in assessing the impacts of given functional changes. It is important to notice that all disequilibrium-based methods have correspondent changes in the equilibrium-based methods, as the former is rooted in the comparison of various equilibrated systems.
M V
b b
bn b
=
[
1
1
2
1
⋮
.
4Moreover, the hierarchy revealed by the rearrangement of the MPM provides the descending hierarchies of the Rasmussen-Hirschman indexes.
Field of influence The concept of field of influence was introduced and elaborated by Sonis and Hewings (1989, 1993). It is mainly concerned with the problem of coefficient change, namely the influence of a change in one or more direct coefficients on the associated Leontief inverse. Since, given an economic system in wich some coefficients are more “influential” than others, the sector responsible for the greater changes in the economy can be determined. In the simplest case, i.e., the case in which a small enough change, e, occurs in only one input parameter, aij, the basic solution of the coefficient change problem may be presented as follows. Define:
is the matrix of direct input coefficients;
is the matrix of incremental changes in the direct input coefficients;
is the Leontief inverse before changes;
is the Leontief inverse after changes.
Using the notion of inverse-important input coefficients, which is based on the conception of the field of influence associated with the change in only one input coefficient, assume that this change occurs in location (i1, j1), that is,
(3)
The field of influence can be derived from the approximate relation:
(4)
where F(εij)is the matrix of the field of influence of the change on the input coefficient, aij. For every coefficient, aij, there will be an associated field of influence matrix. In order to determine which coefficients have the greater field of influence, reference is made to the rank-size ordering of the elements, Sij, from the largest to the smallest ones. Therefore, for every matrix F(eij), there will be an associated value given by:
(5)
Thus, from the values of Sij, a hierarchy can be developed of the direct coefficients based on their field of influence, i.e., ranking sectoral relations in terms of their sensitivity to changes, in a sense that they will be responsible for more significant impacts on the economy.
Sij fkl ij l n k n =
( )
= =∑
∑
ε 1 1F ij B B
ij
ij
ε ε
ε
( )
≅ ( )
− εij ε
t i i j j
i i j J
= = = ≠ ≠ , , 1 1 1 0
B
( )
ε =(
I− −A E)
−1= bij(
ε))
B=(
I−A)
−1= bijField of Influences and the Spread of Structural Changes
The field of influence approach can also be used to evaluate structural changes
ex post. Through the use of the fields of influence of structural change for partitioned input-output systems, one can estimate the changes in gross output created by the propagation of structural changes in a sector or group of sectors versus the rest of the economy. The conventional input-output model is given by the system of matrix equations:
(6)
(7)
where fand xare respectively the vectors of gross outputs and final demands. Following Sonis et al. (1996), let us consider, for each sector j, the partitioned form of the input-output system, separating sector jfrom the rest of the economy R:
(8)
Assuming that some changes have occurred between time period 0 and t, these structural changes in sector jcan be represented as the following matrix:
(9)
where the blocks Ejjand ERj, represent the intra and intersectoral changes in direct inputs associated with the backward linkages in sector j. At time, a new matrix of direct inputs may be revealed for sector j:
10)
with a corresponding Leontief inverse B(E)=(I – A – E)–1. In this case, the change
in the gross output, can be calculated as:
11)
It can be shown (Soniset al., 1996) that, with
12)
which provides the basis for the typology of the propagation types of structural changes from a given sector to the rest of the economy.
∆xj =B E Q E xjj jj ( ) j+B E Q E xjR Rj ( ) j=∆x Ej( jj)+∆xj(EE
x B E Q E x B E Q E x x E
Rj
R Rj jj j RR Rj j R jj
)
( ) ( ) ( )
∆ = + =∆ ++ ∆x ER( Rj)
Q E( )=
(
I−B Ejj jj−E EJR RJ)
−1:∆x=
[
B E( )−B f]
=DBfA E A E A
A E A
jj jj jR
Rj Rj RR
+ = + + E E E jj Rj = 0 0 A A A
A A B
B B
B B f
jj jR Rj RR jj jR Rj RR = = ; ; == = f f x X X j R j R ; f
STRUCTURAL CHANGES IN THE BRAZILIAN STATE OF MINAS GERAIS
After briefly revisiting the fields of influence methodology, in an attempt to provide a common framework to the equilibrium and disequilibrium approaches to structural analysis of input-output systems, we evaluate, in this section, structural changes in the economy of the Brazilian State of Minas Gerais. Three matrices of regional purchase coefficients are used for different years: 1953, 1980 and 1995.6In order to generate comparable tables, an attempt to reconcile the
sectoral aggregation was made, ending up with a system of 16 sectors.
Structural changes in the Minas Gerais economy are assessed through the use of the complementary techniques described above. Initially, simple output multipliers and Rasmussen-Hirschman indexes are calculated and analysed. After that, the regional economic structure is pictured in three different timeframes (1953, 1980 and 1995) through the use of the multiplier product matrix technique. Most influential coefficients are determined based on the simplest case of field of influence, in which change in a single regional purchase coefficient is considered. Moreover, the idea of fields of influence of structural change (1980-1953 and 1995-1980) for the partitioned input-output systems is used in the context of sectoral changes in the regional purchase coefficients in order to isolate specific impacts of changes in the industrial structure, as suggested in Sonis et al. (1996) in an interregional context.
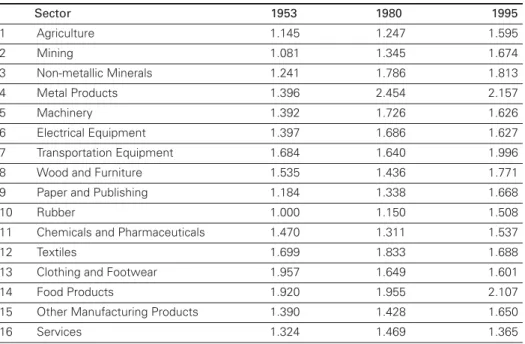
As a starting point to our analysis of the structure of the economy over time, Table 3 shows the sectoral output multipliers in Minas Gerais, for the three years. With the exception of textiles, and clothing and footwear, the multipliers are consistently bigger in 1995 than in 1953, suggesting stronger backward linkages in the economy.
From 1953 to 1980, Minas Gerais’ industry became more integrated, suggesting that the objective of developing pursued in the 1970s was somewhat achieved. Output multipliers that increased most were those of the intermediate sectors, non-metallic minerals, metal products, machinery, and electric equipment. In spite of that, traditional sectors, such as textile and agriculture, also have benefited. The larger changes occurred in the first period of comparison (1953-1980). In the second period (1980-1995), when the state investments ceased, output multipliers of the intermediate sector declined or stagnated. This indicates exhaustion of the industrialization strategy, at least in Minas Gerais, because, without Government financial support, the substitution of imports halted. This
fact is corroborated by the increase in the value of the multipliers in the second period of analysis (1980-95) in sectors other than those motivated by the II PND, such as agriculture, rubber, and paper industry.
Table 3: Output Multipliers
Sector 1953 1980 1995
1 Agriculture 1.145 1.247 1.595
2 Mining 1.081 1.345 1.674
3 Non-metallic Minerals 1.241 1.786 1.813
4 Metal Products 1.396 2.454 2.157
5 Machinery 1.392 1.726 1.626
6 Electrical Equipment 1.397 1.686 1.627
7 Transportation Equipment 1.684 1.640 1.996
8 Wood and Furniture 1.535 1.436 1.771
9 Paper and Publishing 1.184 1.338 1.668
10 Rubber 1.000 1.150 1.508
11 Chemicals and Pharmaceuticals 1.470 1.311 1.537
12 Textiles 1.699 1.833 1.688
13 Clothing and Footwear 1.957 1.649 1.601
14 Food Products 1.920 1.955 2.107
15 Other Manufacturing Products 1.390 1.428 1.650
16 Services 1.324 1.469 1.365
Source: Authors’ calculations.
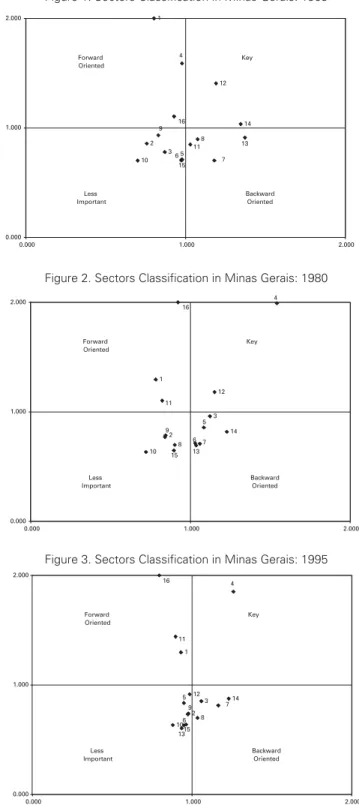
Backward and forward linkage indexes were calculated for the 16-sector regional tables of the three years. Figures 1-3 present the classification of the sectors in the Minas Gerais economy based on the estimates of these indexes. Estimates for sectoral backward linkage indexes are presented in the x-axis, while estimates for sectoral forward linkage indexes are in the y-axis. Key sectors for each region are shown at the upper right corner of the table; sectors with stronger backward linkage orientation appear in the southeast quadrant; while sectors with stronger forward linkage orientation are placed in the northwest quadrant. The remaining sectors are considered less important due to their low ability to generate linkages in the State economy.
Figure 1. Sectors Classification in Minas Gerais: 1953
Figure 2. Sectors Classification in Minas Gerais: 1980
Figure 3. Sectors Classification in Minas Gerais: 1995
5 6 10 7 15 8 11 9 3 2 16 13 14 12 4 1 0.000 1.000 2.000
0.000 1.000 2.000
Forward Oriented Key Less Important Backward Oriented 5 6 10 7 15 8 11 9 3 2 16 13 14 12 4 1 0.000 1.000 2.000
0.000 1.000 2.000
Forward Oriented Key Less Important Backward Oriented 5 6 10 7 15 8 11 9 3 2 16 13 14 12 4 1 0.000 1.000 2.000
0.000 1.000 2.000
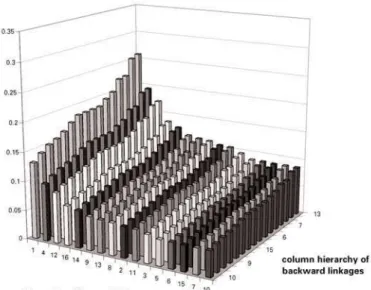
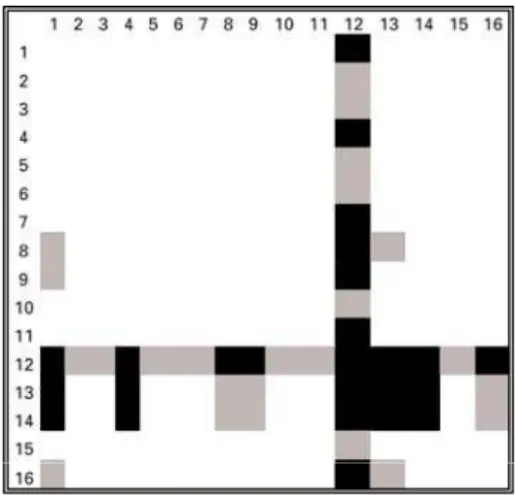
Another attempt was made to compare the economic structure of Minas Gerais over time, by considering the hierarchy of backward and forward linkages – related to the column and row multipliers, respectively – and their economic landscape associated with the cross structure of the MPM. The results, depicted in Figures 4 to 6, reveal the cross structure for the state, in 1953, 1980 and 1995; the rows represent the hierarchy of forward linkages while the columns provide similar detail for the backward linkages. For purposes of comparison, the sectors in the regional economic landscapes, for 1980 and 1995, were arranged in the same order as that for 1953. Hence, the sectors with the highest backward linkages in the Minas Gerais economy in 1953 are those that appear in the first columns of the matrix, while sectors with higher forward linkages in the same year occupy the first rows. If the State, in all the three years, had identical interindustry structures, then the regional economic landscapes would be as smooth as the one shown for 1953. With the 1953 sectoral hierarchy imposed on the regional economies, it can be seen that, over time, the economy does not have exactly the same linkage structure. However, there seems to be a better fit between 1980 and 1995, as the respective landscapes look rather similar, suggesting that stronger structural changes took place in the period 1953-1980. Another difference appears in the sectoral connections, which are smoother in 1953, suggesting that in the more recent period, there are more dominant sectors than in the past. Sectoral dominance in 1995 is even stronger, as it is apparent from the peaks in the respective landscapes. The visual impression obtained from these landscapes is that the regional economy appears to have gone through rather deeper structural changes than the Rasmussen-Hirschman indexes would lead one to suggest.
Figure 4: Cross-Structure “Landscape” for First Order Multiplier Product Matrix:
Figure 5: Cross-Structure “Landscape” Using MG 1953 Imposed Hierarchy: Minas Gerais, 1980
Figure 6: Cross-Structure “Landscape” Using MG 1953 Imposed Hierarchy:
Minas Gerais, 1995
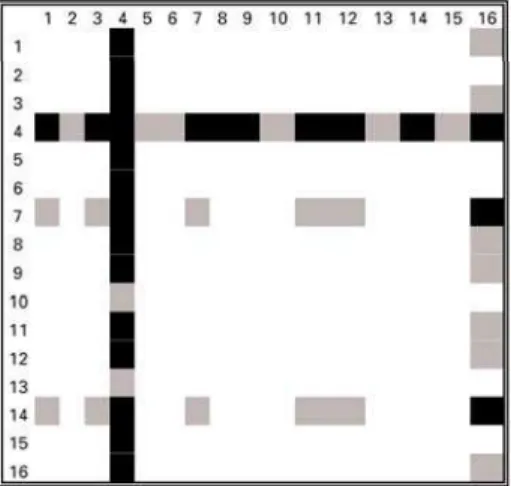
(16), while, already in 1980, metal products and services are shown to have increasingly more linkages associated with higher values for the field of influence, and, in 1995, these sectors definitely stand out, together with the transportation equipment sector. Textiles and food products, in 1953, and metal products, in 1980 and 1995, are also characterized as key sectors in the Rasmussen-Hirschman approach. It should be noted that services presented the greatest forward linkages in 1980 and 1995, suggesting that the infrastructure policies of the 1950s through the 1970s contributed to facilitating productive activities in the State. Again, the field of influence approach reinforces the notion of shifting sectoral dominance away from traditional sectors, and a relatively less limited structure over time, as the concentration of coefficients with highest field of influence presents a more dispersed pattern over time.
Figure 7: Coefficients with the Largest Field of Influence: Minas Gerais, 1953
Figure 9: Coefficients with the Largest Field of Influence: Minas Gerais, 1995
Finally, emphasis is given in the propagation of intra and intersectoral backward linkage changes on the State economy and their representation in the changes in gross output within the region. In equation (12), since the components of the vector ∆xj(ERj) and ∆xR(Eij) are small, the following approximations
hold:
(13)
For each sector, j, there are two figures showing, respectively, ∆x(Ejj), ∆x (ERj), i.e., the decomposition of ∆xinto the effect originated from changes in
intra-sectoral regional purchases, and the effect originated from changes in the pattern of intersectoral purchases within the region. Table 4 shows the percentage change in total output disaggregated into these two effects, for structural changes in the period 1953-1980, and 1980-1995. The results for the first period show that around 70% of the total change in the State output were primarily caused by changes in intersectoral purchases within the economy, while the remaining 30% were due to stronger intra-sectoral linkages. These overall positive effects suggest, again, a more integrated economy in 1980. However, sectoral specific structural changes do not reveal a homoge neous pattern of increasing integration. Some sectors, such as transportation equipment, wood and furniture, chemicals and pharmaceuticals, clothing and footwear, and other manufacturing products were responsible for a decrease in total output, due to specific changes in interregional purchases, which became less important in terms of their capacity to internalize the benefits of growth in Minas Gerais. Negative effects of changes in intra-sectoral purchases of agriculture, wood and furniture, paper and publishing, textiles, clothing and footwear, and food products point to less integrated plants in these traditional activities.
∆ ∆
∆ ∆
x x E
x x E
j j jj
R R Rj
≈ ≈
( )
Attempts to identify the sources of changes in total output were also made for the period 1980-1995. Table 4 reveals that in 1995 the State’s economy faded away in terms of its capacity to generate growth through inter-industry linkages. Although the manufacturing sector generally contributed to a more integrated structure within the region – with the exception of the metal products sector – the role played by structural changes in the backward linkages of the services sector heavily influenced the overall negative results for the economy. This suggests the idea of slow of growth of the intermediate and base industries when left to the free market, without government financial support.
Table 4: Percentage Change in Total Output
Sector 1953-1980 1980-1995
∆x(Ejj) ∆x(ERj) ∆x ∆x(Ejj) ∆x(ERj) ∆x
1 Agriculture -0.64 3.31 2.67 1.11 1.75 2.85
2 Mining 0.03 0.17 0.20 0.13 1.03 1.16
3 Non-metallic Minerals 0.21 0.18 0.39 0.17 -0.11 0.06
4 Metal Products 2.39 0.22 2.61 -1.62 -0.63 -2.25
5 Machinery 0.01 0.00 0.01 -0.21 0.11 -0.10
6 Electrical Equipment 0.01 0.00 0.01 -0.06 0.04 -0.02
7 Transportation Equipment 0.01 -0.03 -0.02 0.49 0.31 0.80
8 Wood and Furniture -0.06 -0.05 -0.11 0.05 0.13 0.18
9 Paper and Publishing -0.01 0.07 0.06 0.02 0.28 0.30
10 Rubber 0.00 0.00 0.00 0.01 0.03 0.04
11 Chemicals and Pharmaceuticals 0.00 -0.08 -0.08 0.76 0.12 0.88
12 Textiles -0.04 0.30 0.26 -0.43 0.19 -0.24
13 Clothing and Footwear -0.22 -0.03 -0.25 -0.08 0.06 -0.02
14 Food Products -0.81 0.55 -0.27 1.30 -1.04 0.26
15 Other Manufacturing Products 0.00 -0.01 -0.01 0.01 0.04 0.05
16 Services 2.22 2.69 4.91 -2.19 -2.57 -4.75
Total 3.10 7.29 10.39 -0.55 -0.26 -0.81
Source: Authors’ calculations.
FINAL REMARKS
firstly, in the period of 1953 to 1980, due to the huge government investment in the Minas Gerais economy with the II PND; and secondly, in the period of 1980 to 1995, due to its cessation.
Latin American countries in general, and Brazil, more specifically, were all engaged in post-War industrialization policies to a greater or lesser degree. At the subnational level, regions also stepped up their involvement in this direction. In the 1980s, nonetheless, with the global changing economic environment – which serious withdrew international liquidity – and the uprising of a new development paradigm based upon the beliefs in free markets, market-oriented development strategies took over the continent. As shown, the case of Minas Gerais clearly reflects these two different periods of mainstream development ideologies, which influenced the state bureaucracy.
A recent study by Haddad (1999) suggests that the interplay of market forces in the Brazilian economy still favors the more developed region of the country. Private investors search for better financial returns, and, therefore, are not concerned with regional equity; location is defined on a purely economic basis, differently as could have happened in investments from industrial policies. This should potentially benefit Minas Gerais, considering the State’s solid industry of intermediate and basic goods, built up during the first decades after the War. As the foreign investments maturate, current conclusions about the sustainability of the II PND-supported industries are expected to be widely re-assessed.
REFERENCES
ANDRADE, T. A. (1980). Industrialization and Fiscal Incentive: Minas Gerais in the Period 1970/1977. Belo Horizonte, Fundação João Pinheiro. (in Portuguese)
BDMG (1989). Diagnósticos e Perspectivas, Economia Mineira, mimeo. (in Portuguese)
FERNANDES, C. L. L. (1997). “Minas Gerais and the National Economy: An Interregional Input-Output Analysis”. Rio de Janeiro, UFRJ, mimeo.(in Portuguese)
FIGUEIREDO, A.T.L. (1998). “Location Pattern and Regional Specialization in the Mineira Industry”. Belo Horizonte, CEDEPLAR/UFMG, mimeo.(in Portuguese)
FILHO, F.C.D., CHAVES, M., SILVA, R.R. (1980). The Industrialization of Minas Gerais and the
Fiscal Incentives: Evaluation of the Law 5.261/69.Belo Horizonte, Fundação João Pinheiro.
(in Portuguese)
GUILHOTO, J.J.M.; SONIS, M.; HEWINGS,G.J.D.; MARTINS, E.B. (1994). “Linkages and Key Sectors in the Brazilian Economy: 1959/80”. Pesquisa e Planejamento Econômico, 24. (in Portuguese)
HADDAD, E. A. (1999). Regional Inequality and Structural Changes: Lessons from the Brazilian Experience. Aldershot, Ashgate.
HIGGINS, B. and SAVOIE, D. J. (1995). Regional Development Theories and Their Application. Transaction Publishers, New Brunswick.
HIRSCHMAN, A. O. (1958). The Strategy of Economic Development. Yale University Press, New Haven.
MILLER , R.E.; BLAIR, P. (1985). Input-Output Analysis: Foundations and Extensions. Englewood Cliffs, N.J., Prentice-Hall.
SONIS, M. and HEWINGS, G. J. D. (1989). “Error and Sensitivity Input-Output Analysis: A New Approach”. In: Miller, R. E., Polenske, K. R. & Rose, A. Z. (eds.). Frontiers of Input-Output
Analysis. New York, Oxford University Press.
SONIS, M. and HEWINGS, G. J. D. (1994). “Interpreting Spatial Economic Structure and Spatial Multipliers: Three Perspectives”. Geographical Analysis, 26: 124-151.
SONIS, M.; HEWINGS, G. J. D.; LEE, J. K. (1993). “Hierarquies of Regional Sub-Structures and their Multipliers within Input-Output Systems: Miyazawa Revisited”. Hitotsubashi Journal of
Economics, 36: 61-70.
SONIS, M.; HEWINGS, G. J. D.; GUO, J. (1996). “Sources of Structural Change in Input-Output Systems: a Field of Influence Approach”. Economics Systems Research, 8 (1): 15-32.
SONIS, M.; HEWINGS, G. J. D.; GUO, J.; HULU, E. (1997). “Interpreting Spatial Economic Structure: Feedback Loops in the Indonesian Interregional Economy, 1980, 1985”. Regional Science and