DOI: http://dx.doi.org/10.1590/2446-4740.03116
*e-mail: [email protected]
Received: 29 April 2016 / Accepted: 28 November 2016
A magneto-motive ultrasound platform designed for pre-clinical
and clinical applications
Diego Ronaldo Thomaz Sampaio*, Felipe Wilker Grillo, Alexandre Colello Bruno, Theo Zeferino Pavan, Antonio Adilton Oliveira Carneiro
Abstract Introduction: Magneto-motive ultrasound (MMUS) combines magnetism and ultrasound (US) to detect magnetic nanoparticles in soft tissues. One type of MMUS called shear-wave dispersion magneto-motive ultrasound (SDMMUS) analyzes magnetically induced shear waves (SW) to quantify the elasticity and viscosity of the medium. The lack of an established presets or protocols for pre-clinical and clinical studies currently limits the use of MMUS techniques in the clinical setting. Methods: This paper proposes a platform to acquire, process, and analyze MMUS and SDMMUS data integrated with a clinical ultrasound equipment. For this purpose, we developed an easy-to-use graphical user interface, written in C++/Qt4, to create an MMUS pulse sequence and collect the ultrasonic data. We designed a graphic interface written in MATLAB to process, display, and analyze the MMUS images. To exemplify how useful the platform is, we conducted two experiments, namely (i) MMUS imaging to detect magnetic particles in the stomach of a rat, and (ii) SDMMUS to estimate the viscoelasticity of a tissue-mimicking phantom containing a spherical target of ferrite. Results: The developed software proved to be an easy-to-use platform to automate the acquisition of MMUS/SDMMUS data and image processing. In an in vivo experiment, the MMUS technique detected an area of 6.32 ± 1.32 mm2 where magnetic particles were heterogeneously distributed in the stomach of the rat. The SDMMUS method gave elasticity and viscosity values of 5.05 ± 0.18 kPa and 2.01 ± 0.09 Pa.s, respectively, for a tissue-mimicking phantom. Conclusion: Implementation of an MMUS platform with addressed presets and protocols provides a step toward the clinical implementation of MMUS imaging equipment. This platform may help to localize magnetic particles and quantify the elasticity and viscosity of soft tissues, paving a way for its use in pre-clinical and clinical studies.
Keywords: Ultrasound, Magneto-motive ultrasound, Shear wave, Elastography, Magnetic nanoparticles.
Introduction
Magneto-motive ultrasound (MMUS) has been used to localize magnetic nanoparticles within soft tissues, and allows the generation of ultrasound-based molecular imaging. Most of the nanoparticles are weak contrast agents to ultrasound, including magnetic nanoparticles. MMUS can overcome this issue by detecting the motion induced by the
interaction between an external magnetic ield and
the magnetic nanoparticles as ultrasonic echoes (Oh et al., 2006). A continuous-time harmonic
magnetic ield with frequency in order of few Hertz, or a burst of magnetic ield pulses, usually excites
the magnetic nanoparticles (Mehrmohammadi et al., 2011c). Using this technique researchers have also investigated MMUS to evaluate the viscoelasticity of soft tissues by tracking the shear waves induced by motion of the magnetic nanoparticles (Almeida et al., 2014; 2015; Pavan et al., 2012), a method known as shear-wave dispersion magneto-motive ultrasound
(SDMMUS) (Almeida et al., 2014). The velocity and attenuation of the shear waves can be analyzed to obtain the elasticity and viscosity of the medium (Zhao et al., 2010).
In MMUS and SDMMUS, the ultrasound system needs a high frame rate to capture the induced harmonic motion and shear waves. Enhanced hardware systems are costly (Jensen et al., 2013; Kaczkowski and Daigle, 2011), but they could provide real-time MMUS imaging. Some clinical ultrasound equipment provide a graphical user interface, called ultrasound research interface (URI) (Wilson et al., 2006). This research interface
can be conigured to collect radiofrequency (RF) data at high frame rates (>1 kHz), which can be processed
by applying a speckle-tracking algorithm (Viola and Walker, 2005; Zahiri-Azar et al., 2010) to monitor motion with frequencies in the order of hundreds of hertz (Sarvazyan et al., 2013). Unfortunately, the commercial URI systems are expensive, limited, or not
lexible enough to evaluate and test novel ultrasound
techniques. Efforts have focused on incorporating software interfaces in the commercial ultrasound equipment (Hemmsen et al., 2012; Shamdasani et al., 2008) to facilitate the implementation of new techniques, such as 2-D temperature imaging and vibro-acustography. This strategy could provide a more accessible and available platform for clinical application (Liu and Ebbini, 2010; Urban et al., 2011).
Despite the various applications of MMUS, there has been little attention in its implementation in the clinical setting. Successful implementation of MMUS and SDMMUS can provide new opportunities for clinical applications of ultrasound imaging, such as localization of brachytherapy seeds (McAleavey et al., 2003), monitoring of stomach emptying (Bruno et al., 2015), estimation of tissue viscoelasticity (Almeida et al., 2015) and molecular imaging (Evertsson et al., 2014). Moreover, combining photoacoustics with MMUS can also help to improve the sensitivity of the technique to detect multifunctional nanoparticles with multiple contrast mechanisms (Jin et al., 2010; Qu et al., 2011)
This study aimed to develop a more practical MMUS platform for application in pre-clinical and clinical trials. We present a new platform dedicated to the MMUS technique based on a software for data acquisition (MMUS-A) and another software for image processing (MMUS-PA). We have explored the MMUS technique to achieve dedicated pulse sequences, and
we have created an optimized coniguration to acquire
and process the RF data. We have characterized the developed platform through an SDMMUS experiment and obtained the mechanical properties of a tissue-mimicking phantom; we have also conducted an
in vivo study to localize magnetic particles in the stomach of a rat. The developed system relies on a protocol that is compatible with most of the clinical ultrasound systems, paving the way for the use of MMUS in the clinical setting.
Methods
Laboratory system overview
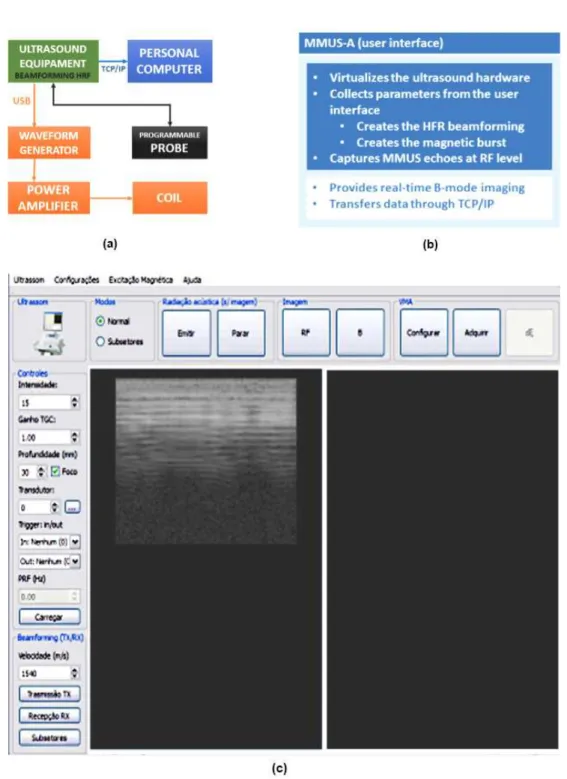
Figure 1a shows a diagram of a typical MMUS laboratory system. Our system consisted of a dual-channel waveform generator (33522a, Agilent, California,
USA), an audio power ampliier (5000W - Dynamic 20.000 Ω2, Ciclotron, Brazil) connected to a solenoid (coil) to generate the magnetic ield, and a clinical
ultrasound equipment (Sonix RP, Ultrasonix, Canada). The waveform generator was connected to the ultrasound equipment via universal serial bus (USB) to synchronize the pulse-eco sequence with the
magnetic ield generated by the coil. Two ultrasonic
probes (L14-5/38; EC9-5/10, Ultrasonix, Canada)
with central frequencies of 7.2 MHz and 6.5 MHz
were used.
A user interface called MMUS-A was developed in Visual Studio Express 2010 (Microsoft, USA) with C++ and Qt4 (Digia, Finland). The software development kit: IVI-COM 1.0.1 (IVI Foundation, USA) and Texo 5.7.4 (Ultrasonix, Canada) provide the capability to control both the ultrasound equipment and waveform generator. Qt4 provides classes to create threads, images, and network (Qt, 2016), which were used to create an abstraction presented by an object-oriented environment with the functionalities depicted in Figure 1b. The blue box in Figure 1b highlights the editable functionalities of the user interface and generates a synchronized pulse sequence for MMUS. The white box highlights the software function that shows real-time B-mode images and transfers the acquired data through a Transmission Control Protocol/Internet Protocol (TCP/IP) cable connected to an external personal computer (PC). Figure 1c illustrates the inal user interface.
Design of the pulse sequence
The MMUS pulse sequence was implemented by combining a synchronized beamforming pulse-echo
with a magnetic ield burst. Pulsed MMUS is more
desirable than continuous MMUS to avoid coil heating (Mehrmohammadi et al., 2011a). Thus, user can deine the settings that include the ultrasonic beamforming
parameters, the magnetic ield shape (e.g., sinusoidal), the magnetic ield frequency fB, and the excitation duration TB to allow automated acquisition.
The high frame rate (HFR) sub-sector method
(Zahiri-Azar et al., 2010) is a pulse-echo beamforming technique that was implemented by emitting ultrasound waves from all the available channels; which are 128 transmitting channels. Then, a delay-and-sum algorithm was applied. The frame rate fr is inversely proportional to the number of received scanlines and the number of scanlines determines the size of a sector (Cobbold, 2006). Therefore, HFR beamforming overcomes frame rate limitations in the clinical hardware by creating sub-sectors containing fewer scanlines than the full sector. Then, the data corresponding to each sub-sector are concatenated into a full sector (Zahiri-Azar et al., 2010). According to the HFR method, the number of sub-sectors increases the total duration of an acquisition proportionally, raising the number of emissions.
The interaction between magnetic particles and the
magnetic ield lead the magnetic force FB to be twofold
the value of the magnetic ield frequency 2 B
F B
f = f
2011b; Oh et al., 2006). Hence, according to the Nyquist theorem, fr has to be greater than 2
B
F
f . This condition is essential to visualize the magnetically induced motion during magnetic excitation (Oh et al., 2006), without aliasing artifacts. The pulse sequence was
designed to it all those requirements.
The pulse-echo mode and the magnetic excitation
are turned on simultaneously. The magnetic ield is
applied during the ultrasonic scan time TUS with a
duration of TB, which must be less than or equal to
,
US
T ensuring the synchronism between subsequent sub-sectors. The MMUS pulse sequence was repeated
20 times (each sub-sector was composed of 5% of the total number of scanlines in the full sector) to cover 100% of the sector as follows:
1. The ultrasound scan and magnetic excitation were turned on;
2. After TB the magnetic excitation was turned off;
3. The ultrasound scan was turned off, and then sub-sectors acquired during TUS were stored;
4. The next sub-sector ith was acquired according
to steps 1 to 3;
5. Steps 1 to 4 were repeated at a repetition frequency of 1
US
T to cover 100% of the sector;
6. After step 5, the sub-sectors were concatenated,
stored into a HFR cineloop, and transferred
to the PC.
We deined a group of default values, organized as
presets, to help to automate the MMUS and SDMMUS
experiments. The frame rate was set to 2000 Hz, at
an axial depth of acquisition of 90 mm, by creating sub-sectors containing 5% (2 mm) of the total number of elements of the linear transducer (~40 mm) full
sector. A sampling frequency of 40 MHz was used
to capture the RF data, which can be processed to obtain displacements in the order of a few microns (Viola and Walker, 2005). The magnetic pulses were
calibrated and deined as a burst of sinusoidal cycles
with frequency in the range of tens to hundreds of hertz, which was limited to a quarter of the Nyquist frequency. Table 1 summarizes the presets used in the experiments.
MMUS images generation
The RF data was processed by applying a motion tracking cross-correlation algorithm. The algorithm compared consecutive RF echoes that were axially displaced by the action of the magnetic force, to give
the speckle time-delay (lag) in the pulse-echo axial direction. With this algorithm, magnetically induced motion was obtained over a region by using pairs of windowed RF echoes that were acquired under different instants of time. The size of the windows, given in millimeters, and the distance of adjacent windows (% of overlap) are the most important parameters of motion tracking in terms of spatial resolution (Viola and Walker, 2005).
For a single element of the probe, a pair of consecutive scanlines was divided into overlapping windows by using a 1D rectangular window of 2 mm with a 50% overlap. Lagrange interpolation was applied around the maximum peak of the cross-correlation signal to obtain the motion between two consecutive RF echoes (Viola and Walker, 2005; Zahiri-Azar and Salcudean, 2006). The algorithm was repeated for each element of the probe to generate an MMUS particle motion image Mu.
This image enabled visualization of the motion at each
spatial location of the acquisition depth or a predeined
region. The intensity of Mu was adjusted to meters by
dividing its value by twice the sampling frequency of ultrasound machine and then multiplying the result by the speed of sound, e.g., 1540 m/s (Cobbold, 2006). The MMUS particle velocity image Mv was the time
derivative of Mu, which was obtained in the time interval
1
t fr
∆ = , giving the dimension of meters per second:
( ) 1
u
v u u
t fr
M d
M M t t M fr dt ∆ = t
∆
= + ∆ ≅ ∆ = ∆ × (1)
All the aforementioned details of motion tracking were implemented in MMUS-PA, a platform that is used to obtain images and analyze motion. Figure 2 shows MMUS-PA, developed using MATLAB 2014a
(MathWorks, USA) to display the ofline B-mode,
MMUS images, and the spectral analysis.
Experiments
Two experiments, namely (i) in vivo experiment and (ii) an experiment using a phantom, were conducted to exemplify how useful the platform is. The in vivo
experiment involved detection of magnetic particles in the stomach of a rat. The phantom study was developed to estimate the elasticity and viscosity of the phantom by using SDMMUS.
We used the MMUS system described in the previous section to collect the data. The magnetizing
ield setup was calibrated to deliver a maximum magnetic ield in the region of interest. For the
phantom measurements, a cylindrical magnetic core
of ferrite was used as a lux concentrator. All the
experiments were conducted at room temperature of
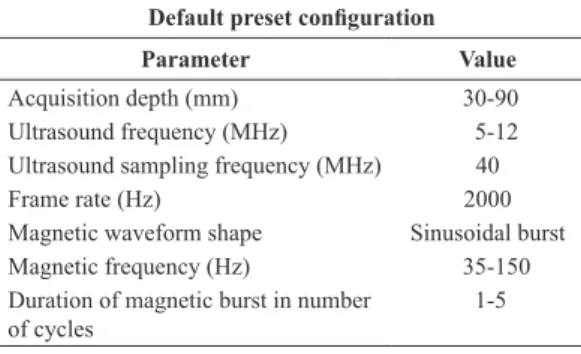
Table 1. Default magnetic and ultrasonic instructions (preset) used in the MMUS experiments.
Default preset coniguration
Parameter Value
Acquisition depth (mm) 30-90
Ultrasound frequency (MHz) 5-12
Ultrasound sampling frequency (MHz) 40
Frame rate (Hz) 2000
Magnetic waveform shape Sinusoidal burst
Magnetic frequency (Hz) 35-150
Duration of magnetic burst in number of cycles
24 °C. The MMUS pulse sequence was conigured
according to the preset shown in Table 1.
i) In vivo: animal handling and image analysis
In the in vivo study (Colello Bruno et al., 2014), we
used a gavage needle to deliver ferrite particles (TH 50,
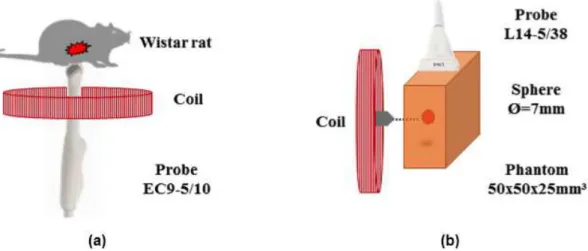
Thornton Electronics, Brazil) of 50 µm average size, mixed in yogurt (Chandelle, Nestle, Switzerland) at a mass concentration of 10% directly in the stomach of a male Wistar rat (approximate weight of 300 g). An ultrasound microconvex probe (model EC9-5/10, Ultrasonix, Canada) was placed in the coil, as illustrated in Figure 3a. The ultrasound transducer focus and
the magnetic ield were positioned over the stomach
region of the rat (Figure 3a). The MUS RF data were acquired right after the gavage procedure. The coil (with the height of 14 mm, outer diameter of 92 mm,
and inner diameter of 48 mm) was driven at 35 Hz
with current amplitude of 1 A, to provide a peak of
magnetic ield of 5 mT at 50 mm away from the coil.
Before the experiment, the rat was anesthetized with chloral hydrate 4% and had the abdomen shaved to improve acoustic coupling. The local Animal Ethics Committee approved all the procedures. For a more detailed description of this experiment, the reader is referred to (Colello Bruno et al., 2014).
We analyzed the MMUS images after deining a
region of interest (ROI), where the magnetic force induced the highest displacements with a frequency
Figure 2. MMUS-PA interface. From left to right examples of B-mode image, MMUS image, and spectral density are displayed. The maximum peak from the spectral density to indicate the frequency of the MMUS motion.
B
F
f . For that, we analyzed thresholds between 5% and 95% of the highest relative energy of the particle velocity signal, which was used to generate a mask for locating and segmenting ROI precisely. This relative energy was estimated by the sum of square of the particle velocity signal.
ii) Phantom: production and analysis of shear wave
The phantom study, based on (Pavan et al., 2012), was designed to induce shear waves due to the magnetic excitation. For this purpose, a rectangular
phantom (50 × 50 × 25 mm) made of parafin-gel wax
was prepared according to the procedure described in (Vieira et al., 2013). A spherical inclusion with a diameter of 7 mm, containing ferrite at a 50% mass concentration, was positioned inside the phantom. The coil (with the height of 22 mm, inner diameter of 45 mm, and outer diameter of 89 mm) was positioned near the phantom, so that the tip of the ferrite core was aligned with the sphere and positioned at a distance of 1 mm away from the surface of the phantom (see Figure 3b). At this distance from the
coil, a magnetic ield with amplitude of 300 mT was
generated synchronized with the ultrasound scan; both the magnetic excitation and the ultrasonic scan were gated by MMUS-A (see section “Design of the pulse sequence”). An ultrasound linear probe (model L14-5/38, Ultrasonix, Canada) was placed on the top of the phantom, perpendicularly to the axis of the coil, as depicted in Figure 3b.
The motion created by action of the magnetic force in the region of excitation (ROE) at time t0 and depth
of y0 generated a shear wave that propagated through
the phantom with group velocity cg. To obtain the group velocity of shear wave in the distance interval of y0and y, the time delay ∆ = −t t t0 between two time
signals was estimated by using cross-correlation. The distance ∆ = −y y y0 divided by the time interval
t
∆ gave the group velocity:
. g
y c
t
∆
=∆ (2)
After estimating the group velocity, we applied
a Gaussian ilter to the signal of the shear wave and
selected a 50% bandwidth at fSW. Then, we assumed
that the SW signal was monochromatic during the
analysis which gives the attenuation coeficient
α according to:
( )
yA y =e−α (3)
In addition, we unwrapped the phase change
φ along the axial direction y to estimate the phase velocity cp (Parolai, 2009):
2
p sw y c = πf ∆
∆φ (4)
All the parameters (i.e., group velocity, phase
velocity, and attenuation coeficient) were determined
by using 10 experimental points obtained at different depths. cg and cp were obtained by itting a linear
polynomial to the curves (∆ ∆y, t) and (∆φ ∆, t), respectively. The amplitude decay was adjusted to exponential curve to obtain α. In addition, we calculated the R-squared value for each curve to indicate the model quality.
Results
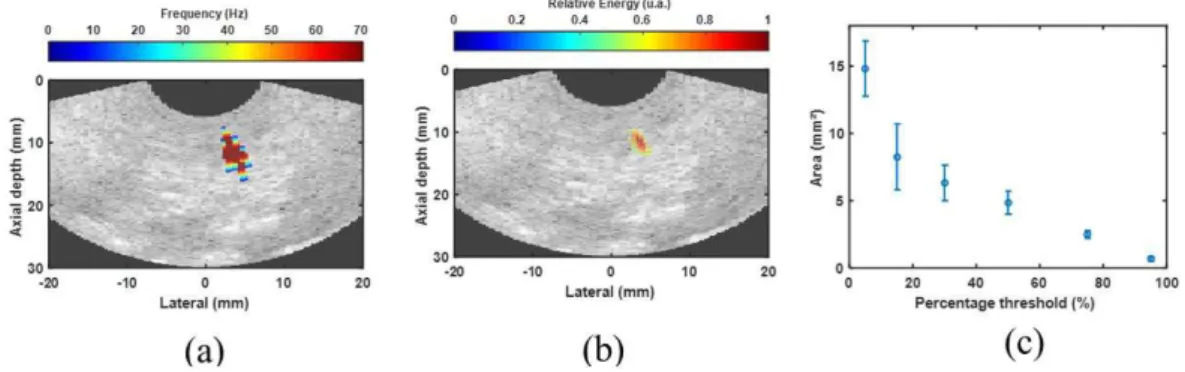
Figure 4 shows the results obtained for the in vivo
experiment. Figure 4a corresponds to a rat B-mode image overlaid with the MMUS image (red area), indicating the region where the maximum velocity of the particle was 4.0 mm/s. We determined this
MMUS image region by detecting the region where
the movements had a frequency of 70 ± 1 Hz.
In Figure 4b, the same B-mode image is overlaid with the relative energy of the motion shown in Figure 4a. Also, we obtained the ROI area in Figure 4b by using a threshold percentage of 50% of the maximum relative energy, which presents a smaller area (see Figure 4b) than the region shown in Figure 4a. We varied the threshold percentage between 5% and 95% of the maximum relative energy to measure the ROI area, the area calculated by using an ellipsoid approximation (Figure 4c). We estimated areas of 8.25 ± 2.45 mm2, 6.32 ± 1.32 mm2, 4.85 ± 1.06 mm2,
and 2.48 ± 0.28 mm2 for the threshold percentages of
15%, 30%, 50%, and 95%, respectively.
Figure 5 displays the results of the SDMMUS phantom experiment. Figure 5a contains a phantom B-mode image overlaid with the MMUS image (red area) indicating the region where the sphere
was moved by an oscillating magnetic ield in the frequency of 100 Hz with a duration of one cycle
(TB = 10 ms). Figure 5b shows an image of MMUS
Mv versus time of a scanline at the lateral position of 1 mm (see Figure 5a) and depicts the propagation of shear wave for Tus = 50 ms.
The ferrite sphere corresponded to the ROE area localized between the axial depths of 35 mm and 45 mm with a cross-section area of 38.48 mm2. When
we used a percentage threshold of 30%, we estimated the ROE area as 42.14 ± 2.79 mm2. After the magnetic
excitation at fB = 100 Hz a shear wave, identiied by
the arrow shown in Figure 5b, propagated from the ROE and reached the top of the phantom 15 ms after the beginning of the magnetic excitation. After that,
the relections emerged from the phantom/probe
interface (in the region from 0 mm to 10 mm of axial depth) in the Mv image. We obtained the power
spectrum of the time signal for depths of 25 mm, inal
SW (SWf), 35 mm, initial SW (SWi), and 40 mm (ROE). Then, each time signal was splited into two 10 ms time-window which provided the spectral information about excitation (from 0 to 10 ms) and SW propagation (from 10 to 20 ms), as shown in Figure 5c. The peak frequencies of these three signals were different (Figure 5c). We believe this shift in frequency is due to the viscoelastic behavior of the
parafin gel, which acts as a dispersive medium and
attenuates higher shear wave frequencies.
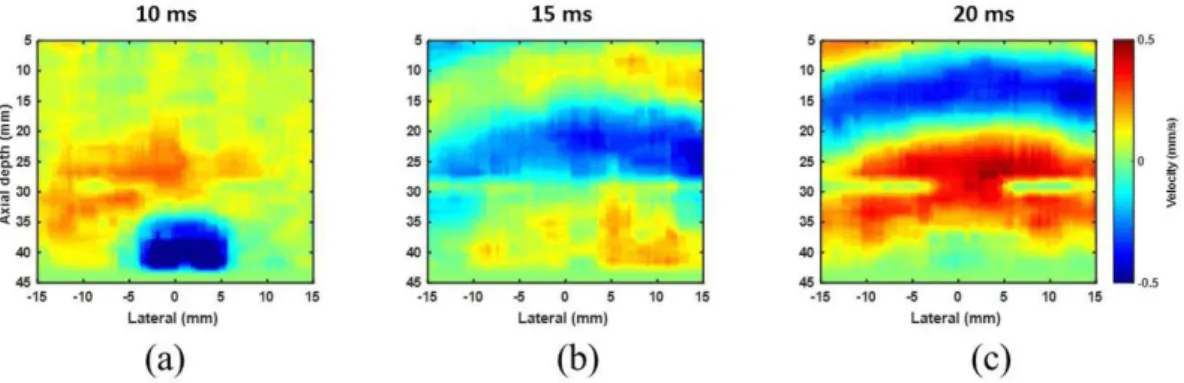
Figure 6 shows the images of MMUS Mv at 10 ms (6a), 15 ms (6b), and 20 ms (6c) after the beginning
Figure 5. (a) B-mode image overlaid with MMUS image shows a solid ferrite sphere moving in a frequency of 200 Hz within a parafin
phantom. A single pulse of magnetic ield with frequency of 100 Hz moved the sphere; (b) Mv versus time of a scanline at the lateral position of 1 mm. The movement inside ROE generated a shear wave, which propagated from 35 mm (dashed-SWi) to 25 mm (dashed-SWf) of depth; (c) The power spectrum of a time window of 10 ms of the time signal at depths of 25 mm (SWf – dash-dot), 35 mm (SWi – dash), and 40 mm (ROE), respectively.
Figure 6. Shear wave propagating through the phantom after applying a magnetizing ield of 100 Hz for (a) 10 ms; (b) 15 ms; and (c) 20 ms
of the magnetic excitation. These images were spatial
representations, at ixed times, of the propagation of
shear wave shown in Figure 5b. We estimated cg by choosing a time interval between 10 ms to 20 ms and a total distance of 10 mm (from a depth of acquisition in 25 mm to 35 mm).
Moreover, we applied a Gaussian ilter with center frequency of 100 Hz and 50% bandwidth to provide
the shear wave with a monochromatic signal to allow
estimation of α and cp at 100 Hz. The group velocity,
the attenuation coeficient, and the phase velocity
were cg= 4.17 ± 0.74 m/s, α = 70.65 Neper/m, and cp = 2.88 ±0.07 m/s, respectively. Finally, elasticity
and viscosity, quantiied with the Kelvin-Voigt
model (Zhao et al., 2010), were 5.05 ± 0.18 kPa and 2.01 ± 0.09 Pa.s, respectively.
Discussion
Previous studies have reported on the applicability of MMUS and SDMMUS to obtain important
information about soft tissues. However, these studies
did not focus on the implementation of MMUS in clinical ultrasound scanners (Evertsson et al., 2014; Mehrmohammadi et al., 2011c; Oh et al., 2006).
The present paper shows that the clinical ultrasound equipment are able to control MMUS magnetic excitation synchronized with ultrasound imaging. Moreover, synchronization with the software-controlled platform clearly is a more practical approach to MMUS imaging. As proposed here, it is possible to employ distinct probes to combine a setup that uses the ultrasound equipment to control all the MMUS acquisition parameters with the B-mode in a clinical setting. Reported results here, show that the linear array and the convex array can be placed in different positions not affecting the generation of MMUS images which attest the viability of MMUS in a clinical environment.
The motion-tracking algorithm (Viola and Walker, 2005) can be used at a ixed window size of 2 mm and 50% overlap to give MMUS images with axial resolution of almost 1 mm. In this case, the minimum detectable amplitude is limited by the standard deviation of the motion-tracking algorithm, which is around 0.04 mm/s in the present case. In addition, our MATLAB 2014a program takes 20 seconds to process
a cineloop that lasts 100 ms with a PC ([email protected],
12GB DDR3). Analysis of the images provides a good estimation of the ROI area and helps calculation of the
mechanical parameters of soft tissues. However, in the
latter a variation in the proportion of the overlap, to generate Mv, can change the velocity and attenuation of SW. In addition, an R-square value higher than
0.95 is essential to make the estimated elasticity and viscosity more reliable.
The depth of acquisition (30 mm to 90 mm) of the default used preset here is adequate for most applications, including phantom and pre-clinical studies (Almeida et al., 2015; Colello Bruno et al., 2014). Here, the depth is limited to 30 mm because a minimal propagation path of 10 mm is necessary to estimate the attenuation and velocity of the shear wave by using Equations 2, 3, and 4 (Deffieux et al., 2009).
A magnetic ield with a few number of cycles and
below a frequency limit of fB = 150 Hz (see Table 1)
is suficient for MMUS and SDMMUS to prevent
the coil heating (Mehrmohammadi et al., 2011a).
Therefore, our MMUS pulse sequence satisies the
Nyquist restriction with a frame rate ~6.5 times of the Nyquist frequency and it doesn’t require a frame
rate above 2000 Hz. These values can be reached
in a depth of acquisition lower than 90 mm with clinically available ultrasounds. This alternative can be implemented in the clinical setting more easily than parallel beamforming techniques available on more expensive hardware (Jensen et al., 2013; Kaczkowski and Daigle, 2011).
Magnetic excitation lasting for a single cycle
sufices to locate the magnetic particles and generate broadband SW. In a single-cycle coniguration, tracking
the ultrasound for a TUS = 50 ms is suficient to analyze
MMUS and SDMMUS. Furthermore, the multiple
relections of the shear wave (which occur in the
phantom walls) decrease and the overall acquisition time diminishes as compared to harmonic excitation (Almeida et al, 2015).
According to (Oudry et al., 2009) the elastic property of a linear, isotropic, and incompressible
material is related to the shear storage modulus μ. This approach gives μ = 14095 kPa and Young’s
modulus of 42285 kPa, calculated by using cg = 4.17 m/s. These values are comparable to the dynamic method described by (Vieira et al., 2013). However, studies have already demonstrated that biological tissues are viscoelastic materials (Sarvazyan et al., 2013).
Considering parafin as a viscoelastic material, we must use the complex shear modulus μ = μ1 + jμ2 of the Kelvin-Voigt model, which employs the phase
velocity and attenuation coeficient as input parameters to obtain elasticity and viscosity, i.e., μ1 and μ2,
respectively. Gaussian ilter analysis (Parolai, 2009)
can be applied to estimate the attenuation coeficient and the phase velocity, to give μ1 = 5.05 kPa and
μ2 = 2.01 Pa.s at a frequency of 100 Hz. This provides
cycle facilitates ROE segmentation, which can be improved by applying a relative energy threshold of 30% to 50%. This improvement can help to segment a region containing a high concentration of particles that are probably aggregated.
Finally, this paper has presented a software-based platform for MMUS applications that provides an easy-to-use MMUS interface and allows quick
coniguration for MMUS or SDMMUS. Moreover,
addressing a default preset will help future applications
in the clinical setting without losing the lexibility of
the MMUS system. Future works should continue the development of this platform to provide real-time MMUS/SDMMUS at low cost and focus on different applications such as the mechanical characterization of tissues, which lead to implement a new clinical MMUS imaging modality.
Acknowledgements
We acknowledge FINEP (MCT2613/09), CAPES, CNPq, and FAPESP (2010/07639-9; 2012/18420-3;
2013/18854-6) for inancial support. We also thank
Gphantom for helping to produce tissue-mimicking samples.
References
Almeida TWJ, Sampaio DRT, Bruno AC, Pavan TZ, Carneiro AAO. Comparison between shear wave dispersion magneto motive ultrasound and transient elastography for measuring tissue-mimicking phantom viscoelasticity. IEEE Transactions on Ultrasonics, Ferroelectrics, and Frequency Control. 2015; 62(12):2138-45. PMid:26670853. http:// dx.doi.org/10.1109/TUFFC.2015.007353.
Almeida TWJ, Sampaio DRT, Pavan TZ, Carneiro AAO. Shear wave Vibro Magneto Acoustography for measuring tissue mimicking phantom elasticity and viscosity. In: 2014 IEEE International Ultrasonics Symposium (IUS); 2014. USA: IEEE; 2014. p. 1097-100. http://doi.org/10.1109/
ULTSYM.2014.0269.
Bruno AC, Sampaio DRT, Pavan TZ, Baffa O, Carneiro AAO. A hybrid transducer to evaluate stomach emptying by ultrasound and susceptometric measurements: an in vivo feasibility study. IEEE Transactions on Ultrasonics, Ferroelectrics, and Frequency Control. 2015; 62(7):1288-94. PMid:26168175. http://dx.doi.org/10.1109/TUFFC.2014.006950.
Cobbold RSC. Foundations of biomedical ultrasound. Oxford: Oxford University Press; 2006.
Colello Bruno A, Baffa O Fo, Carneiro AAO, Oliveira RB. Stomach emptying evaluation by ultrasound and susceptometric measurements with a hybrid transducer. In: 2014 IEEE International Ultrasonics Symposium (IUS); 2014. USA: IEEE; 2014. p. 1869-72. http://doi.org/10.1109/
ULTSYM.2014.0464.
Colello Bruno A, Pavan TZ, Baffa O, Oliveira Carneiro AA. A hybrid transducer to magnetically and ultrasonically evaluate magnetic fluids. IEEE Transactions on Ultrasonics, Ferroelectrics, and Frequency Control. 2013; 60(9):2004-12. PMid:24658731. http://dx.doi.org/10.1109/TUFFC.2013.2785.
Deffieux T, Montaldo G, Tanter M, Fink M. Shear Wave
Spectroscopy for In Vivo Quantification of Human Soft
Tissues Visco-Elasticity. IEEE Transactions on Medical Imaging. 2009; 28(3):313-22. PMid:19244004. http:// dx.doi.org/10.1109/TMI.2008.925077.
Evertsson M, Kjellman P, Cinthio M, Fredriksson S, in’t
Zandt R, Persson H, Jansson T. Multimodal detection of iron
oxide nanoparticles in rat lymph nodes using magnetomotive ultrasound imaging and magnetic resonance imaging.. IEEE Transactions on Ultrasonics, Ferroelectrics, and Frequency Control. 2014; 61(8):1276-83. PMid:25073135. http:// dx.doi.org/10.1109/TUFFC.2014.3034.
Hemmsen MC, Nikolov SI, Pedersen MM, Pihl MJ, Enevoldsen MS, Hansen JM, Jensen JA. Implementation
of a versatile research data acquisition system using a commercially available medical ultrasound scanner. IEEE Transactions on Ultrasonics, Ferroelectrics, and Frequency Control. 2012; 59(7):1487-99. PMid:22828844. http:// dx.doi.org/10.1109/TUFFC.2012.2349.
Jensen JA, Holten-Lund H, Nilsson RT, Hansen M, Larsen
UD, Domsten RP, Tomov BG, Stuart MB, Nikolov SI, Pihl
MJ, Yigang Du, Rasmussen JH, Rasmussen MF. SARUS:
a synthetic aperture real-time ultrasound system. IEEE Transactions on Ultrasonics, Ferroelectrics, and Frequency Control. 2013; 60(9):1838-52. PMid:24658717. http:// dx.doi.org/10.1109/TUFFC.2013.2770.
Jin Y, Jia C, Huang S-W, O’Donnell M, Gao X.
Multifunctional nanoparticles as coupled contrast agents. Nature Communications. 2010; 1(4):41. PMid:20975706. http://dx.doi.org/10.1038/ncomms1042.
Kaczkowski PJ, Daigle RE. The Verasonics ultrasound system as a pedagogic tool in teaching wave propagation, scattering, beamforming, and signal processing concepts in physics and engineering. The Journal of the Acoustical Society of America. 2011; 129(4):2648. http://dx.doi. org/10.1121/1.3588831.
Liu D, Ebbini ES. Real-time 2-D temperature imaging using ultrasound. IEEE Transactions on Biomedical Engineering. 2010; 57(1):12-6. PMid:19884075. http://dx.doi.org/10.1109/ TBME.2009.2035103.
McAleavey SA, Rubens DJ, Parker KJ. Doppler ultrasound imaging of magnetically vibrated brachytherapy seeds. IEEE Transactions on Biomedical Engineering. 2003; 50(2):252-5. PMid:12665040. http://dx.doi.org/10.1109/ TBME.2002.807644.
Mehrmohammadi M, Oh J, Mallidi S, Emelianov SY.
Pulsed magneto-motive ultrasound imaging using ultrasmall magnetic nanoprobes. Molecular Imaging. 2011a; 10(2):102-10. PMid:21439255.
Mehrmohammadi M, Qu M, Ma LL, Romanovicz
DK, Johnston KP, Sokolov KV, Emelianov SY. Pulsed
trafficking of magnetic nanoparticles. Nanotechnology. 2011b; 22(41):415105. PMid:21926454. http://dx.doi. org/10.1088/0957-4484/22/41/415105.
Mehrmohammadi M, Yoon KY, Qu M, Johnston KP, Emelianov SY. Enhanced pulsed magneto-motive ultrasound imaging
using superparamagnetic nanoclusters. Nanotechnology. 2011c; 22(4):045502. PMid:21157009. http://dx.doi. org/10.1088/0957-4484/22/4/045502.
Oh J, Feldman MD, Kim J, Condit C, Emelianov S, Milner TE. Detection of magnetic nanoparticles in tissue using magneto-motive ultrasound. Nanotechnology. 2006; 17(16):4183-90. PMid:21727557. http://dx.doi. org/10.1088/0957-4484/17/16/031.
Oudry J, Chen J, Glaser KJ, Miette V, Sandrin L, Ehman RL. Cross-validation of magnetic resonance elastography and ultrasound-based transient elastography: a preliminary phantom study. Journal of Magnetic Resonance Imaging. 2009; 30(5):1145-50. PMid:19856447. http://dx.doi. org/10.1002/jmri.21929.
Parolai S. Determination of dispersive phase velocities by complex seismic trace analysis of surface waves (CASW). Soil Dynamics and Earthquake Engineering. 2009; 29(3):517-24. http://dx.doi.org/10.1016/j.soildyn.2008.05.008.
Pavan TZ, Sampaio DRT, Carneiro AAO, Covas DT. Ultrasound-based transient elastography using a magnetic excitation. In: 2012 IEEE International Ultrasonics Symposium (IUS); 2012. USA: IEEE; 2012. p. 1846-9.
http://doi.org/10.1109/ULTSYM.2012.0463.
Qt. Qt cross-plaform framework [internet]. Santa Clara: Qt; 2016 [cited 2016 Apr 29]. Available from: http://www. qt.io/developers/
Qu M, Mallidi S, Mehrmohammadi M, Truby R, Homan K, Joshi P, Chen YS, Sokolov K, Emelianov S.
Magneto-photo-acoustic imaging. Biomedical Optics Express. 2011; 2(2):385-96. PMid:21339883. http://dx.doi.org/10.1364/ BOE.2.000385.
Sarvazyan AP, Urban MW, Greenleaf JF. Acoustic waves in medical imaging and diagnostics. Ultrasound in Medicine & Biology. 2013; 39(7):1133-46. PMid:23643056. http:// dx.doi.org/10.1016/j.ultrasmedbio.2013.02.006.
Shamdasani V, Bae U, Sikdar S, Yoo YM, Karadayi K, Managuli R, Kim Y. Research interface on a programmable ultrasound
scanner. Ultrasonics. 2008; 48(3):159-68. PMid:18234260. http://dx.doi.org/10.1016/j.ultras.2007.11.009.
Urban MW, Chalek C, Kinnick RR, Kinter TM, Haider B,
Greenleaf JF, Thomenius KE, Fatemi M. Implementation of vibro-acoustography on a clinical ultrasound system. IEEE Transactions on Ultrasonics, Ferroelectrics, and Frequency Control. 2011; 58(6):1169-81. PMid:21693399. http://dx.doi. org/10.1109/TUFFC.2011.1927.
Vieira SL, Pavan TZ, Junior JE, Carneiro AAO. Paraffin-gel tissue-mimicking material for ultrasound-guided needle biopsy phantom. Ultrasound in Medicine & Biology. 2013; 39(12):2477-84. PMid:24035622. http://dx.doi.org/10.1016/j. ultrasmedbio.2013.06.008.
Viola F, Walker WF. A spline-based algorithm for continuous time-delay estimation using sampled data. IEEE Transactions on Ultrasonics, Ferroelectrics, and Frequency Control. 2005; 52(1):80-93. PMid:15742564. http://dx.doi.org/10.1109/ TUFFC.2005.1397352.
Wilson T, Zagzebski J, Varghese T, Chen Q, Rao M. The Ultrasonix 500RP: a commercial ultrasound research interface. IEEE Transactions on Ultrasonics, Ferroelectrics, and Frequency Control. 2006; 53(10):1772-82. PMid:17036786. http://dx.doi.org/10.1109/TUFFC.2006.110.
Zahiri-Azar R, Baghani A, Salcudean SE, Rohling R. 2-D high-frame-rate dynamic elastography using delay compensated and angularly compounded motion vectors: preliminary results. IEEE Transactions on Ultrasonics, Ferroelectrics, and Frequency Control. 2010; 57(11):2421-36. PMid:21041130. http://dx.doi.org/10.1109/TUFFC.2010.1709.
Zahiri-Azar R, Salcudean SE. Motion estimation in ultrasound images using time domain cross correlation with prior estimates. IEEE Transactions on Biomedical Engineering. 2006; 53(10):1990-2000. PMid:17019863. http://dx.doi. org/10.1109/TBME.2006.881780.
Zhao H, Urban M, Greenleaf J, Chen S. Elasticity and
viscosity estimation from shear wave velocity and attenuation: a simulation study. In: 2010 IEEE International Ultrasonics Symposium (IUS); 2010. USA: IEEE; 2010. p. 1604-7.
http://doi.org/10.1109/ULTSYM.2010.5935462.
Authors
Diego Ronaldo Thomaz Sampaio1*, Felipe Wilker Grillo1, Alexandre Colello Bruno1, Theo Zeferino Pavan1,
Antonio Adilton Oliveira Carneiro1
1 Department of Physics, Faculty of Philosophy, Science and Letters of Ribeirão Preto, Universidade de São Paulo – USP,