DOI: http://dx.doi.org/10.1590/2446-4740.04115
*e-mail: [email protected]
Received: 22 January 2016 / Accepted: 20 January 2017
Reliability of biceps femoris and semitendinosus muscle architecture
measurements obtained with ultrasonography
Viviane Bastos de Oliveira, Simone Peres Carneiro, Liliam Fernandes de Oliveira*
Abstract Introduction: Currently, little attention is given to the muscle architecture reliability studies of the hamstring using a robust statistical. Our purpose was to determine the reliability of ultrasound measurements of muscle thickness, fascicle length and pennation angle of the biceps femoris and semitendinosus muscles, including heteroskedasticity and internal consistency analyses. Methods: Two images of biceps femoris and semitendinosus at 50% of the thigh length were acquired from 21 volunteers, in two visits. The parameters were measured three times in each image, and for each muscle. The reliability was analyzed by the intraclass correlation coeficient (ICC) and Cronbach’s alpha (αCronbach). The relative standard error of the measurements (%SEM) were calculated and Bland-Altman plots were generated. Results: All parameters presented excellent ICC for the three repeated measurements (ICC from 0.93 – 0.99) and moderate to excellent reliability intraday (ICC from 0.70 – 0.95) for both muscles. The present study indicates that ultrasound is a reliable tool to estimate the biceps femoris fascicle length (ICC = 0.97, αCronbach = 0.98, %SEM = 7.86) and semitendinosus (ICC = 0.90, αCronbach = 0.95, %SEM = 7.55), as well as the biceps femoris muscle thickness (ICC = 0.89, αCronbach = 0.94, %SEM = 10.23) and semitendinosus muscle thickness (ICC = 0.87, αCronbach = 0.93, %SEM = 1.35). At last, biceps femoris pennation angle (ICC = 0.93, αCronbach = 0.96 and %SEM = 4.36) and semitendinosus (ICC = 0.96, αCronbach = 0.98 and %SEM = 4.25) also had good repeatability. Conclusion: Ultrasonography show good repeatability in estimating of muscle architecture parameters.
Keywords: Reliability, Hamstring, Ultrasound, Muscle architecture.
Introduction
Muscle architecture is deined as the arrangement of muscle ibers and plays an important role in muscle
biomechanics studies (Lieber, 2010). Fiber length, pennation angle and muscle thickness are commonly measured as architecture parameters (Blazevich et al., 2006; Gomes et al., 2010; Lima et al., 2012; Martins et al., 2012). Technological advances in imaging techniques, as magnetic resonance imaging and ultrasound, enable to estimate muscle architecture parameters
in vivo (Blazevich et al., 2006; Chleboun et al., 2001; Lima et al., 2012). The architecture parameters can be well visualized by ultrasound at rest or during contraction (Gomes et al., 2010; Martins et al., 2012; Potier et al., 2009; Timmins et al., 2015). The reliability of muscle architecture measurements assessed using ultrasound is reported in many studies with different methodologies involving repeated measures between images, sessions, and raters (Legerlotz et al., 2010; Lima et al., 2012). These studies have been important to determine a reproducibility of muscle architecture parameters which are measured very often in training and rehabilitation protocols. Concerning the lower limbs, reliability studies in vivo are described for the
knee extensors (Lima et al., 2012; Noorkoiv et al.,
2010) and gastrocnemius muscles (Legerlotz et al., 2010; Martins et al., 2012). The reliability of muscle
architecture measurements of the knee lexors, using
ultrasound, is less examined in vivo (Chleboun et al., 2001; Gomes et al., 2010; Timmins et al., 2015).
Reliability studies of knee lexors focused mainly
on the biceps femoris long head muscle, and estimative
of the intraclass correlation coeficient (ICC) to
fascicle length, muscle thickness and pennation angle
ranged around 0.87 – 0.95 (Chleboun et al., 2001;
Timmins et al., 2015). For these parameters, it was
found coeficient of variation (CV) below 5% at rest.
Kellis et al. (2009) compared the muscle thickness, fascicle length and pennation length measurements of the semitendinosus and the biceps femoris long head muscles using a caliper to validate ultrasound images of a cadaveric limb. The authors showed good reliability for all parameters (ICC > 0.79) and standard
error of measurement (SEM) between 4.7 to 9.7%. Measurements of whole muscle thickness of the knee lexors reported by Gomes et al. (2010) was moderate
(ICC = 0.55), with 6.66% of CV and 9.6% of SEM. Statistical estimators as SEM and ICC are
commonly referred in reliability studies. As can be
seen in the previous paragraph, statistical estimators as
SEM presuppose absence of data heteroskedasticity,
which refers to the proportional increase of the data magnitude with the random errors (Atkinson and
Nevill, 1998). Furthermore, the internal consistency of the measurements estimates how items are correlated within group data, but has often been neglected in those studies (Hopkins, 2000). Based on this, the aim of this study is to analyze the absolute test-retest reliability of the muscle thickness, fascicle length and pennation angle of the biceps femoris long head and semitendinosus muscles using ultrasound. The absence of heteroskedasticity and internal consistency were included in the statistical analysis.
Methods
Participants
Twenty-one (N = 21) healthy volunteers participated in this study. The volunteers were 6 women and
15 men aged 28.08 ± 4.61 years, body mass of 74.03 ± 13.49 kg, and height of 1.74 ± 0.08 m.
They did not have any diseases in the lower limbs.
The study was approved by the Ethics and Research
Committee of the Clementino Fraga Filho University Hospital (n° 023/11). Informed consent was obtained from all individual participants included in the study. Volunteers were instructed not to perform any type of vigorous physical activity involving the lower limbs during the test.
Ultrasound measurements
Images acquisition were performed by the same trained examiner with an ultrasonographic system
operating in B-Mode (EUB-405; Hitachi, Tokyo, Japan) with a 7.5 MHz linear array probe. With the
participants at standing position, the examiner marked one point at 50% of the length of the thigh, determined by the distance between the greater trochanter and
head of the ibula. After that, the subject laid with the
legs relaxed in prone position for 15 minutes before image acquisition on the right leg.
The protocol was repeated in two days (interdays
reliability), with a 48-hour interval between visits.
Two images of biceps femoris long head and semitendinosus muscles were recorded by video
capture EasyCap USB 2.0 (UAF Co, Limited,
Shenzhen, China) in each day (intradays reliability). The gel was applied to ensure the acoustic coupling on the surface of the skin and a minimal compression of the probe under skin was adopted. The probe was positioned along the direction of the fascicles, where
the fascicular organization between the supericial and
deep aponeurosis on the muscle was better visualized. In each of the images, muscle thickness, fascicle length and pennation angle variables were measured
three times in random order using IMAGE J software (version 1.42; National Institute of Health, Bethesda,
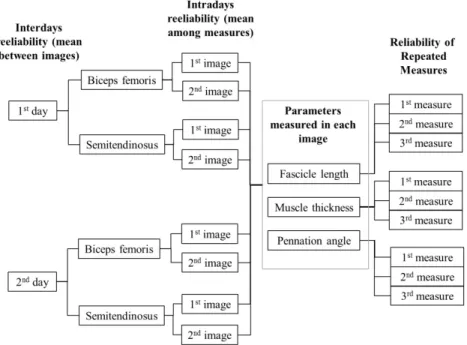
USA). Figure 1 explains the experimental design.
Figure 1. Experimental design for each participant. All volunteers (N = 21) participated of two days of the test, and two images for biceps
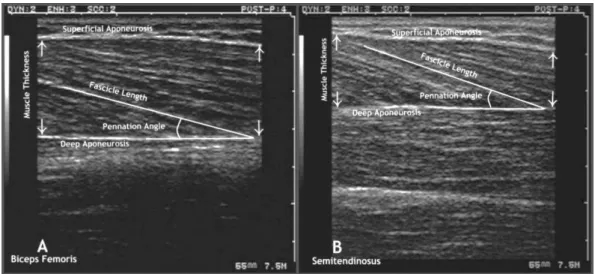
Muscle thickness was measured as the mean distance between the supericial and deep aponeurosis
at both image extremities. Fascicle length was estimated according to Blackburn and Pamukoff
(2014). Parameters were calculated as the relative
acute angle formed between the deep aponeurosis and muscle fascicle, as represented in Figure 2.
Statistical analysis
The distribution of each variable was examined with D’Agostino-Pearson test (smallest p-value found = 0.07). ANOVA repeated measurements was used to test statistical differences among measurements of each parameter in the same image, to compare two
images of the same days and, inally, all measurements
obtained in two days. The relative reliability among three repeated measurements, intra and interdays was
determined by ICC and αCronbach. Model ‘2,k’ (two-way
randow factor) proposed by Shrout and Fleiss (1979)
was chosen to calculate ICC. After, ICC was classiied
according to Koo and Li (2016) and presented with
its conidence interval. αCronbach was applied for
estimative of internal consistency. Statistical analysis was
performed using SPSS version 21 (IBM Corporation, New York, USA), with signiicance level of α = 0.05.
The heteroskedasticity was analysed by Levene’s test
and Bland-Altman plots in MATLAB (version 7.10; MathWorks, USA) to present limits of agreement of data.
If heteroskedasticity was present, then Bland-Altman plots were generated after logarithmic transformation of the data. Bland-Altman plots interdays were constructed to analyze graphically the distribution of data within the 95% limits of agreement and the
difference between days (bias). The relative coeficient
of variation (in percent - %CV) will be estimated in
the presence of heteroskedasticity, otherwise relative
standard error of measurement (in percent - %SEM)
will be calculated, based on the mean square error of the one-way repeated-measures ANOVA (Atkinson
and Nevill, 1998; Hopkins, 2000).
Results
Among three Measurements: Averages of fascicle length, muscle thickness and pennation angle for
biceps were 10.46 ± 2.01 cm; 2.04 ± 0.36 cm and 12.52 ± 1.92°, respectively. Fascicle length averages of semitendinosus were 10.15 ± 2.18 cm; muscle thickness 2.33 ± 0.40 cm and 14.28 ± 2.14º to pennation angle. There are no signiicant differences among groups of
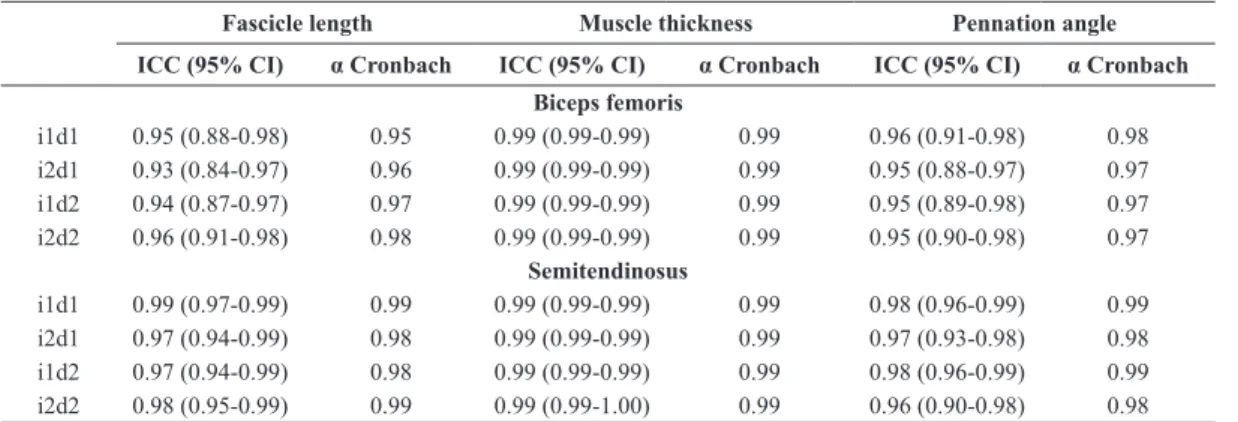
the three measurements of each parameter obtained in each image acquired in two days (F = 0.003 to 3.625; p = 0.071 to 0.955). The ICC2,3 and αCronbach of the three measurements are presented in Table 1. All variables presented excellent ICC for both muscles, ranging from 0.93-0.99. The αCronbach ranged from 0.95 – 0.99 for fascicle length, from 0.97 – 0.99 for pennation angle, and 0.99 for muscle thickness, demonstrating excellent internal consistency.
Intraday Reliability: There are no signiicant
differences for the six measurements obtained for the same parameter in the two images in two days
(F = 0.017 to 1.434; p = 0.245 to 0.898). The ICC2,3 of
the images for all variables are presented in Table 2. The ICC for all variables of biceps femoris and semitendinosus muscles were moderate to excellent
(ICC from 0.70-0.95), and there is increase conidence interval. Values of αCronbach also show excellent
internal consistency between images.
Interday Reliability: There are no signiicant
differences for all the 12 measurements obtained for the same parameter in the two images along of two days (F = 0.069 to 1.013 ; p = 0.326 to 0.795). In all parameters there was no heteroskedasticity
(F< 1.03; p > 0.37). Moreover, SEM was determined
for each parameter. Bland-Altman plots indicate good agreement for the interday measurements within 95% limits of agreement. All parameters were closer to the zero. Results of ICC2,3, αCronbach and SEM are presented in Figure 3. The ICC was excellent for all parameters. Variables had good internal consistency
(αCronbach > 0.96).
Discussion
The present study aimed to examine the reliability of the muscle thickness, pennation angle and fascicle length measurements from ultrasonographic images from the biceps femoris long head and semitendinosus muscles. Our main results show that measurements of muscle architecture parameters presented good reliability.
The muscle architecture values are in accordance to the in vivo (Chleboun et al., 2001; Potier et al., 2009)
and in vitro (Kellis et al., 2009; 2011; Ward et al.,
2009) literature. Biceps femoris fascicle length values
corroborate one that reported values around 10.4 cm
in vitro (Kellis et al., 2012). On other hand, fascicle
length values for semitendinosus were lower than
in vitro studies (13 to 19 cm) (Kellis et al., 2012;
Ward et al., 2009; Woodley and Mercer, 2005). This can be explained by the large variability of muscle architecture along the whole length of the hamstring components resulting in fascicles ranging from
5.2 to 18.3 cm (Woodley and Mercer, 2005). Additionaly, semitendinosus is divided in two compartments separated by a tendinous inscription, and there are
differences between the supericial and deep regions
(Woodley and Mercer, 2005). The authors alerted that this structure has been neglected and showed that the
supericial fascicles are signiicantly smaller than the deepest ones. We estimated the fascicle length using
trigonometric extrapolation as others (Blazevich et al., 2006; Legerlotz et al., 2010), which assumes that the fascicles are linear, ignoring the curvilinear arrangements (Noorkoiv et al., 2010). This could have resulted in underestimated semitendinosus fascicle length. As far
as we know, this is the irst reliability in vivo study
for the semitendinosus muscle.
In this work, ICC indicates repeatability and
αCronbach points out the internal consistency.
Our results show excellent internal consistency and repeatability when considering repeated measurements
Table 2. Intraday reliability for fascicle length, muscle thickness and pennation angle.
Fascicle length Muscle thickness Pennation angle
ICC (95% CI) α Cronbach ICC (95% CI) α Cronbach ICC (95% CI) α Cronbach Biceps Femoris
Day 1 0.82 (0.62-0.92) 0.90 0.89 (0.76-0.95) 0.94 0.92 (0.82-0.96) 0.96
Day 2 0.81 (0.59-0.91) 0.85 0.92 (0.81-0.96) 0.95 0.93 (0.84-0.97) 0.96
Semitendinosus
Day 1 0.70 (0.39-0.86) 0.82 0.95 (0.89-0.98) 0.97 0.87 (0.71-0.94) 0.93
Day 2 0.81 (0.60-0.92) 0.89 0.89 (0.75-0.95) 0.94 0.81 (0.59-0.91) 0.89
ICC = intraclass correlation coeficient; 95% CI = 95% conidence interval of the ICC; αCronbach = Cronbach’s alpha.
Table 1. Reliability coeficients of the three measurements.
Fascicle length Muscle thickness Pennation angle
ICC (95% CI) α Cronbach ICC (95% CI) α Cronbach ICC (95% CI) α Cronbach Biceps femoris
i1d1 0.95 (0.88-0.98) 0.95 0.99 (0.99-0.99) 0.99 0.96 (0.91-0.98) 0.98
i2d1 0.93 (0.84-0.97) 0.96 0.99 (0.99-0.99) 0.99 0.95 (0.88-0.97) 0.97
i1d2 0.94 (0.87-0.97) 0.97 0.99 (0.99-0.99) 0.99 0.95 (0.89-0.98) 0.97
i2d2 0.96 (0.91-0.98) 0.98 0.99 (0.99-0.99) 0.99 0.95 (0.90-0.98) 0.97
Semitendinosus
i1d1 0.99 (0.97-0.99) 0.99 0.99 (0.99-0.99) 0.99 0.98 (0.96-0.99) 0.99
i2d1 0.97 (0.94-0.99) 0.98 0.99 (0.99-0.99) 0.99 0.97 (0.93-0.98) 0.98
i1d2 0.97 (0.94-0.99) 0.98 0.99 (0.99-0.99) 0.99 0.98 (0.96-0.99) 0.99
i2d2 0.98 (0.95-0.99) 0.99 0.99 (0.99-1.00) 0.99 0.96 (0.90-0.98) 0.98
ICC = intraclass correlation coeficient; 95% CI = 95% conidence interval of the ICC; αCronbach = Cronbach’s alpha; i1 = image 1; i2 = image
in the same image for both muscles. There was a reduction of these ICC when different images at different days were analyzed followed by an increase
of the conidence interval. This behavior is hardly discussed in the literature, as only the mean coeficient
is reported among measurements (Gomes et al., 2010; Timmins et al., 2015). Bland-Altman plots showed small difference among measurements with bias close to zero, and almost all within limits of agreements.
Our results were similar to Timmins et al. (2015), who obtained high reproducibility (ICC > 0.93)
and SEM of 4.9%, notwithstanding they estimated
the fascicle length of biceps femoris by another methodology different from ours. Chleboun et al. (2001)
also demonstrated excellent reliability (ICC = 0.87)
for biceps femoris fascicle length measurements of the in vivo. In current work, the pennation angle had excellent reliability as the data reported in others
studies, ranging of 0.87 to 0.95 (Chleboun et al., 2001; Kellis et al., 2009; Timmins et al., 2015) and a SEM around 3.2 and 9.5% (Kellis et al., 2009; Timmins et al., 2015). Biceps femoris muscle thickness had excellent reliability, corroborating Timmins et al. (2015) that showed ICC of 0.95. Gomes et al. (2010) found a
moderate reliability (ICC = 0.55, CV = 6.66% and SEM = 4.9 mm) for knee lexors muscle thickness within
interdays measurements. In this case, components of
the lexors knee were singly evaluated.
Reliability data for semitendinosus ratiies the
in vitro literature. Kellis et al. (2009) reported for
fascicle length, muscle thickness and pennation angle values to ICC of 0.77, 0.90 and 0.97, respectively,
from six cadaveric limbs. The authors found SEM
below 10%. In vivo, high intrarater and interrater reproducibility was reported to semitendinosus
pennation angle (ICC > 0.83) (Kellis et al., 2011).
This study is the irst to describe the in vivo muscle
thickness and fascicle length measurements reliability for the semitendinosus muscle using ultrasound.
The present study indicates that muscle thickness, pennation angle and fascicle length for both biceps femoris long head and semitendinosus presented good reliability and repeatability in estimative of muscle architecture parameters by ultrasonography. The protocol of this study resulted in excellent ICC
and αCronbach, and these indices can to be used by
future studies approaching therapeutic interventions in muscle architecture hamstring.
Acknowledgements
The authors wish to acknowledge the inancial support of the Brazilian Research agencies CAPES, FINEP, FAPERJ and CNPq.
References
Atkinson G, Nevill AM. Statistical methods for assessing measurement error (reliability) in variables relevant to sports medicine. Sports Medicine. 1998; 26(4):217-38. PMid:9820922. http://dx.doi.org/10.2165/00007256-199826040-00002.
Blackburn J, Pamukoff D. Geometric and architectural contributions to hamstring musculotendinous stiffness. Clinical Biomechanics. 2014; 29(1):105-10. PMid:24220042. http://dx.doi.org/10.1016/j.clinbiomech.2013.10.011.
Blazevich AJ, Gill ND, Zhou S. Intra-and intermuscular variation in human quadriceps femoris architecture assessed in vivo. Journal of Anatomy. 2006; 209(3):289-310. PMid:16928199. http://dx.doi.org/10.1111/j.1469-7580.2006.00619.x.
Chleboun GS, France R, Crill MT, Braddock HK, Howell JN. In vivo measurement of fascicle length and pennation angle of the human biceps femoris muscle. Cells, Tissues, Organs. 2001; 169(4):401-9. PMid:11490120. http://dx.doi. org/10.1159/000047908.
Gomes PS, Meirelles CD, Leite SP, Montenegro CA. Confiabilidade da medida de espessuras musculares pela ultrassonografia. Revista Brasileira de Medicina do
Esporte. 2010; 16(1):41-5. http://dx.doi.org/10.1590/S1517-86922010000100008.
Hopkins WG. Measures of reliability in sports medicine and science. Sports Medicine. 2000; 30(1):1-15. PMid:10907753. http://dx.doi.org/10.2165/00007256-200030010-00001. Kellis E, Galanis N, Kapetanos G, Natsis K. Architectural differences between the hamstring muscles. Journal of Electromyography and Kinesiology. 2012; 22(4):520-6. PMid:22564790. http://dx.doi.org/10.1016/j.jelekin.2012.03.012. Kellis E, Galanis N, Natsis K, Kapetanos G. Validity of architectural properties of the hamstring muscles: correlation of ultrasound findings with cadaveric dissection. Journal of Biomechanics. 2009; 42(15):2549-54. PMid:19646698. http://dx.doi.org/10.1016/j.jbiomech.2009.07.011. Kellis E, Galanis N, Natsis K, Kapetanos G. In vivo and in vitro examination of the tendinous inscription of the human semitendinosus muscle. Cells, Tissues, Organs. 2011; 195(4):365-76. PMid:21828998. http://dx.doi. org/10.1159/000327574.
Koo TK, Li MY. A guideline of selecting and reporting intraclass correlation coefficients for reliability research. Journal of Chiropractic Medicine. 2016; 15(2):155-63. PMid:27330520. http://dx.doi.org/10.1016/j.jcm.2016.02.012. Legerlotz K, Smith HK, Hing WA. Variation and reliability of ultrasonographic quantification of the architecture of the medial gastrocnemius muscle in young children. Clinical Physiology and Functional Imaging. 2010; 30(3):198-205. http://dx.doi.org/10.1111/j.1475-097X.2010.00925.x. PMid:20184623.
Lieber RL. Skeletal muscle anatomy. In: Lieber RL. Skeletal muscle, structure, function, and plasticity: the physiological basis of rehabilitation. 3rd ed. Philadelphia: Lippincott Williams & Wilkins; 2010. p. 26-41.
Lima KM, Matta TT, Oliveira LF. Reliability of the rectus femoris muscle cross-sectional area measurements by ultrasonography. Clinical Physiology and Functional Imaging. 2012; 32(3):221-6. PMid:22487157. http://dx.doi. org/10.1111/j.1475-097X.2011.01115.x.
Martins NS, Peixinho CC, Oliveira LF. Confiabilidade de medidas de arquitetura muscular do tríceps sural por ultrassonografia de imagem. Revista Brasileira de Cineantropometria & Desempenho Humano. 2012; 14(2):212-20.
Noorkoiv M, Nosaka K, Blazevich AJ. Assessment of quadriceps muscle cross-sectional area by ultrasound extended-field-of-view imaging. European Journal of Applied Physiology. 2010; 109(4):631-9. PMid:20191287. http://dx.doi.org/10.1007/s00421-010-1402-1.
Potier T, Alexander C, Seynnes O. Effects of eccentric strength training on biceps femoris muscle architecture and knee joint range of movement. European Journal of Applied Physiology. 2009; 105(6):939-44. PMid:19271232. http:// dx.doi.org/10.1007/s00421-008-0980-7.
and Exercise. 2015; 47(5):905-13. http://dx.doi.org/10.1249/ MSS.0000000000000507.
Ward SR, Eng CM, Smallwood LH, Lieber RL. Are current measurements of lower extremity muscle architecture accurate? Clinical Orthopaedics and Related Research.
2009; 467(4):1074-82. http://dx.doi.org/10.1007/s11999-008-0594-8.
Woodley S, Mercer S. Hamstring muscles: architecture and innervation. Cells Tissues Organs. 2005; 179(3):125-41. http://dx.doi.org/10.1159/000085004.
Authors
Viviane Bastos de Oliveira1, Simone Peres Carneiro2, Liliam Fernandes de Oliveira1,2*
1 Biomedical Engineering Program, Instituto Alberto Luiz Coimbra de Pós-Graduação e Pesquisa em Engenharia –
COPPE, Centro de Tecnologia, Universidade Federal do Rio de Janeiro – UFRJ, Avenida Horácio Macedo, 2030, Cidade Universitária, CEP 21941-598, Rio de Janeiro, RJ, Brazil.
2 School of Physical Education and Sports, Department of Biosciences, Universidade Federal do Rio de Janeiro – UFRJ,