Aparecida M. Kawamoto Instituto de Aeronáutica e Espaço São José dos Campos – Brazil [email protected]
Luiz Cláudio Pardini* Instituto de Aeronáutica e Espaço São José dos Campos – Brazil
Milton Faria Diniz Instituto de Aeronáutica e Espaço São José dos Campos – Brazil
Vera Lúcia Lourenço Instituto de Aeronáutica e Espaço
São José dos Campos – Brazil [email protected]
Marta Ferreira K. Takahashi Instituto de Aeronáutica e Espaço
São José dos Campos – Brazil [email protected]
*author for correspondence
Synthesis of a boron modiied
phenolic resin
Abstract: Phenolic resin has long been used as matrix for composites mainly because of its lame retardant behavior and high char yield after
pyrolysis, which results in a self supporting structure. The addition of ceramic powders, such as SiC and B4C, as illers to the phenolic resin,
results in better thermo-oxidative stability, but as drawbacks, it has poor homogeneity, adhesion and processing dificulties during molding of
the composites. The addition of single elements, such as boron, silicon and phosphorus in the main backbone of the thermo-set resin is a new strategy to obtain special high performance resins, which results in higher mechanical properties, avoiding the drawbacks of simply adding
illers, which results in enhanced thermo-oxidative stability compared to
conventional phenol-formaldehyde resins. Therefore, the product can have several applications, including the use as ablative thermal protection for thermo-structural composites. This work describes the preparation of
a boron-modiied phenolic resin (BPR) using salicyl alcohol and boric acid. The reaction was performed in reluxing toluene for a period of four
hours, which produced a very high viscosity amber resin in 90% yield.The
inal structure of the compound, the boric acid double, substituted at the hydroxyl group of the aromatic ring, was determined with the help of the
Infrared Spectroscopy, 1H-NMR, TGA-DSC and boron elemental analysis.
The absorption band of the group B-O at 1349 cm-1 can be visualized at
the FT-IR spectrum. 1H-NMR spectra showed peaks at 4.97-5.04 ppm and 3.60-3.90 ppm assigned to belong to CH2OH groups from the alcohol.
The elemental analysis was also performed for boron determination.The
product has also been tested in carbon and silicon ibers composite for
the use in thermal structure. The results of the tests showed composites with superior mechanical properties when compared with the conventional phenolic resin.
Keywords: Phenolic resin, Boron, Thermal protection, Oxidizing agents.
LIST OF SYMBOLS
Ar-H Aromatic protons
BPFR Boron-containing phenol-formaldehyde resin
DMA Dynamic mechanical analysis
DSC Differential scanning calorimetry
DTG Differential thermogravimetry
FT-IR Fourier transform spectroscopy
GPC Gel permeation chromatography
HMTA Hexamethylenetetramine
ILSS Interlaminar shear strength
Mn Molecular weight (average number)
Mw Molecular weight (average weight)
NMR Nuclear magnetic resonance
OH Hydroxyl group
PC Polycarbonates
PF Phenol formaldehyde resin
PPG Polypropyleneglycol
PS Polystyrene
TLC Thin layer chromatrography
Tc Critical temperature
Tg Glass transition temperature
TG Thermogravimetric analysis
INTRODUCTION
Phenolic resin was the irst synthetic polymer. The processing technique was carried out irstly by A. von Bayer, in 1872,
and further patented by Leo H. Baekeland in 1907(Knop and Pilato, 1985). Since then, thermo-set phenolics have wide industrial and commercial application (Whitehouse, Pritchett and Barnett, 1968). Due to their excellent ablative properties and structural integrity, they have been used as high performance thermal protection systems, such as nose caps and exit cones for rocket nozzles (Knop and Pilato, 1985; Segal, 1967; Schmidt and Graig, 1982). They also have widely use in thermal insulation materials, molding compounds, foundry, coating material, wood products industry and in many other composite materials (Casiraghi
et al., 1980). Another application is the use as precursor of solid carbon materials as a matrix for heat resistant materials (Lenghaus, Qiao and Solomon, 2000), and also as adhesives Received: 14/06/10
for production of wood agglomerates (Park et al., 1999). Another important application of phenolics is as a polymeric blend with other polymers, which produces materials with superior physical properties, such as tensile strength and modulus (Okoroafor, Villemaire and Agassant, 1992).
Phenolic resins are synthesized by the reaction of phenol with formaldehyde. These resins can be divided into two main groups according to reaction conditions that are used, such as pH of the catalyst and the formaldehyde/ phenol ratio. Formaldehyde has a functionality of two and phenol, of three. Phenol will react with the OH group at the para and at the two ortho position. The two meta positions are un-reactive. If the reaction proceeds with
excess of one or two moles of formaldehyde, the inal
product is a thermo-set resin. If the reaction proceeds
with excess of phenol, it has suficient functionality, but
not enough cross linking molecules to be thermo-set or thermoplastic resin.
Under acidic conditions, the reactions of phenol with formaldehyde with excess of phenol lead to the formation of novolac type resin (Fig. 1). The resole type resin is formed under alkaline conditions and excess of formaldehyde (Fig. 2).
The main difference between novolac and resole resins is the presence of the reactive methylol groups and, occasionally,
dimethylene-ether linkage in the resoles instead of the condensation products linked with methylene bridges, as in the case of novolacs. Therefore, novolac resins are thermally cured by addition of a methylene cross linker – hexamethylenetetramine (HMTA) or paraformaldehyde. Resoles are cured only by application of heat.
Phenol formaldehyde resins (PF) are characterized by their capability of forming hydrogen bonds with polymers containing carbonyl or carbonate groups (Fahrenholtz and Kwei, 1981), or forming covalent bonding if the polymer contains complementary hydroxyl groups. In addition, the phenyl ring structure of phenolic resin is capable of forming secondary bonding by π-π overlap, which is important for building these polymers.
The inal properties of these materials depend on the
synthesis and operating conditions. Details of the curing process are responsible for many of the physical and mechanical characteristics: the cure time and temperature
inluence, the resulting glass transition temperature (Tg)
and the elastic modulus. Thus, structural information and explicit knowledge relevant to the curing process is important and essential for understanding and improving the synthesis process and the use of phenolic resins.
The most commercially available phenolic resin has the average molecular weight (Mw) in the range of 500 to 1000 gmol-1. The molecular weight of phenolic resins depends on the formaldehyde/phenol ratio, the type of catalyst (acidic or alkaline), and the time and temperature of the reaction, but the most important factor for controlling the molecular weight of PF is the molar ratio. Figure 3 shows the resulting type of phenolic resin, resole or novolac, as a function of the formaldehyde/phenol ratio and molecular weight (Lemon, 1985).
OH
+ CH2O
OH OH
CH2OH
CH2OH +
OH
OH OH
CH3
OH
... ...
OH CH2
OH HO
Figure 1: Structure of novolac resin.
CH2OH
OH OH
H2C
CH2 OH
CH2OH
CH2OH HO OH
+ CH2O
OH
OH
OH CH2OH
CH2OH
CH2OH
CH2OH HOH2C
CH2OH
HOH2C
OH CH2OH
CH2O
Figure 2: Structure of resole resin.
The most common catalyst of phenol-formaldehyde novolac resin synthesis is: sodium, potassium and lithium hydroxides, and rarely hydroxides of divalent metals (magnesium, calcium or barium) (Knop and Sheib, 1979; Knop and Pilato, 1985). Carbonates (Na) and oxides (Ca or Mg) can also be used as catalyst in the synthesis (Polish Patent 109 966, 1981; Polish Patent 150 036, 1990). Tertiary amines, in particular triethylamine, were claimed recently as the catalyst for the resole resin
synthesis(Russina Patent 2 028 313, 1995; US Patent 4
045 398, 1977).
Knop (1979,1985) found that the substitution of
phenol with formaldehyde in the ortho-position versus
para-position increased in the following sequence of hydroxide catalyst metal: K < Na < Li < Ba < Sr < Ca < Mg. Grenier-Loustalot et al. (1996) concluded that the rate at which phenol disappeared from the reaction mixture depended on the metal valence in the hydroxide catalyst and on the size of the hydrated metal cation. Magnesium, calcium and barium hydroxides were found to be more effective catalyst than lithium, sodium or potassium hydroxides.
Although phenolic resin has good thermo-oxidative resistance, extensive research has been done to improve
their thermal properties through modiication of their
structure with introduction of some elements, such as boron or phosphorus and even silicon.
The boron-containing phenol-formaldehyde resin (BPFR)
is a modiication of the phenolic resin. It is obtained with
the introduction of boron in the main backbone of the phenolic resin. The BPFR resin has good heat-resistance, mechanical properties, electric properties and absorbance of neutron radiation (Abdalla, 2003). There are several works that describe the synthesis and applications of BPFR (America Patash Chem Corp, 1964; Gao and Liu, 1999; Gao and Liu, 2001). This resin is usually synthesized by the formaldehyde method, in which phenol borate synthesized from phenol and boric acid is followed by the reaction with poly-formaldehyde. Another popular method is the synthesis using the method of formalim (Gao and Liu, 1999), which consists in the reaction of phenol with formaldehyde to form the alcohol and then followed the reaction with boric acid.
MATERIALS AND EXPERIMENTAL
Materials
Solvents, boric acid and 2-hydroxy benzyl alcohol were purchased from Aldrich, Fluka or Merck, according to their required purity, price and availability. Butanediol,
dichloromethane and epichlorhydrin were puriied by
distillation prior to use.
Experimental
Synthesis
Boric acid and 2-hydroxy benzyl alcohol in a ratio of 1:2 were dissolved in toluene and placed in a four-necked
round bottom lask equipped with a stirrer, thermometer,
condenser and a Dean Stark system, and stirred under
relux for the period of four hours. Over this period, the
amount of water collect at the Dean Stark was according to the calculated amount, and also the total disappearance of the alcohol can be observed on the TLC plate. Then, the solvent was evaporated giving a high viscous amber product in 89.4% yield.
The reactions were performed by the use of the Dean Stark system with a heat controlled oil bath, and they were followed through the amount of water that were released during the reaction and also from thin layer chromatography.
1H-NMR, 13C-NMR analysis were conducted on a 300
MHz Brüker DPX spectrometer using methyl-d6 sulfoxide
as solvent. The proton and carbon chemical shifts are recorded in ppm and calibrated on the solvents as internal standard. Infrared spectroscopy has been recorded by a Magna-IR spectrometer 750 Fa. Thermo Nicolet (4000 to 400 cm-1, 40 scans).
Resin characterization and composite processing and characterization
The characterization of boron-modiied phenolic resin,
uncured and cured, was performed by thermal (DSC and TG) and mechanical analysis. DSC analyses were carried out in a PerkinElmer Pyris 1 DSC analyser, at 20°C/min in N2 (20 mL/min), mass of 11 mg in a tightly closed aluminium sample holder and gave information on the curing process, temperature and heat of the reaction and also the glass transition temperature for the cured resin. The glass transition was measured in the second heating.
under synthetic air (20 mL/min) at 2.5 and 10oC/min, platinum pans (2 mg).
The rheological characterization of n on cured resin was performed on a Rheometrics SR5 rheometer by using a parallel plate measuring system. The rheological
characterization helps to obtain viscosity proiles as a
function of time, temperature and shear rate, which in
turn can be used to deine the processing window of the
neat resin.
Thermal diffusivity measurements were carried out according to ASTM E1461-07 in the temperature range of 25 to 175°C. The thermal diffusivity of a material depends on its thermal conductivity, density and heat capacity according to Equation 1. The thermal diffusivity characterizes the heat transport in material during transient regime conditions.
Thermal diffusivity Cp
ρκ
. (1)
Where:
k = thermal conductivity;
ρ = density; Cp = heat capacity.
A composite material was molded in the form of a plate by using a lab-scale autoclave. The composite was
molded with silica fabric iber (650 g/m2) and the
boron-modiied phenolic resin. The cure schedule was made
according to the cycle developed in this work. A 55%
iber volume fraction was measured in the silica iber/
resin composite.
The composite was characterized by interlaminar and Iosipescu shear tests. The interlaminar shear strength was measured according to ASTM D2344-06, using specimens with dimensions showed in Fig. 4. Accepted failure modes for interlaminar shear are characterized by tiny elongated cracks between laminae at the center of the specimen. The interlaminar shear strength is calculated according to the Equation 2.
τ
average PruptureA
⋅3
4 (2)
Where:
taverage: apparent interlaminar shear strengh (MPa);
Prupture: ultimate load corresponding to the rupture of the sample (N);
A: cross section area calculated by W (width) x t (thickness) (mm2).
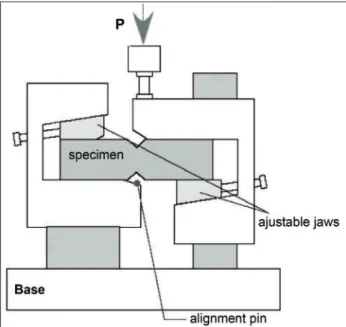
The Iosipescu shear test was performed according to ASTM D5379-98. The strength and modulus of composite
specimen were measured in the direction 1-2 of the composite, as shown in Fig. 5. In this case, the loading is parallel to the stacked layers. The test jig used for the tests is showed in Fig. 6. Accepted Iosipescu shear failure modes are mainly between the V-notches.
∅=3 mm
∅=6 mm
P
P/2 P/2
load span specimen
Figure 4: Dimensions of the specimens and its assembling on the equipment for performing the tests according to ASTM 2344-06.
Figure 5: Specimen geometry for Iosipescu shear tests in the 1-2 plane.
3 1
2
The Iosipescu shear strength can be calculated by the Equation 3:
τ
P
A
ultimate (3)
Where:
t: the aparent average shear strength, in MPa;
Pultimate: the ultimate load of the sample at rupture – N;
A: the cross section area of the specimen (width x thickness), between the V-notches (mm2).
RESULTS AND DISCUSSION
Structure of boron modiied phenolic resin
According to the literature (Xu, 1976; Tu and Wei, 1981; Heefel et al., 1975), the initial condensation product of salicyl alcohol and boric acid consists mainly of phenol borate and some salicyl alcohol borate as shown in Fig. 7.
Several attempts has been done to obtain the boron resin using the formalin method, however, it was not possible to get a monomer free from side compounds and therefore the following reaction to get BPFR resin did not proceed. The alternative proposed in this project was to get the monomer starting from the available pure alcohol and reaction with boric acid. Then, the reaction was performed according to Scheme 3.
Figure 7: Condensation products from the reaction of salicyl alcohol and boric acid.
O O B OH O HO B OH O
Scheme 1: Method for the synthesis of salicyl alcohol.
OH
+ C O H
H 70oC NAOH
OH
CH2OH
HOH2C
HOH2C
OH
CH2
HOH2C
HOH2C
OH
HOH2C
OH
CH2OCH2
HOH2C
HOH2C
OH
CH2OH
HOH2C
+
OH
CH2OH
OH
CH2OH
HOH2C
+ +
Scheme 2: Method for synthesis of BPFR resin.
OH
+
C O H H
300oC
O
B(OH)3 B
3
O
HOB
2
(HO)2BO +H2O
+ +
O B
3 +
150oC O B
3 +BO
3 + B O
3 HOH2C
CH2OH CH
2OH
HOH2C HOH2C
3
Scheme 3: Synthesis of BPFR monomer.
OH CH2OH
+ H3BO3
B
O O
O HOH2C
CH2OH
CH2OH
(1) (3) + (3)H2O
In this work, the synthesis has been done using the Formalin (Gao and Liu, 1999) method, that consists in the initial formation of salicyl alcohol (reaction of phenol with formaldehyde) that followed the reaction with boric acid. However, the reaction of phenol with formaldehyde produced a mixture of several compounds as shown in Scheme 1 (Abdalla, Ludwick and Mitchell, 2003).
This mixture is dificult to separate, causing problems
to follow the subsequent reaction to obtain the desired monomer.
Hirohata et al. (Hirohata, Misaki and Yoshii, 1987) used the strategy of the reaction of phenol with boric acid followed reaction with formaldehyde. However, this also leads to a mixture of several compounds that is very
dificult to separate, as shown in Scheme 2.
However, it has been proved (Gao and Liu, 1999) that the reaction of salicyl alcohol with boric acid proceeded with the ratio of 50% in 50 minutes, while the reaction of phenol was only 4% in 150 minutes. Therefore, it is evident that the condensation product has salicyl alcohol groups attached to oxygen of boric acid (Scheme 3).
In order to replace the three OH groups at boric acid to alcohol, the molar ratio of 3:1 (alcohol:acid) was used, which would produce the compound shown in Scheme 4. As it has been described at experimental part, the reaction was performed in toluene at 120°C. However, the resulting compound has only two OH groups replaced by the alcohol. The third group could not be replaced, and this might be due to steric hindrance. After four hours, the
reaction is inished, as it can be visualized from the water
that is formed and collected at the Dean Stark. When the reaction was left longer (approximately 12 hours), it
was veriied the formation of side compounds, resulted
When the reaction is interrupted after four hours, the product is only the compound resulting from the condensation of boric acid with salicylic acid (Knop and Pilato, 1985), an amber and high-viscous compound. The non reacted salicylic acid precipitated as white solid.
Analysis of the boron modiied phenolic resin
Figure 8 shows the FT-IR spectrum of the boron resin. The main bands are in agreement with the bands coming from boron and the alcohol. The region at 3400-3300 cm-1 shows characteristic bands for alcohol and acid. The band at 1592 cm-1 belongs to the alcohol. Boric acid has a strong and characteristic band at 1480 cm-1 and the alcohol has several bands between 1482 and 1417 cm-1. Therefore, the bands that were observed between 1493 and 1421 cm-1 belong to both acid and alcohol. The bands at 1395 and 1234 cm-1 belong only to alcohol, since these bands are
not present in the acid, and the band at 1350 and 1300 cm-1 (BO) refers to the acid. The strong band at 1200 cm-1 and the remaining bands at 700 cm-1 refer to alcohol and acid (Smith, 1999).
In general, the 1H-NMR and 13CNMR spectra of the BPFR resins are always complicated to analyze, which
relects the complexity of the boron containing system.
The 1H-NMR spectrum is shown in Fig. 9. The wide resonance lines (multiplets) at the region of 6.89-7.19 ppm refer to the aromatic protons (Ar-H). The resonances at the region of 4.97-5.04 ppm and 3.60-3.90 ppm are assigned to the methylene groups (CH2OH) and ether linkages (CH2OR). The peaks at the region of 2.5 ppm are assigned to the OH groups that come from boric acid and salicylic alcohol.
The elemental analysis of the resin showed 66.49% carbon, 5.36% hydrogen, 13.96% oxygen and 4.46% boron. The calculation of the percentage value of boron that can be present in a resin (pre-polymer), obtained from boric acid reaction, gave a value of about 4%. The calculation was carried out based on the compound resulted from the reaction of boric acid with two molecules of salicyl alcohol (Fig. 10a). The difference resulted from the measured elemental analysis was about 10%, which might be from the small amount of product containing methylol group condensation that started to form (Fig. 10b), which presents higher content of boron. Scheme 4: Synthesis of boron resin.
OH
CH2
OH
OH
CH2OCH2
OH OH
CH2OH
H3BO3
B O
OH
O
CH2OH
CH2OH
H2O
+
+ +
+
(1)
(2)
(3)
Figure 8: Fourier transform spectroscopy (FT-IR) for boron resin. Boron resin 6
Durascope
NX08.548
735
751
848
936
1005
1039
10891108
1201
1234
1252
1272
1301
1349
13951421
1456
1493
1592
3400
-0.00 0.05 0.10 0.15 0.20 0.25 0.30 0.35 0.40 0.45 0.50 0.55 0.60 0.65 0.70 0.75 0.80
Absorbance
1000 1500
2000 2500
3000 3500
4000
Differential scanning calorimetry analysis
With differential scanning calorimetry (DSC) measurement
is possible to get a thermal proile of the investigated
sample under the conditions of thermal dynamic or isothermal scanning. The results of the measurements produce the knowledge of the reaction behavior, the beginning, the end and at which point the reaction reach its maximum peak. It also gives the heat of reaction and the glass transition temperature when operated under dynamic scanning.
Figure 11 shows the DSC curve of the boron phenolic resin. The reaction starts at around 205°C, with a peak in 224°C, and ends at 260°C. The heat of reaction is approximately 120 J/g.The Tg at DSC from cured samples is shown in Fig. 12. The value of Tg for the boron phenolic resin is approximately 266.4°C, which is superior to the commercial phenolic resin that has a value of 130°C.
Table 1 summarized the results obtained from the isothermal cure showed in Fig. 10. These curves give the possibility to calculate the partial heat of reaction, which subsequently could be used for determining the rate of conversion of the ongoing curing reaction.
Thermogravimetric analysis
The thermogravimetric (TG) analysis is an important thermal analysis that shows the thermal stability of the Figure 9: 1H-NMR of boron resin.
KAWA2713_BORON RESIN 6_1H-NMR.ESP
8.0 7.5 7.0 6.5 6.0 5.5 5.0 4.5 4.0 3.5 3.0 2.5 2.0
Chemical Shift (ppm) 0
0.05 0.10 0.15 0.20 0.25 0.30 0.35 0.40 0.45 0.50
Normalized Intensity
0.03 0.09
0.23 0.65
7.12
7.00
6.93
6.84
6.82
6.69 6.68
6.67 6.67
6.65
5.04
4.96
4.81 4.55
3.87 3.81 3.78
3.70
2.51
2.51
2.50
2.50
2.49
Figure 10: (a) Molecules of salicyl alcohol (b) product containing methylol group condensation.
CH2OH
O B
O O
CH2
CH2OH
O B
OH O
CH2OH
Figure 10a Figure 10b
materials. Also, the proile of decomposition process and
yield of the material associated with the thermal treatment can be obtained.
The TG curve of a uncured boron-modiied phenolic resin
is shown in Fig. 13. It shows two stages of weight loss. The
irst stage started around room temperature and continued
until 250°C, with 12.5 ± 0.3% of weight loss, which is related to the curing reaction. In the second stage, 250-790°C, the weight loss was 25.7 ± 0.2%, which was due to the decomposition of the polymer, leaving a carbonaceous residue equal to 61.9 ± 0.4% of the initial mass.
around 25%, which results in a signiicant yield of 75%.
As a comparison, condensation cure phenolic resins show a carbon yield of 45% tested under similar conditions. In synthetic air, the material showed a similar behavior, but with a weight loss of 10% up to 500°C, and 27% up to 800°C, shows an yield of 72%.
Figure 12: DSC analysis for determining glass transition temperature of boron resin after DSC curing. The red line is the speciic heat curve.
250.00°C (12,5 ± 0,3)%
792.00°C (25,7 ± 0,2)%
Residue (61,9 ± 0,4)%
-0.5 0.0 0.5 1.0 1.5 2.0 2.5 3.0 3.5 4.0
[
]
D
e
ri
v.
W
e
ig
h
t
(%
/m
in
)
–
–
–
–
–
0 20 40 60 80 100
[ ] Weight (%) – – – –
0 200 400 600 800
Temperature (°C) Universal V4.1D TA Instruments
Figure 13: TG and DTG curves of uncured boron resin (nitrogen, 10°C/min).
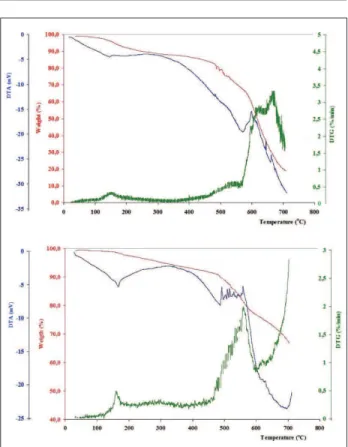
Figures 14 and 15 show the TG analysis for a cured
boron-modiied phenolic resin in nitrogen atmosphere
and synthetic air atmosphere, respectively. In nitrogen, the material showed a maximum weight loss of 5% up
to 500°C, when an inlexion begins until, approximately,
600°C. Up to 800°C, the material showed a weight loss
Figure 14: TG of the cured boron-modiied phenolic resin in nitrogen (20 mL/min). Heating rate = 10°C/min; sample weight = 12 mg.
Figure 15: TG of cured boron-modiied phenolic resin in synthetic air (20 mL/min). Heating rate = 10°C/min; sample weight = 11.6 mg.
According to Costa (Costa et al., 1997), air oxidation takes place in lower temperatures (~300°C) than when the resin
was heated in an inert atmosphere. This was conirmed in the present work for the boron-modiied phenolic
resin (Figs. 14 and 15). Although similar morphology rearrangements can take place, in the presence of an oxidizing atmosphere, oxidative degradation is not an important pyrolysis pathway, as mentioned by Costa et al. (1997).
In the case of the boron-modiied phenolic resin, an
hyperbranched structure can take place after curing, which increases the carbon yield (~80%/mass in nitrogen at 800°C) in the air in relation to the conventional phenol formaldehyde resin (~45%/mass in nitrogen at 800°C) (Costa et al., 1997).
On the other hand, Liu et al. (2007) studied the pyrolysis
and the structure of hyperbranched polyborate modiied
phenolic resin using thermogravimetry. The resin was prepared by mixing resole with boric acid in acetone. The yield in weight loss obtained by thermogravimetry was found to be ~75%/mass in nitrogen up to 800°C, which is similar to the result found in the present work (Fig. 14).
The thermogravimetric studies performed on the
boron-modiied phenolic resin show the outstanding performance
of this material in oxidizing environment (Fig. 16) in relation to the commercial phenolic resin (Fig. 17). Boron has been used as an oxidation resistant material for carbon materials, as a surface coating or as a mixture in the formulation of the carbon material (Castro, 1991; McKee, 1991). So, it is possible that the B-C linkages formed in the resin during charring can enhance oxidation resistance during temperature excursion.
Figures 16 and 17 show curing process for boron phenolic resin comparatively to CR2830 phenol-formaldehyde resin at different heating rate in synthetic air. The results can prove the superior thermal properties of the
boron-modiied phenolic resin when compared with the
commercial phenolic resin that are in current use at the institute in the thermal protection of the Rocket program. Additionally, the high yield (~70%/mass at 700°C) of the
resulting carbon from boron-modiied resin, compared to the commercial phenolic resin, is a signiicant result
for decreasing the processing time for Carbon/Carbon composite, which consequently reduces the number of cycles required for the pyrolysis/impregnation processes.
Results of thermal diffusivity
Figure 18 shows the curve of thermal diffusivity for boron phenolic resin. The majority of the polymers have thermal
diffusivity in the range of 1.0 x 10⁻⁷ and 1.5 x 10⁻⁷ m2/s at room temperature (Santos, Mummery and Wallwork,
2005). Thermal diffusivity of unilled phenolic resin is
hardly found in literature. Besides, thermal properties
of unilled polymer materials are given by their thermal
conductivity. Anyway, the thermal conductivity of
an unilled phenolic resin at 25°C is 0.21 W/m.K and
increases to 0.28 W/m.K at 316°C (US Army Armament Research, Development, and Engineering Center, 1991).
The speciic heat of a typical phenolic resin is ~1.2 kJ/
kg.K and the density is ~1250 kg/m3 – this results in a thermal diffusivity of ~0.14 mm2/s at 25°C, which agrees
reasonably with the result found for the boron-modiied
phenolic resin (Fig. 18). At temperatures higher than 200°C, phenolic resin undergoes morphological changes and the thermal conductivity at 316°C can only be taken as a reference.
Rheological characterization
Figure 19 shows results of the storage shear modulus (G’), loss modulus (G”), Tan d and viscosity (η) as a function of shear stress (t).
Figure 17: TG/DTA curves for a cured CR2830 phenol-formaldehyde resin. (A) Rate of heating of 2.5°C/ min, in synthetic air, weight of the sample = 2.432 mg; (B) Rate of heating of 10°C/min, in synthetic air, weight of the sample = 2.206 mg.
Figure 18: Thermal diffusivity as a function of temperature for the cured boron-modiied phenolic resin.
Figure 19: Elastic modulus (G’), loss modulus (G”), tan d and viscosity (η) versus shear stress for boron phenolic resin at room temperature (25°C).
t
a
n
(
) (
)
[
]
E
ta
*
(
)
[
P
a
-s
]
G
'
(
)
[P
a
]
G
"
(
)
[P
a
]
τ [Pa]
104
103
103
103
102
102
102
101
101
100
10-1
100
104
δ
The shear stress deines the conditions for testing the neat
resin, which corresponds to the near newtonian behavior related to the storage shear modulus. For the phenolic boron resin, the chosen value for shear stress was 6 Pa, which corresponds to the region of maximum G’. This value was kept constant for all the other tests.
Figure 20 shows the plot of viscosity (η) as a function of
temperature for the boron-modiied phenolic resin. It can
be seen that the minimum viscosity of the resin reach a value lower than 20 Pa at 60°C, keeping it constant up to approximately 200°C. This indicates that, in this range of temperature, the cure reaction is latent. This consequently
results in beneits for processing as, for instance, a longer
pot life for the resin. In this range of temperature (60-200°C), is not temperature dependent, which characterizes a polymer that contains mainly olygomers.
Figure 20: Dynamic scanning at the rate of 5°C/min for shear elastic modulus (G’), shear loss modulus (G”), tan
d and viscosity (η) at frequency of 1 rad/s and shear stress of 6 Pa.
0 200 400 600 800 1000 1200 1400 1600 1800
0 25 50 75 100 125 150 175 200 225 250 Time (s)
V
is
c
os
ity (
*)
P
a
.s
η
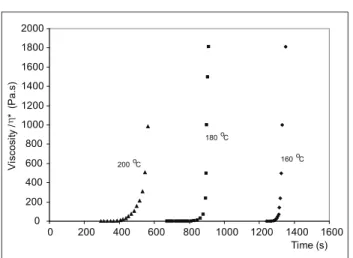
Figure 21 shows graphics of viscosity as a function of
time for the boron-modiied phenolic resin at isotherm
For composite processing, results of viscosity as a function of time and temperature are important, since they can
deine the schedule of the curing cycle. Figure 22 shows the
curing cycle that has been proposed for curing composites
made with the boron-modiied phenolic resin matrix. The
curing process started at a heating rate of 3°C/min up to
160°C. After 60°C, the material exhibits adequate low, which allows the wetting of the reinforcing ibers. After ~30 minutes at 160°C, pressure of 0,7 MPa and vacuum are applied to the molding system, for compaction of the layers. After 1 hour at 160°C, the curing proceeds up to 220°C.
The results showed that there is no evidence of significant differences in the average values of ILSS for both materials, although there is a gently failure mode of the composite made with commercial phenolic resin in relation to the composite made with boron-modified phenolic resin. This is not a surprise, since interlaminar shear properties are a matrix dominated property.
Figure 21: Viscosity as a function of time at temperature isotherms of 160°C, 180°C and 200°C for the boron-modiied phenol resin.
0 200 400 600 800 1000 1200 1400 1600 1800 2000
0 200 400 600 800 1000 1200 1400 1600 Time (s)
V
isco
si
ty
/
*
(P
a
.s)
160 oC 180 oC
200 oC
η
Figure 22: Curing cycle proposed for the boron-modiied phenolic resin for composite preparation.
Results of interlaminar shear strength
Figure 23 shows the interlaminar shear stress (ILSS) as a
function of delection for boron-modiied phenolic resin composite and silica iber, and Fig. 24 shows comparative
results of composites made from commercial phenolic
resin and silica ibers.
Figure 23: ILSS as a function of delection for boron-modiied phenolic resin composite/silicon iber.
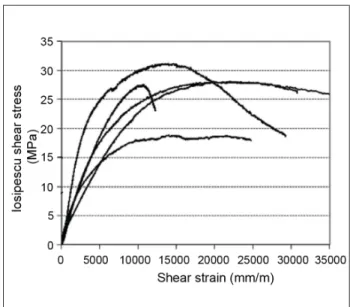
Results of Iosipescu shear test
The value of the Iosipescu shear strength is around 25 MPa, corresponding to a deformation closer to 1.5%. The shear modulus (G12), calculated at the limit of 20 MPa, was approximately 3.5 GPa, which is a value close to many other polymer composite systems. Figure 25 shows the Iosipescu shear strengh as a function of shear
strain for the boron-modiied/phenolic resin. Figure 26
shows a representative Iosipescu composite specimen after the test. It can be observed that the failure region is located between the V-notches, which is a representative and valid failure mode for Iosipescu shear.
From DSC analysis it is also possible to see the superiority of the boron resin, comparing to the commercial phenolic resin.
ILSS and shear resistance Iosipescu tests have been done
in silica iber and boron phenolic resin composite. ILSS was ~16 MPa for silica iber/phenolic resin and silica iber/boron-modiied phenolic. The in-plane V-notch Iosipescu shear for silica iber reinforced with boron-modiied phenolic resin was 25 MPa.
ACKNOWLEGMENT
The authors thanks to Unesp-FEG, Dr. M. L. Costa, for the DSC and rheometer measurements, Wenka Schweiker from ICT (Germany) for some FT-IR measurements and for Dr. D. Camarano, from CDTN/CNEN, for the thermal diffusivity measurement.
Figure 26: View of the failure in the central V-notch region of the Iosipescu specimen of boron-modiied phenolic resin/silica iber.
Figure 25: Iosipescu shear stress as a function of shear strain for a boron-modiied phenolic resin/sílica iber composite.
CONCLUSIONS
A boron-modiied phenolic resin was prepared from the
reaction of salicyl alcohol and boric acid using the ratio alcohol:acid of 2:1. The resulting compound has been fully characterized by NMR, IR, DSC, TG and elemental analysis, and it showed properties that indicate promising processing applications.
REFERENCES
Abdalla, M.O., Ludwick, A., Mitchell, T., 2003,
“Boron-modiied phenolic resin for high performance
applications”, Polymer, Vol. 44, pp. 7353-7359.
America Patash Chem Corp., 1964, “British patent 957611”..
Ancelotti Jr., A.C., 2006, “Efeitos da porosidade na resistência ao cisalhamento e nas propriedades dinâmicas
de compósitos de ibra de carbono/resina epóxi”, Master of
Science dissertation, Intituto Tecnológico de Aeronáutica, São José dos Campos, SP, Brazil.
Bonner, J.G., Hope, P.S., 1993, “Compatibilities and reactive blending”. In: Folkes, M.J., Hope, P.S., “Polymer blends and alloys”, Blackie Academic and Professional, London, pp.46-74.
Casiraghi, G., et al., 1980, “Selective Reactions between Phenols and Formaldehyde. A Superior Synthesis of Salicyl Alcohols”, Synthesis, Vol. 2, pp. 124-125.
Castro, L.D., 1991, “Inhibition of Oxidation of Carbon Materials”. PhD Thesis, University of Bath, UK.
Clayton, W.A., Fabish, T.J., Lagedrost, J.F., 1969, “Thermal Conductivity of Phenolic Chars. Technical Report AFML-TR-69-313”, Air Force Materials Laboratory, Wright Air Force Base, Ohio-USA.
Costa, L., et al., 1997, “Structure-charring relationship in phenol-formaldehyde type resins”. Polymer Degradation and Stability, Vol. 56, No 1, pp. 23-35. doi: 10.1016/ S0141-3910(96)00171-1.
Fahrenholtz, S.R., Kwei, T.K., 1981, “Compatibility of polymer mixtures containing novolac resins”, Macromolecules, Vol. 14, pp. 1076-1079.
Gao, J.G., Liu, Y.F., Yang, L.T., 1999, “Thermal stability of boron-containing phenolformaldehyde resin”Polymer Degradation and Stability, Vol. 63, pp. 19-22.
Gao, J.G., Liu, Y.F., Yang, F.L., 2001, “Structure and properties of boron-containing bisphenol-A formaldehyde resin”, European Polymer Journal, Vol. 37, pp. 207-210.
Grenier-Loustalot, M.F., et al., 1996, “Phenolic resins .2.
Inluence of catalyst type on reaction mechanisms and
kinetics”, Polymer, Vol. 37, No 8, pp. 1363-1369.
Hirohata, T., Misaki, T., Yoshii, T.M., 1987,
“Improvement of lame retardance and heat resistance of
bromine, chlorine and boron modiied phenolic resins”,
J Soc Mater Sci Jpn (Engl Transl), Vol. 36, No 401, pp. 184-188.
Knop, A., Sheib, W., 1979, “Chemistry and application of phenolic resins”, Springer-Verlag, Berlin.
Knop, A., Pilato, L.A., 1985, “Phenolic resins”, Springer-Verlag, Berlin.
Lemon, P.H.R.B., 1985, “Phenol formaldehyde polymers for the bonding of refractories”, Brit. Ceram. Trans. J., Vol. 84, Nº. 2, pp. 53-56.
Lenghaus, K., Qiao, G.G., Solomon, D.H., 2000, “Model studies of the curing of resole phenol-formaldehyde resins. Part I.The behaviour of ortho quinone methide in a curing resin”, Polymer, Vol. 41, No.6, pp. 1973-1979.
McKee, D.W., 1991, “Oxidation protection of carbon materials”, In: Thrower, P.A., editor, “Chemistry and physics of carbon”, Vol. 23, pp. 173-232.
Liu, C.L., et al., 2007, “Evolution of microstructure
and properties of phenolic ibers during carbonization”,
Materials Science and Engineering A, Vol. 459, No 1-2, pp. 347-354.
Okoroafor, E.U., Villemaire, J.P., Agassant, J.F.,1992,
“The viscosity of immiscible polymer blends:inluences
of the interphase and deformability”, Polymer, Vol. 33, No 24, pp. 5264-5271.
Park, B.D., et al., “Polymer”, 1999, Vol. 40, No 7, pp. 1689-1699
Santos, W.N., Mummery, P., Wallwork, A., 2005, “Thermal
diffusivity of polymers by the laser lash technique”,
Polymer testing, Vol. 24, No 5, pp. 628-634.
Schmidt, D.L., Graig, R.D., 1982, “Advanced Carbon Fabric-Phenolic for Thermal Protection Application”, AFWAL US, AFWAL-TR-81-4136, USA.
Segal, C.L., 1967, “HighTemperature Polymers”, Marcel
Dekker, New York.
Serio, M.A., et al., 1991, “Pyrolysis of phenol-formaldehyde resin: experiments and modeling”. ACS Div. Fuel Chem. Prepr., Vol. 36, No 2, p. 664.
Smith, A.L, 1999, “Infrared Spectroscopy”, John Wiley &
US Army Armament Research, Development, and Engineering Center, SMCAR-BAC-S, 1991, “Military Handbook 754 (AR) Plastic Matrix Composites with Continuous Fiber Reinforcement”, Picatinny Arsenal, Dover, NJ, USA.
United States Patent and Trademark Ofice 4 045 398, 1977 .