Daniel Soares de Almeida*
Institute of Aeronautics and Space São José dos Campos – Brazil [email protected]
Carlos Alberto Alves Cairo
Institute of Aeronautics and Space São José dos Campos – Brazil [email protected]
Cosme Roberto M. Silva
University of Brasília Brasília – Brazil [email protected]
Maria do Carmo A.Nono
National Institute for Space Research São José dos Campos – Brazil [email protected]
*author for correspondence
Thermal barrier coating by
electron beam-physical vapor
deposition of zirconia co-doped
with yttria and niobia
Abstract: The most usual ceramic material for coating turbine blades is yttria doped zirconia. Addition of niobia, as a co-dopant in the Y2O3-ZrO2 system, can reduce the thermal conductivity and improve mechanical properties of the coating. The purpose of this work was to evaluate the inluence of the addition of niobia on the microstructure and thermal properties of the ceramic coatings. SEM on coatings fractured cross-section shows a columnar structure and the results of XRD show only zirconia tetragonal phase in the ceramic coating for the chemical composition range studied. As the difference NbO2,5-YO1,5 mol percent increases, the tetragonality increases. A signiicant reduction of the thermal conductivity, measured by laser lash technique in the zirconia coating co-doped with yttria and niobia when compared with zirconia-yttria coating was observed.
Keywords: TBC, EB-PVD, Zirconia, Niobia, Thermal conductivity.
INTRODUCTION
The great advantage of coatings is that it is possible to modify its response to the environment by changing only
the supericial part of the component, thus providing
completely different properties. Some of the obtained
beneits are: reduction of maintenance costs, increase
of the working temperature, reduction of thermal loads, resistance increase to erosion and corrosion and reduction of the high temperature oxidation (Funatani, 2000).
The electron beam-physical vapor deposition (EB-PVD) process enables to attain coatings with unique properties. The process parameters are adjusted so that the deposit has a columnar grain structure perpendicular to the interface. This morphology maximizes the resistance to strains that arise from differences in thermal expansion
coeficients. Other advantages are: aerodynamically
favorable smooth surface, better interaction with the substrate, greater thermal cycle tolerance and, hence, greater lifetime comparativeness with the plasma spray process (Xu, Goug and Deng, 1998; Schulz et al., 2000; Evans et al., 2001; Zhu et al., 2000; Goward, 1998; Nicholls, Deakin, Rickerby, 1999; Czek et al., 1999; Hass, 2001; Almeida et al., 2007 and 2006; Nicholls et al. 2002; Guo and Wang, 1998).
There are four primary constituents in a thermal
protection system. They comprise: (1) the thermal
barrier coating (TBC) itself based usually on ~8 wt.
% (8.7 mol % YO1.5) yttria stabilized zirconia; (2) the
metallic component, treated here as the substrate; (3) an aluminium containing bond coat (BC) located between the substrate and the TBC; and (4) a thermally grown
oxide (TGO), predominantly a-alumina, that forms
between the TBC and the bond coat. The TBC is the thermal insulator, the bond coat provides oxidation protection, since the zirconia is essentially transparent for the oxygen at high temperatures, and the metallic component, usually a nickel base super-alloy, sustains
the structural loads. The TGO is an oxidation reaction
product of the bond layer, and plays a role in the metal/ oxide adhesion. Each of these elements is dynamic and all interact to control the performance and durability (Mumm and Evans, 2001; Stöver and Funke, 1999).
When ZrO2 is utilized for technical applications, the
high-temperature polymorphs cubic (c) and tetragonal (t) phases should be stabilized at room temperature by the formation of solid solutions, which prevent deleterious tetragonal-to-monoclinic (m) phase transformation. The alloying oxides, which lead to the stabilization, are alkaline-earth, rare-earth, and actinide oxides. It has been suggested that
the factors that may inluence the stabilization are size,
valency, and concentration of solute cations and crystal structure of the solute oxides, where the valency and concentration determine the number of oxygen vacancies created by the formation of substitutional solid solutions (Kim, 1990; Lehmann et al. 2003).
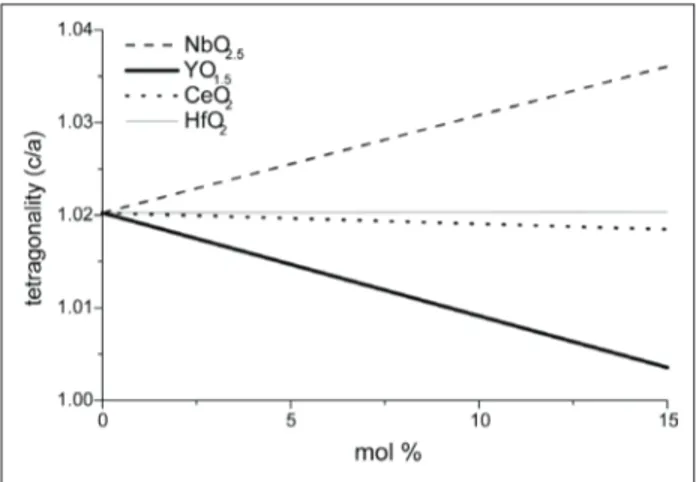
Dense zirconia-based materials already exhibit low thermal conductivity. The introduction of a stabilizer,
Figure 1: Inluence of the alloying oxide in the c/a axial ratio of
bulk zirconia-based ceramics.
required to avoid the detrimental effect of tetragonal to monoclinic phase transformation, is accompanied by the incorporation of a substantial amount of vacancies
providing an eficient source of phonons scattering
(Schulz et al. 2000). When a trivalent oxide, e.g., Y2O3,
is added to ZrO2 as a stabilizer, a certain amount of
lattice defects, e.g., oxygen vacancies and negatively
charged solutes, are produced in the ZrO2 lattice (Kim,
Tien, 1991).
The addition of Ta2O5, Nb2O5 and HfO2 to bulk Y2O3–
stabilized tetragonal ZrO2 increases transformation,
as for example the tetragonal (t) to monoclinic (m) transformation temperature, of the resulting zirconia ceramics. The enhanced transformability is related to the alloying effect on the tetragonality (c/a – cell
parameters ratio) of stabilized tetragonal ZrO2 (Fig.1),
subsequently, by adding these oxides the tetragonal distortion of the cubic lattice is increased. The increase in the tetragonality, due to alloying, is consistent with the increase in the fracture hardness and the increase in the t to m transformation temperature (Guo and Wang, 1998; Raghavan et al., 2001; Guo et al., 2001; Raghavan et al., 1998; Kim, 1990). Evidently, t-ZrO2
become unstable as their tetragonality increases toward 1.020, which corresponds to the c/b axial ratio of
m-ZrO2 at room temperature. On the other hand, they
become stable as the tetragonality decreases toward
unity, which corresponds to c-ZrO2. This relationship
allows the classiication of oxides into either a stabilizer
(decreasing tetragonality) or a destabilizer (increasing
tetragonality) for the t-ZrO2 phase (Kim, 1990; Kim
and Tien, 1991; Lee et al., 1998).
oxides, pentavalent oxides are positively charged when
dissolved in the ZrO2 lattice, the addition of these
oxides in the partially stabilized zirconia (PSZ) will
deinitely affect the original defect structure, as well
as its properties (Guo and Wang, 1998). The effect of doping with pentavalent oxides such as tantala and niobia (cationic radii in the +5 oxidation state ~0.68 Å for both) indicate that both ions reside as substitution defects in the zirconium lattice (ionic radius of the Zr4+ ion is 0.79 Å), annihilating oxygen vacancies
generated by yttria doping. Thus, the defects generated by the two dopants are also identical and would be expected to scatter phonons, i.e. can reduce the thermal conductivity, due to the difference in ionic radius and atomic bonding (Raghavan et al., 2001).
Thermal conductivity is one of the physical key properties of the TBCs and increasing its insulation capability emerges as a technical and economical challenge for engine manufacturers. Lowering TBCs thermal conductivity would increase the engine performance by
improving the combustion eficiency (higher turbine entry temperature), reduce the speciic fuel consumption, allow
the reduction of internal cooling, reduce the metallic component temperature and extend their lifetime (Hass, 2001; Kim, 1990; Kim and Tien, 1991; Raghavan et al., 1998; Lee et al., 1998).
The thermal conductivity, k, of ceramic coatings can be measured using either a direct (steady state) or a transient approach. In the latter, the thermal diffusivity,
α, of a material is measured and subsequently related to thermal conductivity using the relationship, as shown
in Eq. (1):
k = αcpρ (1)
Where cp is the heat capacity at constant pressure and ρis
the speciic mass of the material.
There are several classical techniques to measure the thermal properties of a material. Such classical methods,
which involved the itting of steady state and
non-steady state experimental temperature data to theoretical models, were usually time expendable. Furthermore, the large sized samples imposed intolerable limitations, usually tied to heat losses and contact resistance between the specimen and its associated heat source, heat sinks
and measurement devices. The lash method, used in
the present work, eliminated the problem of contact resistance and minimized heat losses by establishing
the measuring time to be suficiently brief so that very
little cooling could take place (Couto et al., 2003; Degiovaninni and Lament, 1986).
The thermal conductivity of partially stabilized ZrO2
The study of the considered ceramic coating is motivated
by the potential of the niobia to overcome the deiciencies
presented in conventional yttria stabilized zirconia coatings, i.e. high thermal conductivity when compared with plasma spray coatings and relatively low mechanical properties.
EXPERIMENTAL
SAE 304 stainless steel plates were used as metallic substrates. Both bond layer and ceramic top coating were EB-PVD deposited using one source 30kW electron beam equipment. This consists of an electron gun with accelerating voltage of 25 kV and beam current variation from 0 to 1.2 A. The vacuum system has an ultimate pressure of 10-6 torr (~10-4 Pa). A substrate holder
assembly is situated above the vapor source at a vertical
distance of 150 mm. A tungsten ilament is used to heat
the substrate by Joule effect to the desired temperature (~500oC) during bond coating deposition and ~900oC
during ceramic layer deposition), which is measured and maintained by a thermocouple and programmable temperature controller. A water-cooled copper crucible is used for evaporation of sintered targets. The ceramic targets (cylinders of 20 mm diameter and mass of 20 g) were prepared from cold compacted powder mixtures of zirconia, yttria and niobia sintered at 1700oC under
vacuum (10-4 Pa). The MCrAlY targets were prepared
from a Ni–31Cr–11Al–0.65Y (wt %) powder alloy sintered at 1340oC under vacuum (10-4 Pa). The bond
layer has a 25 mm thickness.
The crystalline phases of ceramic coatings, with an average thickness of 50 mm, are identiied by X-ray diffraction
using a X’Pert Philips PW 1380/80 diffractometer and a X’Pert – MRD Philips diffractometer with a PW 3050 goniometer. The ceramic coating microstructure and grain morphology were observed by SEM and the chemical
composition was estimated by EDS using a LEO 435 VPI
scanning electron microscope.
The speciic mass (ρ), disregarding pores and other defects, was calculated from the cell parameters (from XRD data) and molar concentrations of zirconia, yttria
and niobia (from EDS analysis), using the Eq. (2):
(2)
Where:
n: cations in unit cell (n=4 for fcc); AYO1.5: yttria atomic
mass (112.905); ANbO2.5: niobia atomic mass (132.905); AZrO2: zirconia atomic mass (123.22); x and y: molar
fraction of yttria and niobia, respectively; a and c: cell parameters of t-ZrO2 calculated from XRD data.
For thermal properties determinations of coatings, the Thermal Flash 2000/Holometrix equipment was used. This method, laser technique, consists of heating the front surface of a thermally insulated specimen with a high-intensity short-duration radioactive heat pulse and measuring the temperature evolution on the back surface by means of an infrared detector. The non-intrusive backside measurement method eliminates the concern and issues with sensor attachment to the sample, and removes all uncertainties associated with contact resistance and sensor measurement accuracy (Couto
et al., 2003). After stabilizing the sample at a desired uniform temperature (T0), a nearly instantaneous pulse of energy (usually laser, Xenon lamp or other discharge source) is imposed on its front surface, as well as on the temperature increase on the rear surface of the sample and is then recorded as a function of time. The thermal diffusivity is then determined by comparing this thermogram with theoretical models that describe this transient heat conduction phenomenon. Several
theoretical models are available for the lash method,
which includes adiabatic boundary conditions, heat losses, surface coating effects, among many other aspects. The values of thermal diffusivity (average of three measurements, for each sample at each temperature) were calculated in accordance with the Degiovaninni model (Degiovaninni and Lament, 1986). Considering that the energy of the laser is used only for heating the sample, disregarding the interfaces (contact resistance) and using Eq. (3) it is possible to calculate the coating thermal conductivity from Holometrix equipment measurements.
(3)
Where c is the heat capacity (J/kgK), r is the speciic
mass (g/cm3), a is the thermal diffusivity (cm2/s), k is the
thermal conductivity (W/mK), e is the thickness (m) and the index a, m and c is relative to the sample, metallic substrate and ceramic layer, respectively.
RESULTS AND DISCUSSION
without signiicant differences in the columns morphology.
However, for the sample 11, where the amount of niobia is higher, the columns diameter was increased.
in the coating primary growth direction (Bernier et al., 2003). However, the X-ray diffraction technique allows
determining, with suficient precision, the position of
the peaks. The position of the peaks is correlated with crystalline cell lattice parameters and they vary strongly
with the chemical composition of the ilms.
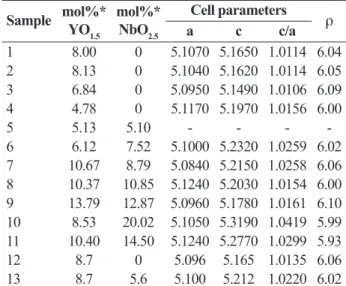
The chemical composition, the cell parameters deduced
from diffraction patterns and the values of speciic mass
of the coatings are reproduced in Table 1.
A
B
C
Figure 2: SEM of EB–PVD ceramic coatings fractured
cross-section. (A) Sample 1 (column diameter=1.15 mm), (B) Sample 6 (column diameter=1.29 mm), (C) Sample 11 (column diameter=2.53 mm).
Table 1: Chemical composition and lattice parameters of the
samples
Sample mol%*
YO1.5
mol%* NbO2.5
Cell parameters ρ
a c c/a
1 8.00 0 5.1070 5.1650 1.0114 6.04 2 8.13 0 5.1040 5.1620 1.0114 6.05 3 6.84 0 5.0950 5.1490 1.0106 6.09 4 4.78 0 5.1170 5.1970 1.0156 6.00 5 5.13 5.10 - - - -6 6.12 7.52 5.1000 5.2320 1.0259 6.02 7 10.67 8.79 5.0840 5.2150 1.0258 6.06 8 10.37 10.85 5.1240 5.2030 1.0154 6.00 9 13.79 12.87 5.0960 5.1780 1.0161 6.10 10 8.53 20.02 5.1050 5.3190 1.0419 5.99 11 10.40 14.50 5.1240 5.2770 1.0299 5.93 12 8.7 0 5.096 5.165 1.0135 6.06 13 8.7 5.6 5.100 5.212 1.0220 6.02 *From EDS analysis on ceramic coating cross-section.
Figure 3: Relation between difference (NbO2.5 -YO1.5) mol% and tetragonality (c/a).
X-ray diffractions with high angular resolution (0,0001o
for 2q) performed on the ceramic coating samples surface with different niobia contents show only the zirconia tetragonal phase. XRD techniques do not
allow the identiication of special textures related to
XRD peak intensity because the PVD coatings show a strong crystallographic texture and the diffraction patterns are taken normal to the substrate surface, not
Figure 3 shows the inluence of the difference (NbO2.5–
YO1.5) mol% on the zirconia tetragonality. The
of the zirconia-based coatings. Chemical composition was determined by EDS analysis on the ceramic
coating cross-section. As the difference (NbO2.5–YO1.5)
mol% increases, the ratio c/a (tetragonality) increases. Despite the compositional gradients in the coatings and inaccuracy of oxide semiquantitative analyses by EDS techniques, the linear regression shows a high linear
coeficient (R=0.920).
Research with sintered tablets (bulk material) of
stabilized tetragonal ZrO2 shows that they become
unstable as their tetragonality increases toward 1.020, at room temperature (Hass, 2001; Kim and Tien, 1991). This research agrees with the present work’s experimental results, in which niobia–yttria–zirconia
coatings with NbO2.5 contenting higher than 7 mol%
(c/a >1.020) had a tendency to spall after the deposition cycle. It is possible to evaluate the maximum content of niobia that can be added to the yttria-doped zirconia coating without losses in its mechanical properties. Thus, through the graph of Fig. 3, a coating with 8.7
mol% YO1.5 (8 wt.% yttria) can be co-doped with up to
10 mol% NbO2.5 (10.8 wt.% niobia).
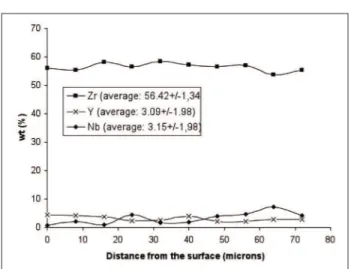
Figure 4 shows the typical microstructure of EB–PVD ceramic coating, as seen by SEM on polished cross-section. The ceramic layer shows that color bands associated with chemical composition changes due to the differences in saturation vapor pressure of the individual components as function of the temperature and complex chemical interactions between them. For these reasons, the evaporation of alloys is a selective process, resulting in depletion and enrichment in the melt pool and, consequently, in the coating.
remarkably for the niobia concentration, due to the difference in melting point and vapor pressure between niobia, zirconia and yttria. It is clear that compositional gradients can reduce the thermal stability due to
differences in layers thermal expansion coeficients.
Nevertheless, because of the high melting point of the ceramic, the liquid pool during evaporation is shallow
in comparison with target volume, there is not suficient
liquid volume for high level of segregation and as the
process is predominantly random, the inluence on the
thermal stability and in the X-ray data is not high.
Another factor that reduces the inluence of the multilayer
nature of the coatings with differences in composition between the layers in the XRD data is the X-ray penetration (attenuation length) (Henke et al., 1993). ZrO2 has an attenuation length of 17 mm (phonon energy of 8050 eV and incident angle of 90o), thus the XRD data is based
on integration or average of a signiicant thickness of the
coatings.
Two ceramic formulation coating samples (sample 12 and 13, Table 1) were used for determination of the coatings thermal conductivity. The measurements of thermal diffusivity samples are carried out on coatings with their substrates and bond coats attached to them. All samples were coated with colloidal graphite to optimize the laser energy absorption (black body) and to make the infrared sensor data acquisition uniform in the sample backside
during thermal diffusivity measurements. On account
of its high thermal conductivity value in comparison with zirconia (kgraphite = 24 W/m K, kzirconia = 1 W/m K, at 25 oC), the graphite layer (thickness of ~30mm) was not
considered in the calculations.
Figure 6 presents the coatings thermal conductivity variation with the temperature as calculate by using
Figure 4: SEM (BS mode) of an EB-PVD ceramic coating
polished cross-section (sample 3).
The results of EDS analysis performed on the ceramic coating cross-section are summarized in Fig. 5. The composition of the ceramic layer differs point-to-point,
Figure 5: EDS semi-quantitative analysis of ceramic layer
Eq. (3). The zirconia heat capacity values were taken from literature (Raghavan et al., 1998), an approach which is possible due to the little influence of the oxides dopants in these physical properties of zirconia. Thermal conductivity of standard 6–8 wt.% yttria partially stabilized zirconia EB-PVD coatings is typically 1.5–1.9 W/m K. The thermal conductivity of a ceramic layer depends on the intrinsic thermal conductivity of the bulk ceramic, which is linked to its composition and structure, and to the framework of the porous structure, i.e. pore volume fraction, geometry and distribution (Schulz et al., 2000; Schulz
et al., 2003).
The present work shows an yttria-doped zirconia coating, with mean thermal conductivity value of 1.17 W/m K significantly lower than those indicated by literature for EB-PVD coatings (1.5–1.9 W/m K). This reduction can be explained by the coating thickness. The thermal conductivity of EB-PVD PYSZ coatings strongly depends on the coating thickness with lower values for thin TBCs, this effect is caused by the different microstructure across the coating roughly characterized by a fine grained inner zone and a coarse grained outer zone (Rätzer-Scheibe et al., 2006). A 50% reduction in the yttria niobia co-doped zirconia
coating thermal conductivity (average value: 0.54 W/m
K) was observed when compared with yttria-doped zirconia coating.
Schulz et al. developed a model based on solid state physics considerations regarding heat conduction mechanisms in disordered oxide ceramics for the calculation of the thermal conductivity of zirconia based materials doped with trivalent ions and co-doped
with pentavalent metallic ions, showing that signiicant
decrease in thermal conductivity (up to 40%) can be achieved, when compared to the standard 8 wt.% yttria partially stabilized zirconia.
The reduction of almost 50% in the thermal conductivity coating promoted by niobia addition can be attributed to
several factors: the increase in the level of porosity of
the yttria niobia co-doped zirconia coating; the phonons scattering promoted by the ionic radii differences and chemical bonds between matrix (zirconia) and dopants (niobia and yttria) and, in lower degree, to the small
reduction of the speciic mass coating promoted by the
niobia addition.
CONCLUSIONS
The niobia addition, up to 6 wt.%, as co-dopant in the
yttria partially stabilized zirconia coatings is insuficient
to change its microstructure.
The laser lash technique in conjunction with Degiovaninni model demonstrates eficiency to
determine thermal conductivity of the TBC attached to the substrates.
The single-phase tetragonal niobia and yttria co-doped zirconia coatings show a lower thermal conductivity than conventional 6-8 mol% yttria stabilized zirconia coating, the material conventionally used for thermal barrier coating.
ACKNOWLEDGMENT
The authors express their gratitude to FAPESP (process
number: 02/06514-1) and CNPq (process number: 490845/2006-1) for the inancial support.
REFERENCES
Almeida, D. S. et al., 2006, “EB-PVD TBCs of Zirconia Co-doped with Yttria and Niobia, a Microstructural Investigation”, Surface and Coatings Technology, Vol. 200, pp. 2827-2833.
Almeida, D. S. et al., 2007, “Thermal conductivity investigation of zirconia co-doped with yttria and niobia
EB-PVD TBCs”, Materials Science and Engineering: A, Vol.
443, pp. 60-65.
Bernier, J. S., et al., 2003, “Crystallographic texture of
EB-PVD TBCs deposited on stationary lat surfaces in a
Figure 6: Variations of coatings thermal conductivity with
multiple ingot coating chamber as function of chamber position”, Surface and Coatings Technology, Vol. 95-99, pp. 163-164.
Couto, P.; et al., 2003, “Flash method standardization in Brazil for the measurement of solid thermophysical
properties”, In: Metrologia-2003, Pernambuco. Anais.... Recife, Pernambuco, Brasil, Sociedade Brasileira de Metrologia.
Czek, N. et al., 1999, “Studies of the bond-coat oxidation and phase structure of TBC”, Surface and Coatings Technology, Vol. 113, pp. 157-164.
Degiovaninni, A., Lament, M., 1986, “Une nouvelle
technique d’identiication de la diffusivite thermique pour de methode lash”, Revue de Physique Appliquée, Vol. 21, pp.
229-237.
Evans, A. G., He, M. Y., Hutchinson, J. W., 2001, “Mechanics-based scaling laws for the durability of TBC”, Progress in Materials Science, Vol. 46, No 3-4, pp. 249-271.
Funatani, K., 2000, “Emerging technology in surface
modiication of light metal”, Surface and Coatings
Technology, Vol. 133-134, pp. 264-272.
Goward, G. W., 1998, “Progress in coating for gas turbine airfoils”, Surface and Coatings Technology, Vol. 108-109, pp. 73-79.
Guo, H. et al., 2001, “Microstructure investigation on gradient porous TBC prepared by EB-PVD”, Scripta Materialia, Vol. 44, No 4, pp. 683-687.
Guo, X.; Wang, Z., 1998, “Effect of niobia on the defect structure of yttria-stabilized zirconia”, Journal of the European Ceramic Society, Vol. 18, pp. 237-240.
Hass, D.D., 2001, “Thermal barrier coatings via directed vapor deposition” 281p. Doctorate thesis, University of Virginia, Charlottesville, VA.
Henke, B.L. et al., “Atomic Scatering Facts for the Elements”, Atomic Data and Nuclear Data Tables, Vol. 54, No 2, p. 181.
Kim, D. J., 1990, “Effect of Ta2O5, Nb2O5, and HfO2 alloying on the transformability of Y2O3-stabilized
tetragonal ZrO2”, Journal of the American Ceramic
Society, Vol. 1, No 73, pp. 115-20.
Kim, D. J., 1990, “Effect of Ta2O5, Nb2O5, and HfO2 alloying on the transformability of Y2O3-stabilized
tetragonal ZrO2”, Journal of the American Ceramic
Society, Vol. 1, No 73, pp. 115-20.
Kim, D. J.; Tien, T. Y., 1991, “Phase stability and physical
properties of cubic and tetragonal ZrO2 in the system ZrO2
– Y2O3 – Ta2O5”, Journal of the American Society, Vol. 12, No 74, pp. 3061-65.
Lee, D. Y.; Kim, D. J.; Cho, D. H., 1998, “Low thermal phase stability and mechanical properties of Y2O3 and Nb2O5 co-doped tetragonal zirconia polycrystal ceramics”, Journal of Materials Science Letters, Vol. 17, pp. 185-187.
Lehmann, H. et al., 2003, “Thermal conductivity and thermal expansion coefficients of the lanthanum rare-earth-element zirconate system”, Journal of the American Ceramic Society, Vol. 86, No 8, pp.1138-44.
Mumm, D. R.; Evans, A. G.; Spitsberg, I. T., 2001, “Characterization of a cyclic displacement instability for
a TGO in a TBC”, Acta Materialia, Vol. 49, No 12, pp.
2329-2340.
Nicholls, J. R. et al., 2002, “Methods to reduce the thermal conductivity of EB-PVD TBCs”, Surface and Coatingss Technology, No 151-152, pp. 383-391.
Nicholls, J.R.; Deakin, M.J.; Rickerby, D. S., 1999, “A comparison between the erosion behavior of thermal spray and electron beam physical vapour deposition thermal barrier coating”, Wear, Vol. 233-235, pp. 352-361.
Raghavan, S. et al., 1998, “The effect of grain size, porosity and yttria content on the thermal conductivity of nanocrystalline zirconia”, Scripta Materialia, Vol. 39, No 8, pp. 1119-1125.
Raghavan, S. et al., 2001, “Thermal properties of zirconia co-doped with trivalent and pentavalent oxides”, Acta Materialia, Vol. 49, No 1, pp. 169- 179.
Rätzer-Scheibe, H-J. et al., 2006, “The effect of coating thickness on the thermal conductivity of EB-PVD PYSZ thermal barrier coatings”, Surface and Coatings Technology, Vol. 200, pp. 5636-5644.
Schulz; et al., 2003, “Some recent trends in research and technology of advanced TBCs”, Aerospace Science and Technology, Vol. 7, n. 1, pp. 73-80, 2003.
Stöver, D.; Funke, C., 1999, “Directions of the development of TBCs in energy applications”, Journal of Materials Processing Technology, Vol. 92-93, pp. 195-202.
Xu, H.; Goug, S., Deng, L., 1998, “Preparation of thermal barrier coating for gas turbine blades by EB-PVD”, Thin Solid Films, Vol. 334, pp. 98-102.
Zhu, D. et al., 2000, “Thermal conductivity of EB-PVD thermal barrier coatings evaluated by a steady–state laser
heat lux technique”, Ohio: NASA, 18 p.